


Published 24 July 2026
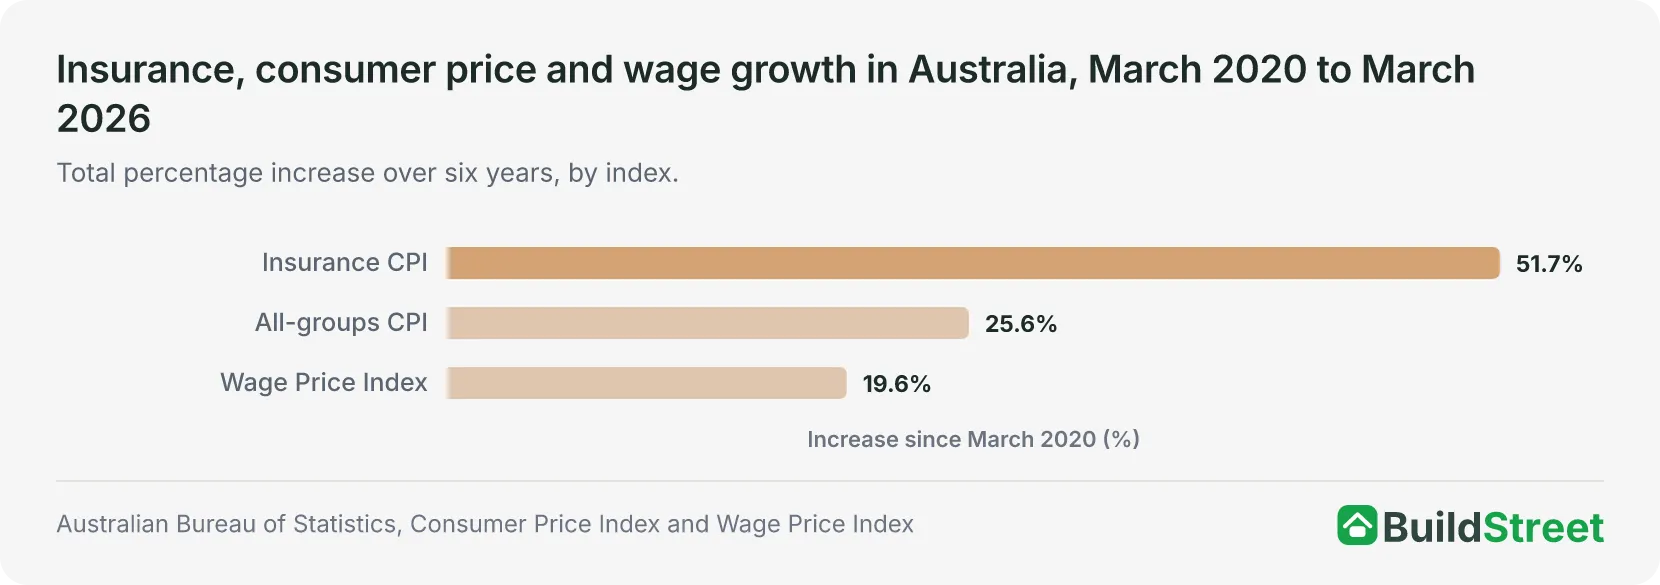
The average combined home and contents insurance premium in Australia rose from $1,612 in 2021–22 to $2,360 in 2024–25, an increase of 46.4%, according to the Australian Competition and Consumer Commission’s June 2026 Insurance Monitoring Report. Over the longer run, the Australian Bureau of Statistics’ broader insurance price index rose 51.7% between the March quarters of 2020 and 2026, well ahead of the 25.6% rise in overall consumer prices and the 19.6% rise in wages over the same period.
The increase has coincided with higher rebuilding costs, a sharp but temporary rise in reinsurance costs, and a run of costly natural disasters, though no single factor fully explains the increase. The latest data also shows that premium trends vary across Australia. Premiums are still climbing nationally, but reinsurance costs have started to fall, insurer profitability has improved, and one region recorded the fastest premium growth in the country despite having among the lowest average premiums.
 What does it cost to build a house in Australia?State-by-state build costs, from materials and labour through to land, and how the totals compare across Australia's capital cities.
 Construction labour shortages in Australia: which trades are most needed?Which trades remain in national shortage, and how labour and materials costs have pushed construction prices higher since 2020.
Section 01 · The headline number
Home insurance premium increases since 2021–22
The average combined home and contents premium reached $2,360 in 2024–25, up from $1,612 in 2021–22, a rise of 46.4% over three years. Building-only cover rose at a similar pace, up 48.4% to $1,852, while contents-only cover rose more slowly, up 20.1% to $531.
These are mean premiums, not medians. Mean values can be affected by a relatively small number of very high premiums. The ACCC report does not publish a national median home insurance premium. The three product figures also represent different groups of policies, so they cannot be combined into a single insurance cost figure.
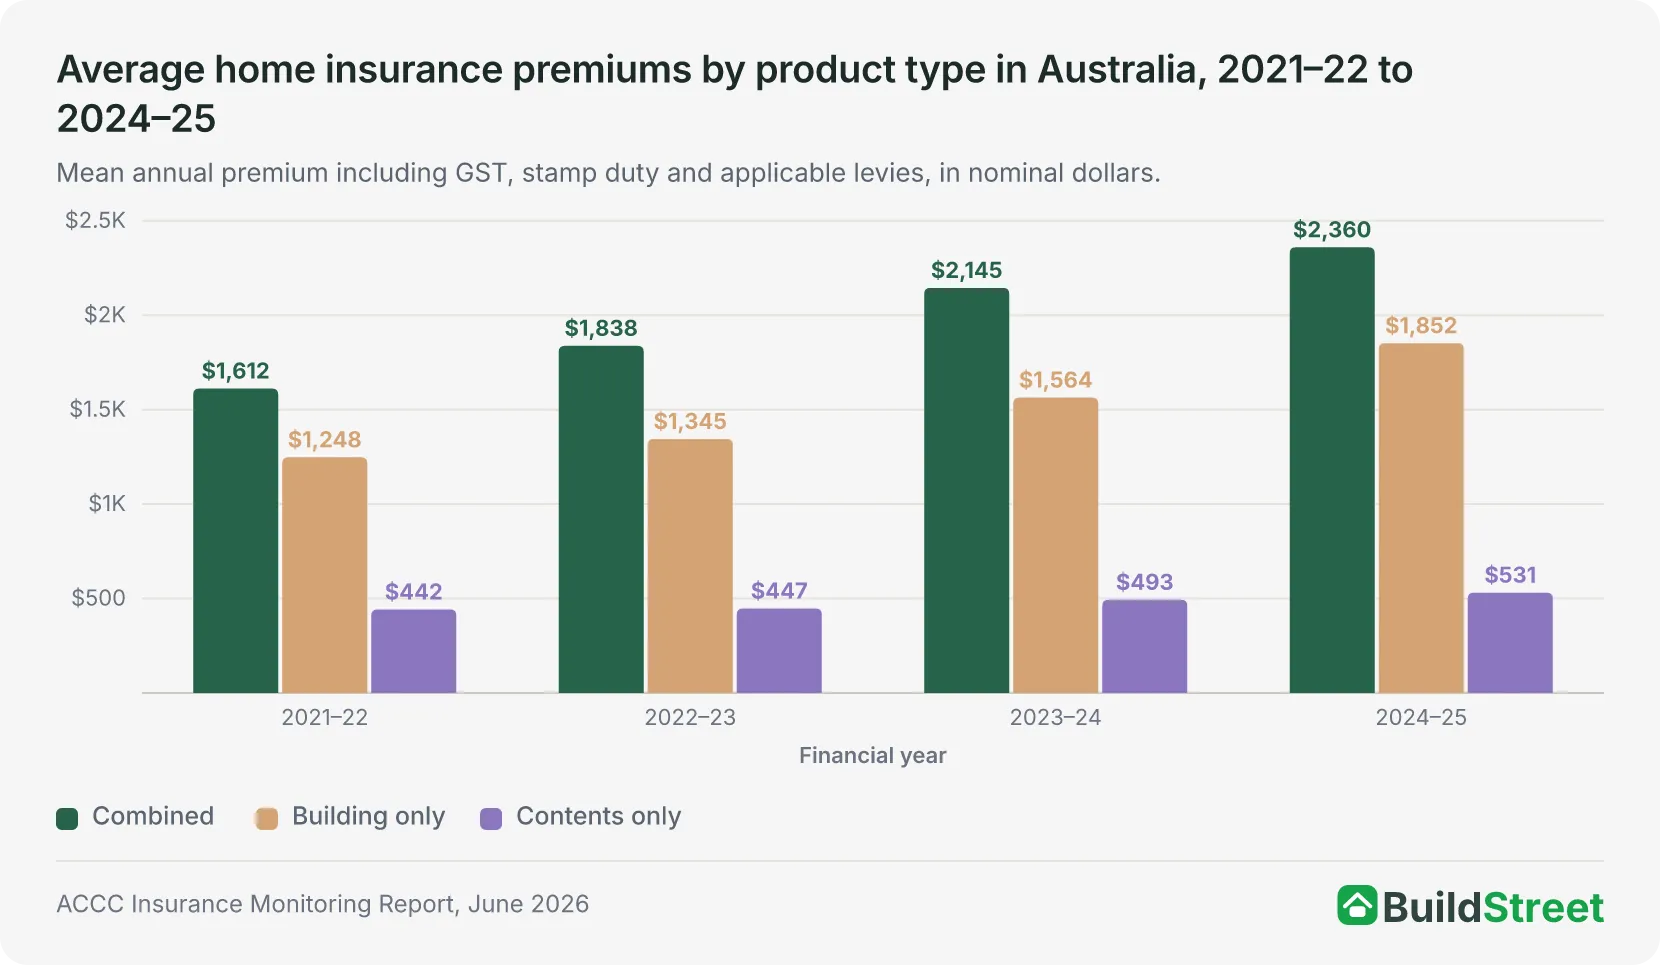
Measured in 2024–25 dollars, the combined premium rose from $1,841 to $2,360, a real increase of 28.2% after adjusting for inflation. The gap between the nominal rise (46.4%) and the real rise (28.2%) shows that general price inflation accounts for part, but not most, of the combined premium increase.
The effect of adjusting for inflation differs by product. The real increase was 30.0% for building cover, compared with a nominal increase of 48.4%. For contents cover, the increase fell from 20.1% in nominal terms to 5.1% after inflation. This means that most of the increase in contents premiums disappears once general inflation is removed, while building and combined premiums still record substantial real increases.
Over the longer period, APRA estimates that average home insurance premiums rose by 7.2% a year between 2010 and 2025, compared with average annual wage growth of 3.1%.
| Home insurance premiums by product type in Australia: full four-year series | ||||||||
|---|---|---|---|---|---|---|---|---|
| Policy type | 2021–22 | 2022–23 | 2023–24 | 2024–25 | Nominal increase | Real increase* | Monthly | Weekly |
| Combined home and contents | $1,612 | $1,838 | $2,145 | $2,360 | +46.4% | +28.2% | $196.67 | $45.38 |
| Home building only | $1,248 | $1,345 | $1,564 | $1,852 | +48.4% | +30.0% | $154.33 | $35.62 |
| Home contents only | $442 | $447 | $493 | $531 | +20.1% | +5.1% | $44.25 | $10.21 |
Source · ACCC Insurance Monitoring Report, June 2026.
The market behind these premiums is also expanding. Gross earned premium across the 15 insurers the ACCC monitors reached $14.0 billion in 2024–25, up 10% from $12.8 billion the year before. Net profit before tax across home, contents, strata and eligible small business insurance reached $2.8 billion in 2024–25, up 154% on the prior year. The ACCC attributed the increase to higher premium rates, favourable reinsurance outcomes, lower underwriting costs and improved investment returns. Three of the 15 insurers monitored still recorded a net loss.
APRA’s quarterly data for the householders class of business shows premium revenue and claims moving in opposite directions over the latest annual comparison. Gross accrued premium rose 7.7%, to $4.258 billion in the March quarter of 2026 from $3.954 billion a year earlier, while gross claims incurred fell 30.9% over the same quarter, to $3.247 billion from $4.698 billion. APRA’s premium figure measures total industry revenue rather than the price of an individual policy. It can change because of policy numbers, insured values and levels of coverage, as well as premium prices.
Section 02 · Against CPI and wages
How insurance price growth compares with CPI and wages
Australia’s insurance price index rose 51.7% between the March quarters of 2020 and 2026, compared with a 25.6% rise in the broader consumer price index and a 19.6% rise in the Wage Price Index over the same six years. Insurance prices grew 26.1 percentage points faster than overall consumer prices, and 32.1 percentage points faster than wages, over that period.
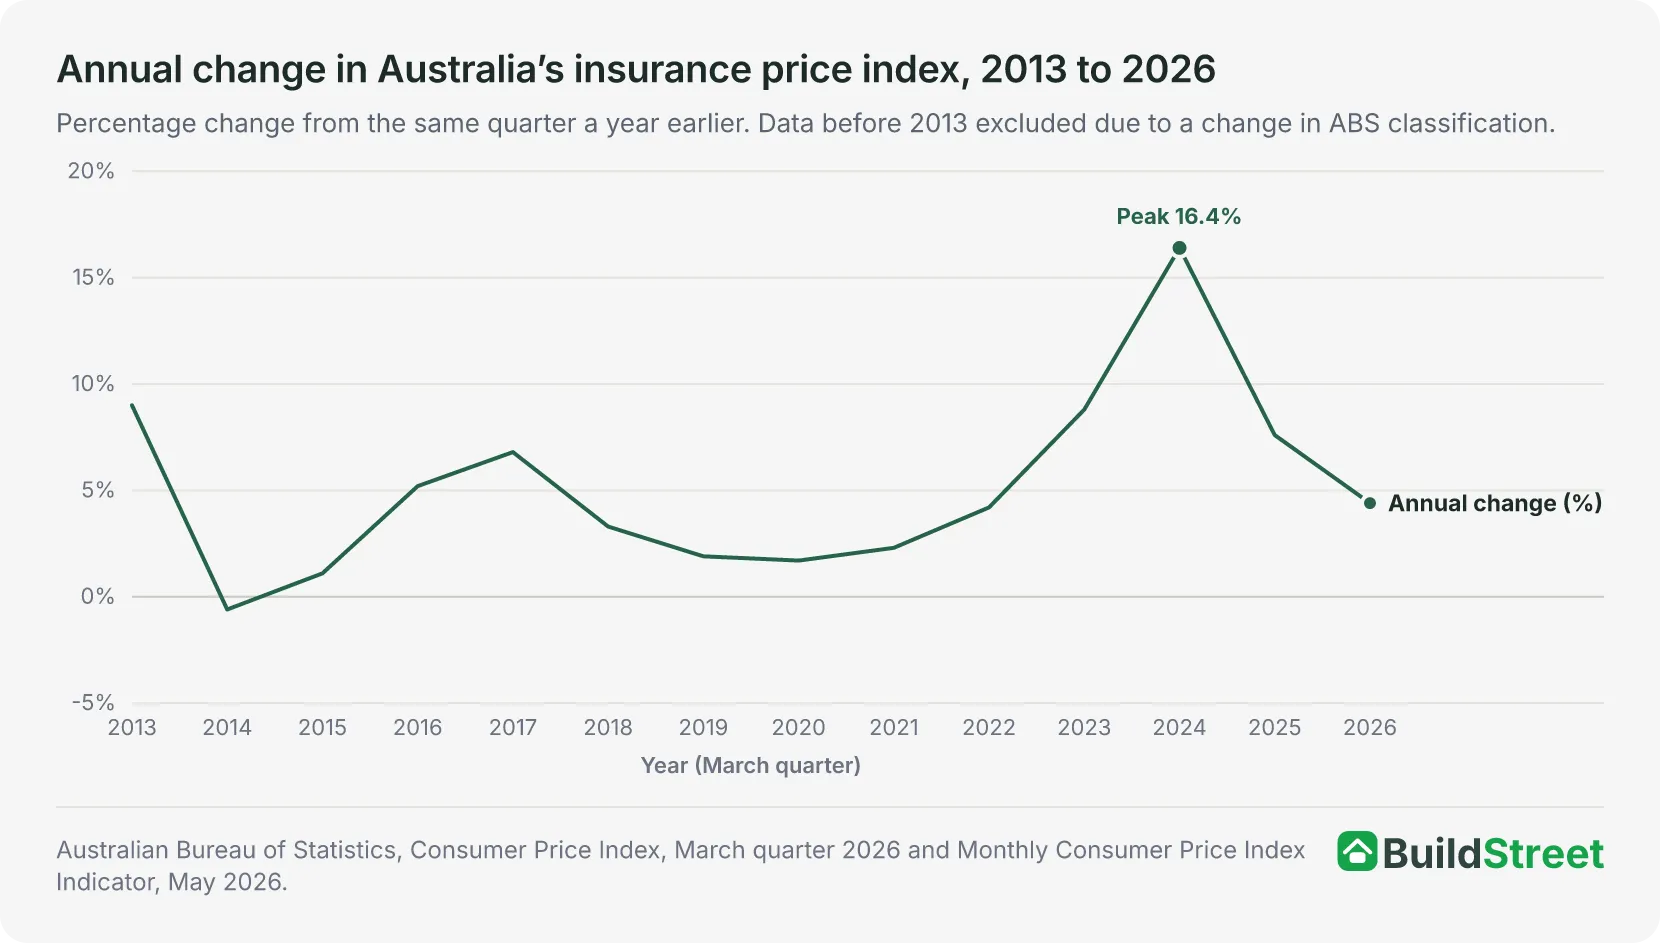
The gap has narrowed but remains. In the most recent 12 months, insurance prices measured by the newer monthly CPI series rose 5.5%, compared with a 4.0% rise in the all-groups CPI. The Wage Price Index rose 3.3% in the year to March 2026, its latest available period.
The insurance and CPI figures therefore cover a different annual period from the wage figure. They show the latest available rate of change in each index, rather than a precise like-for-like comparison for the same 12 months. The figures also do not measure the share of household income spent on insurance.
Section 03 · Inside the premium
What makes up a home insurance premium?
Weather-related risks account for 28% of the average home insurance premium, while non-weather risks such as fire, theft and accidental damage account for a further 21%, based on a modelled breakdown of current policies. Reinsurance makes up 10%, operating expenses 20%, and taxes, levies and government charges make up the remaining 21%.
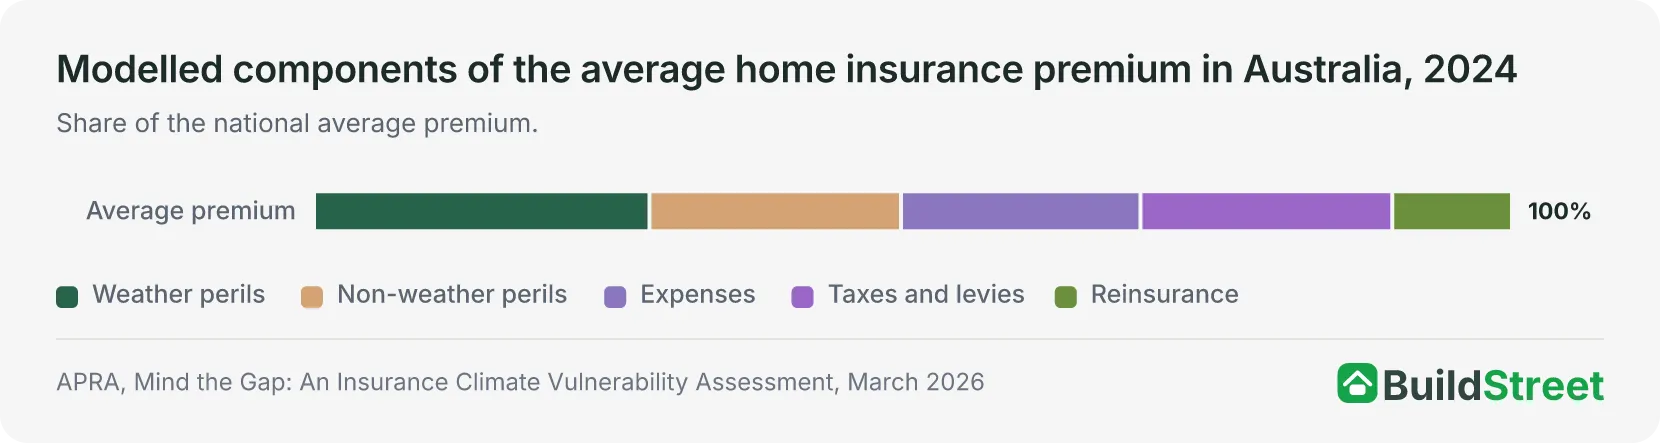
Combined, weather and non-weather claims-related costs make up just under half of the average premium. Expenses, taxes, levies and reinsurance make up the rest. The sections below examine three factors associated with home insurance costs: rebuilding costs, natural disasters and the reinsurance market that insurers use to spread risk.
Section 04 · Rebuilding costs
How construction cost inflation affects home insurance premiums
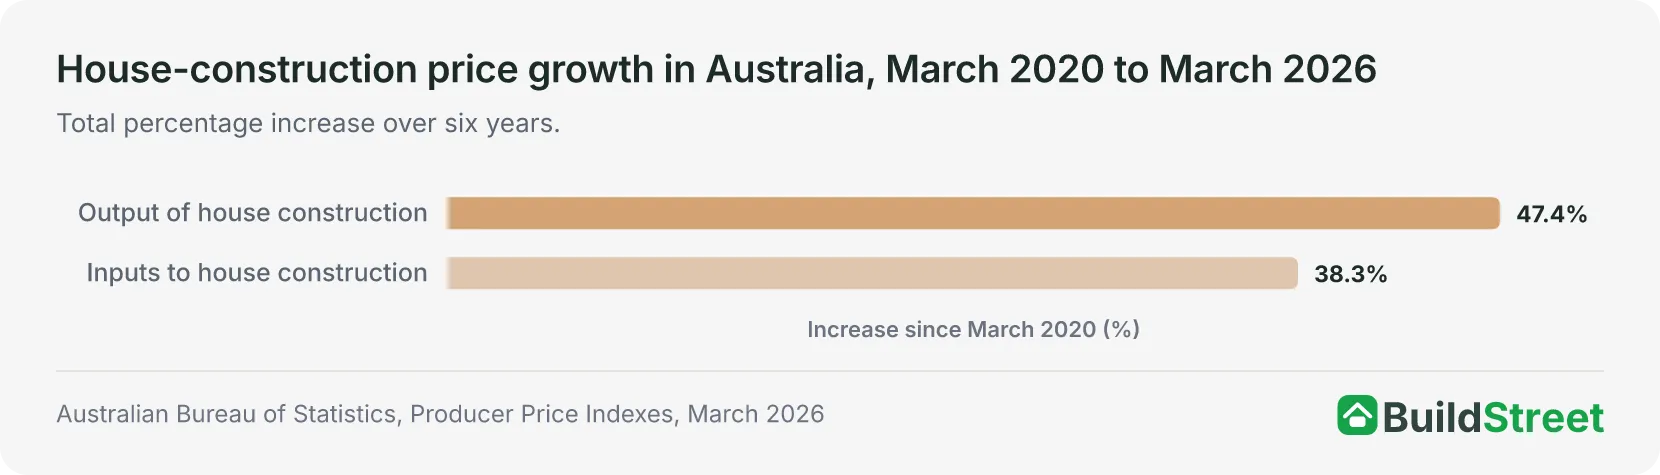
Australia’s house-construction output prices rose 47.4% between the March quarters of 2020 and 2026, while prices for inputs to house construction, which measure material costs across a weighted average of six capital cities, rose 38.3% over the same period. Output prices are the broader measure and include materials, labour and builder margins. Input prices measure material costs alone.
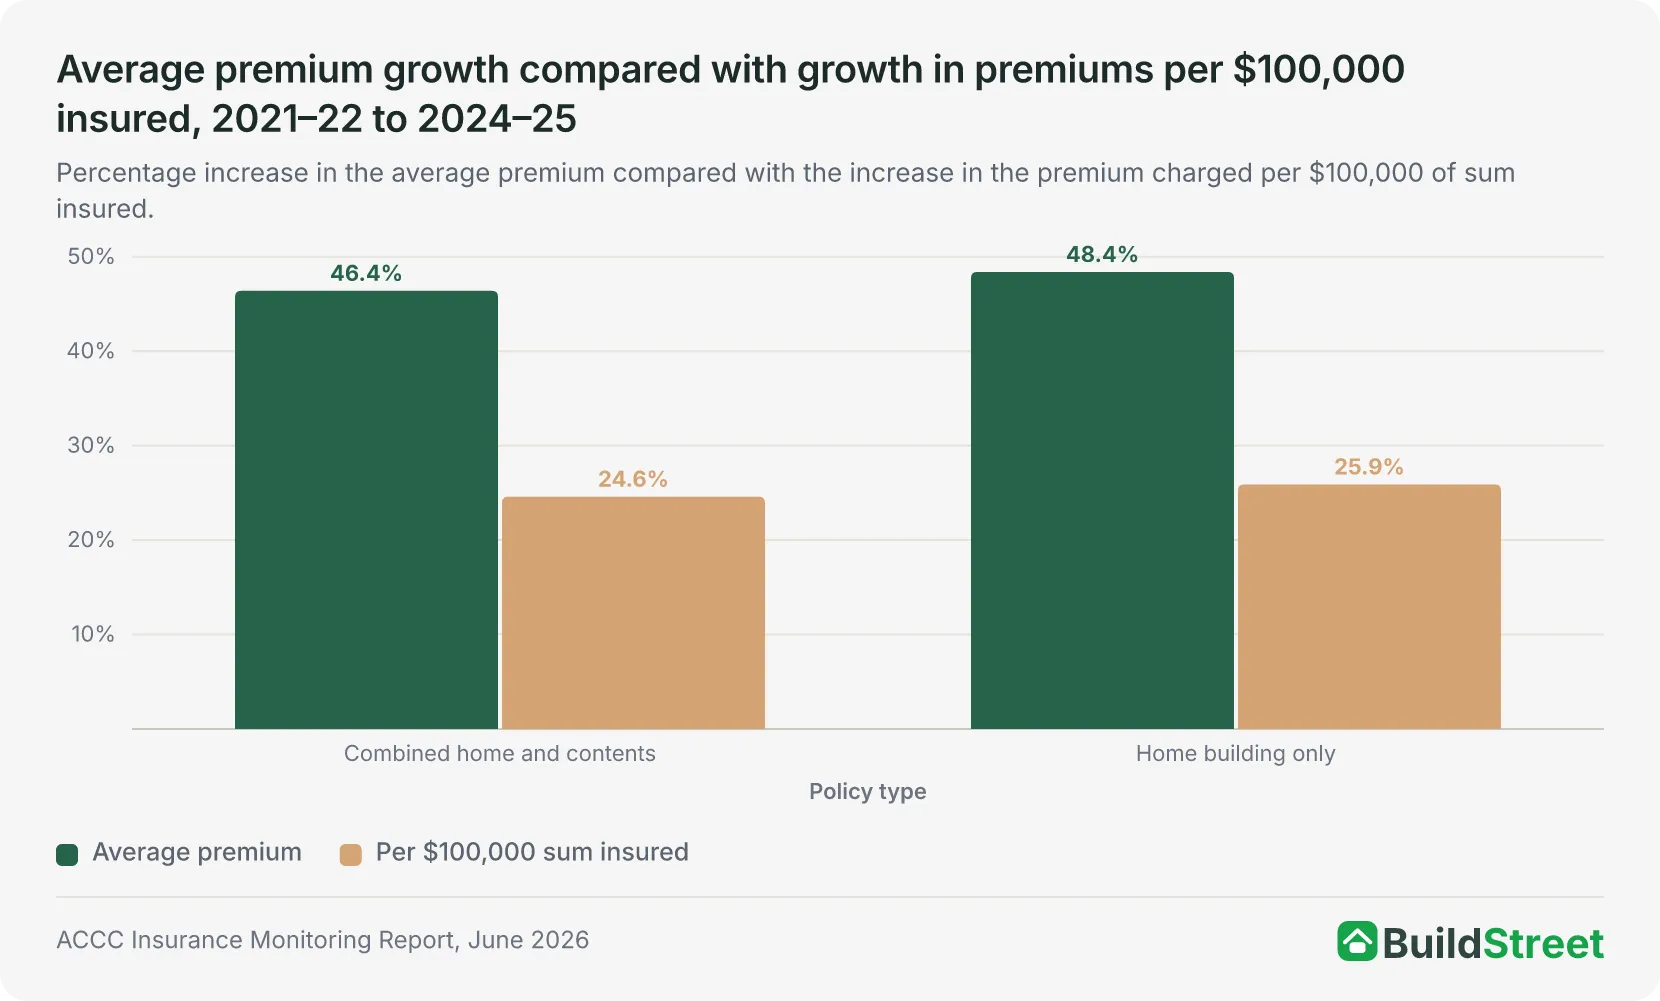
Average combined premiums rose by 46.4% between 2021–22 and 2024–25, while the average premium per $100,000 insured rose by 24.6%. Together, these measures indicate that both higher sums insured and higher pricing per $100,000 contributed to premium growth. The percentage changes do not provide an additive breakdown of each factor’s contribution.
For building-only cover, the average premium rose by 48.4%, while the premium per $100,000 insured rose by 25.9%. As with combined cover, these figures indicate changes in both insured values and pricing per $100,000, but do not isolate the exact contribution of each factor.
Section 05 · Disaster losses
Why home insurance premiums can rise when disaster losses fall
Extreme weather events cost the insurance industry $4.8 billion in insured losses in 2025, from 294,000 claims. This was 727% higher than the year before and the second-highest loss total across the four calendar years shown. That followed a lower-loss year in 2024, when insured losses from extreme weather totalled $585 million, the lowest of the four years, although premiums continued to rise.
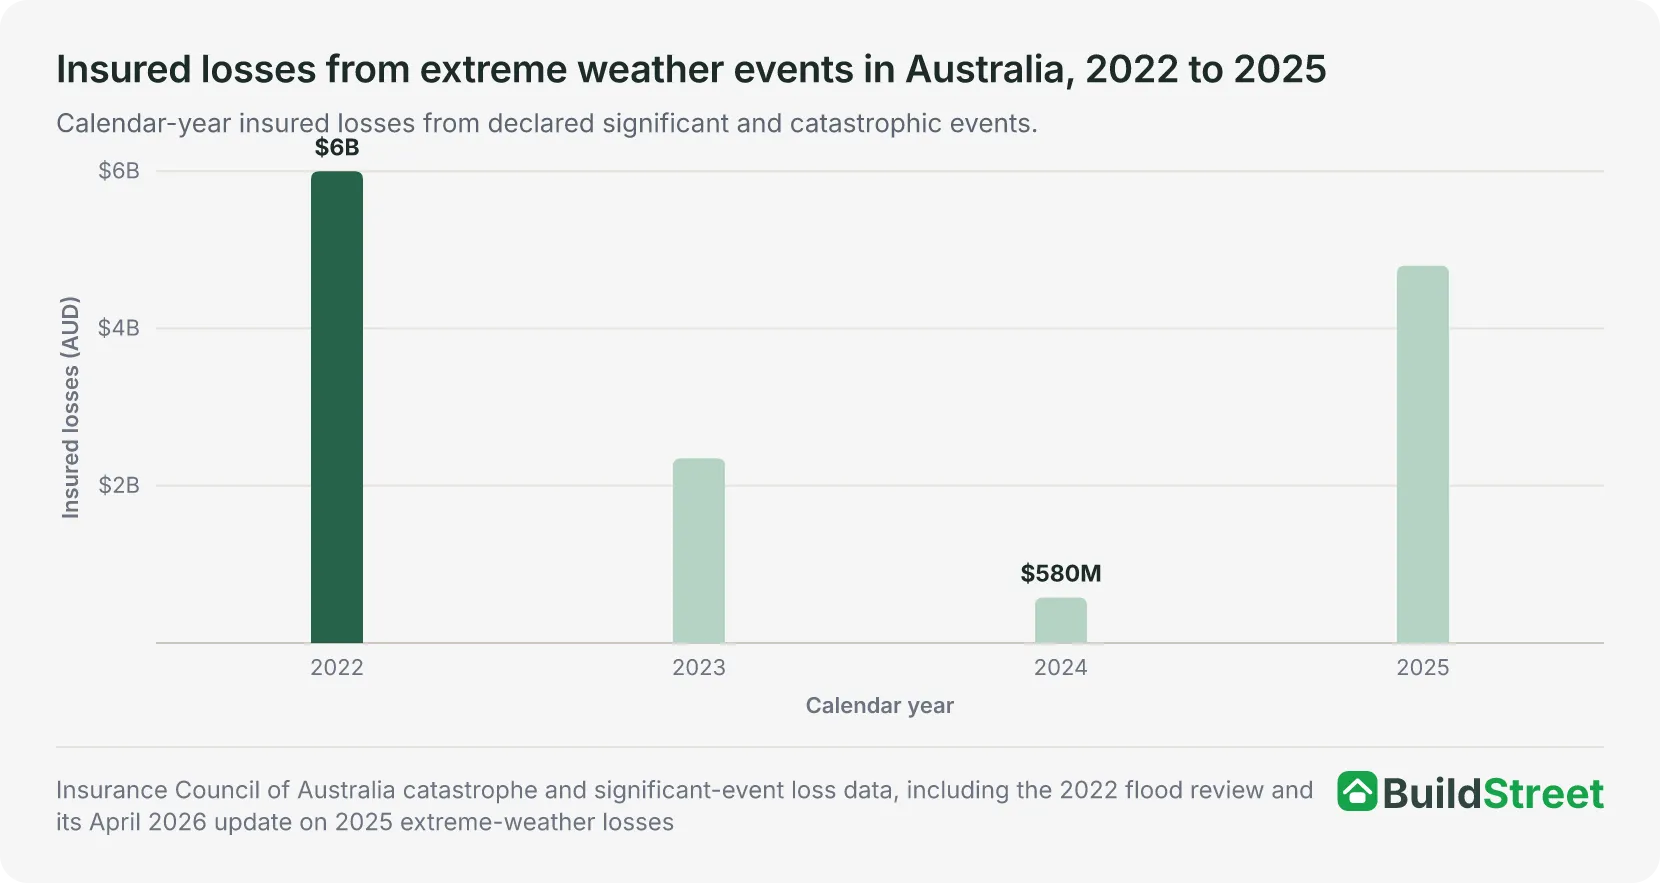
The February–March 2022 floods across northern New South Wales and south-east Queensland remain the costliest single event in this period. They generated more than 240,000 claims worth $6 billion, including $3.4 billion in home property claims and $710 million in home contents claims.
Ex-Tropical Cyclone Alfred, which struck south-east Queensland and northern New South Wales in March 2025, generated the most claims of any other single event that year, more than 133,000, for insured losses of $1.5 billion. It was overtaken as the costliest event of 2025 by a severe storm and hail event across Queensland and New South Wales in November, which produced insured losses of $1.78 billion from around 93,000 claims. Cyclone Jasper in 2023 generated insured losses of $409 million from around 10,500 claims.
For home and contents insurance specifically, the ACCC reported that gross claims costs fell by $224 million to $6.3 billion in 2024–25, with about $2.0 billion of that offset by reinsurance recoveries. Official data does not provide a percentage-point breakdown of how much of the premium increase since 2020 is attributable separately to floods, cyclones, bushfires, building costs or reinsurance.
Modelled national estimates in 2024 dollars, not observed claims. Source: APRA, Mind the Gap: An Insurance Climate Vulnerability Assessment, March 2026.
Section 06 · Reinsurance
How reinsurance costs affect home insurance premiums
Reinsurance costs for home and contents insurance outside northern Australia rose more than 19% between 2022–23 and 2023–24, from $3.4 billion to $4.0 billion. They then fell by 6%, or $231 million, in 2024–25. This was the first annual fall in these costs outside northern Australia since 2017–18.
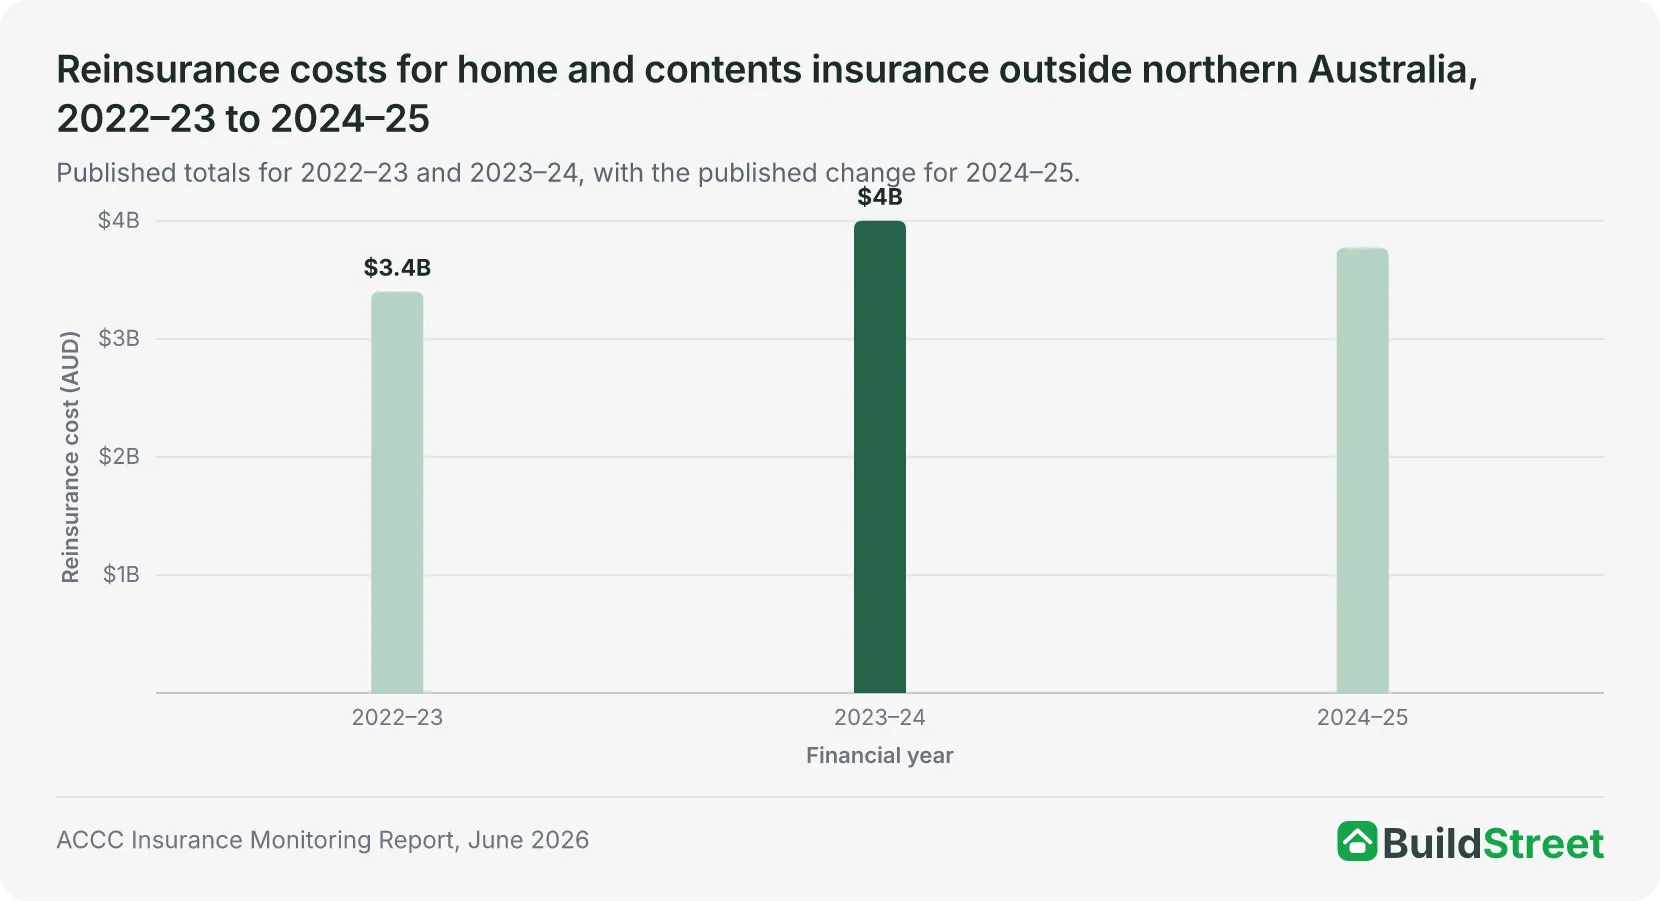
In northern Australia, total reinsurance costs fell 21%, from $208 million to $164 million, and the average reinsurance cost allocated to a single home insurance policy fell 22%, from $476 to $373.
The ACCC linked these declines to the cyclone reinsurance pool, softer global reinsurance conditions and insurers retaining more risk themselves. Insurer documents reviewed by the ACCC showed that loss-free property catastrophe reinsurance programmes in Australia and New Zealand generally received risk-adjusted rate reductions of 5% to 10% in 2025, alongside improved reinsurance capacity, although insurer retention levels remained high.
The average total cost carried by an insurer for each northern Australia policy fell 5% in real terms, from $1,767 to $1,679. That cost consisted of:
- 71% claims, combining net claims and reinsurance
- 18% underwriting
- 6% commissions
- 5% other costs
Within the claims share, net claims costs rose 10% to $827 a policy, while the reinsurance component fell 22% to $373 and underwriting costs fell 17% to $299. This is a breakdown of the insurer’s own costs, not the retail premium paid by a household. It shows that net claims remained the largest component of insurer costs for a northern Australia policy and continued to rise as reinsurance and underwriting costs fell.
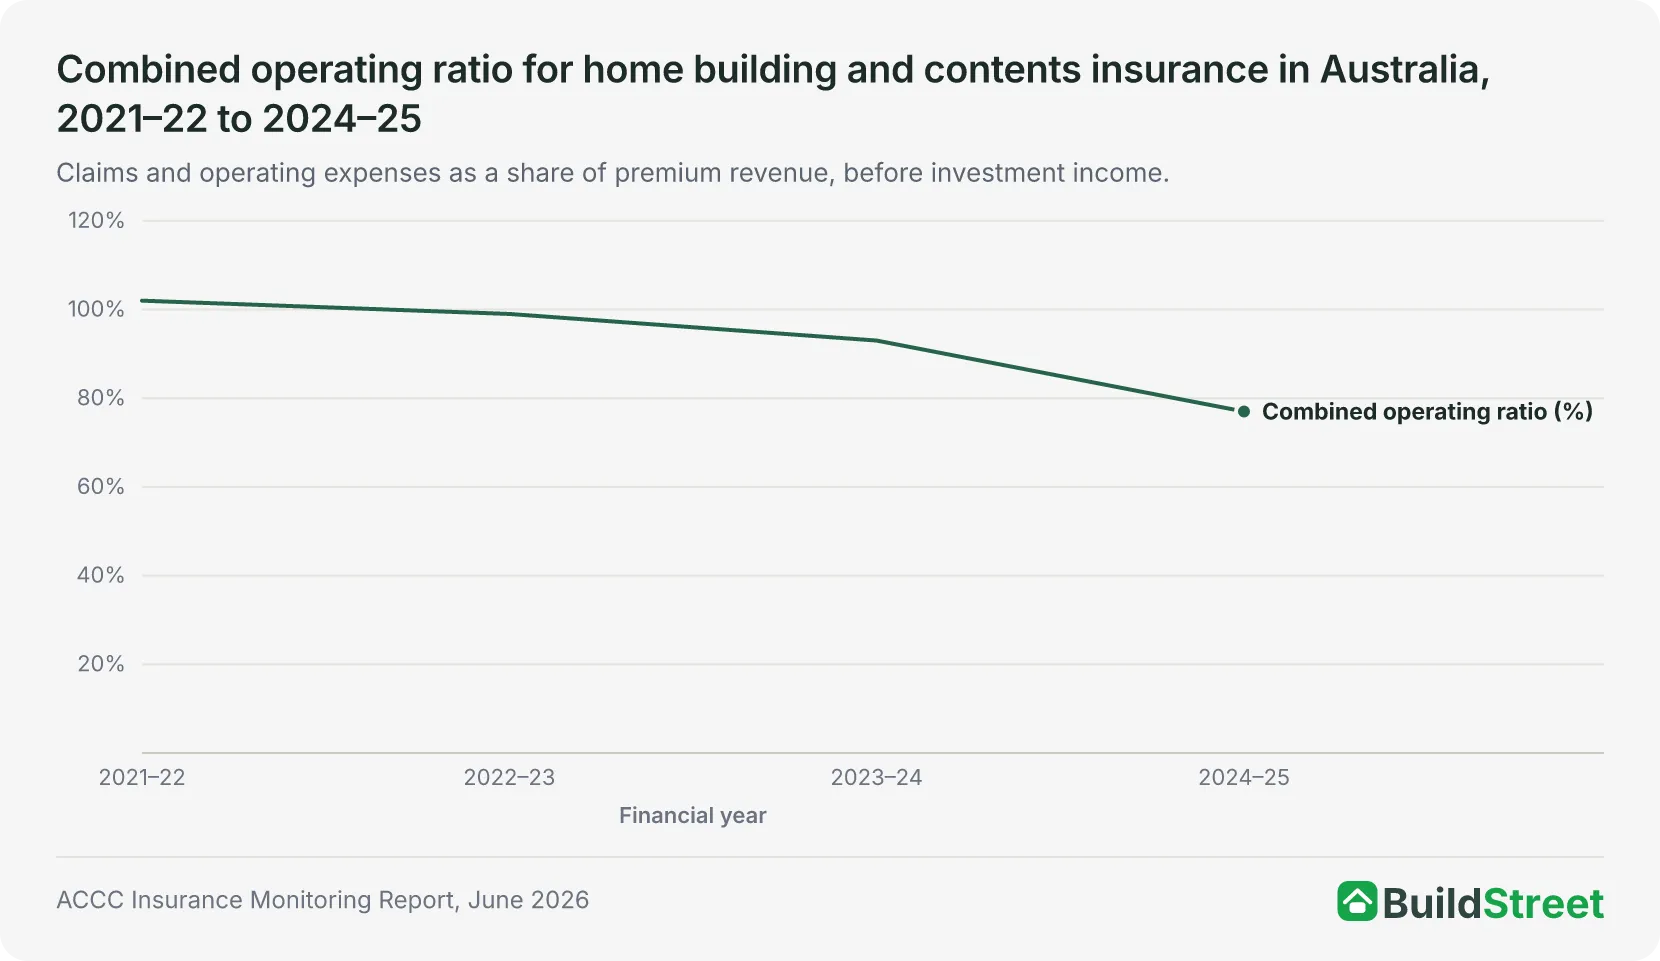
Insurer profitability improved alongside the falling ratio. Net profit before tax across the ACCC’s sample of 15 insurers reached $2.8 billion in 2024–25, up 154% on the year before. The ACCC attributed the increase to higher premiums and favourable reinsurance outcomes. Three of the 15 insurers monitored still recorded a net loss.
Section 07 · The regional picture
Where home insurance premiums are highest and rising fastest in Australia
North Western Australia recorded the highest average combined home and contents premium in 2024–25, at $4,966, more than twice the $2,310 average for the rest of Australia. The ACCC reported that the north Western Australia average rose 8% from $4,618 in 2023–24.
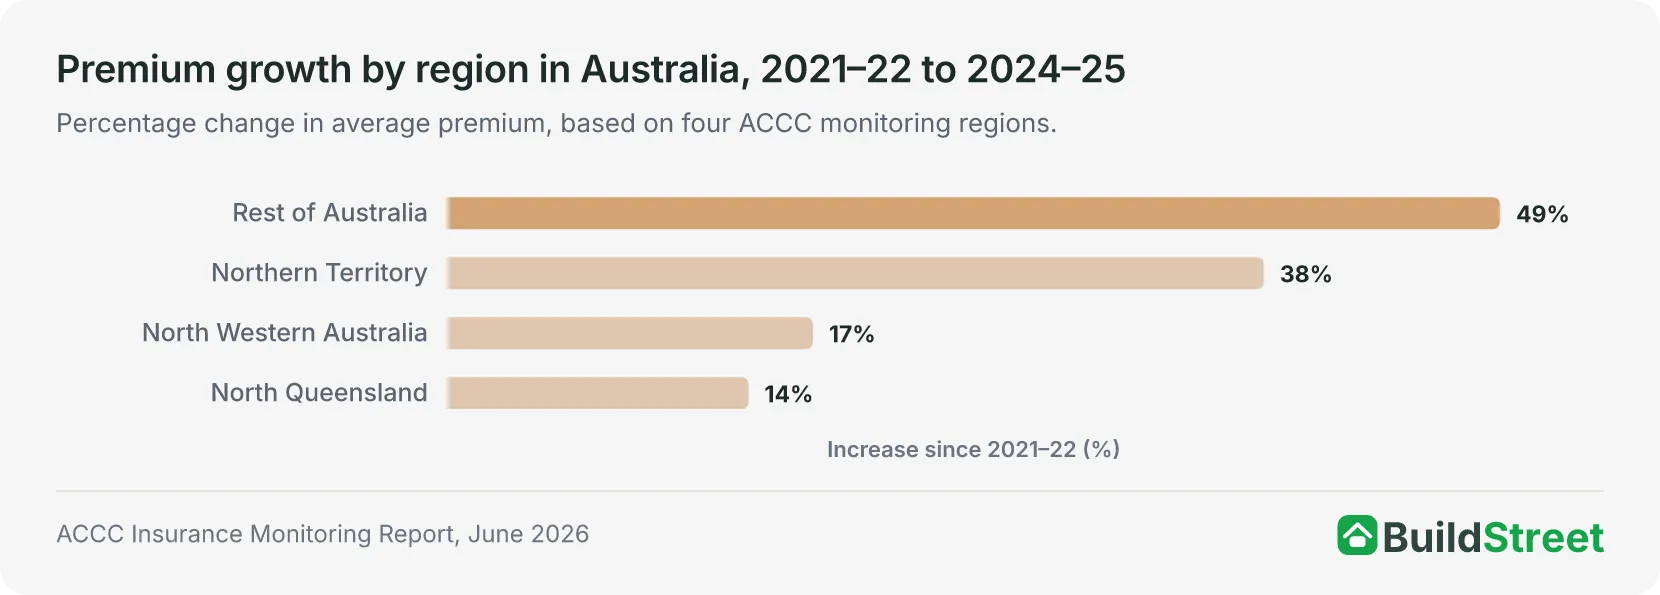
However, the region with the highest average premium did not record the fastest growth. The rest of Australia recorded the largest percentage increase among the four regions, both over the latest year, up 10%, and since 2021–22, up 49%. Over the longer period, premiums rose 38% in the Northern Territory, 17% in north Western Australia and 14% in north Queensland.
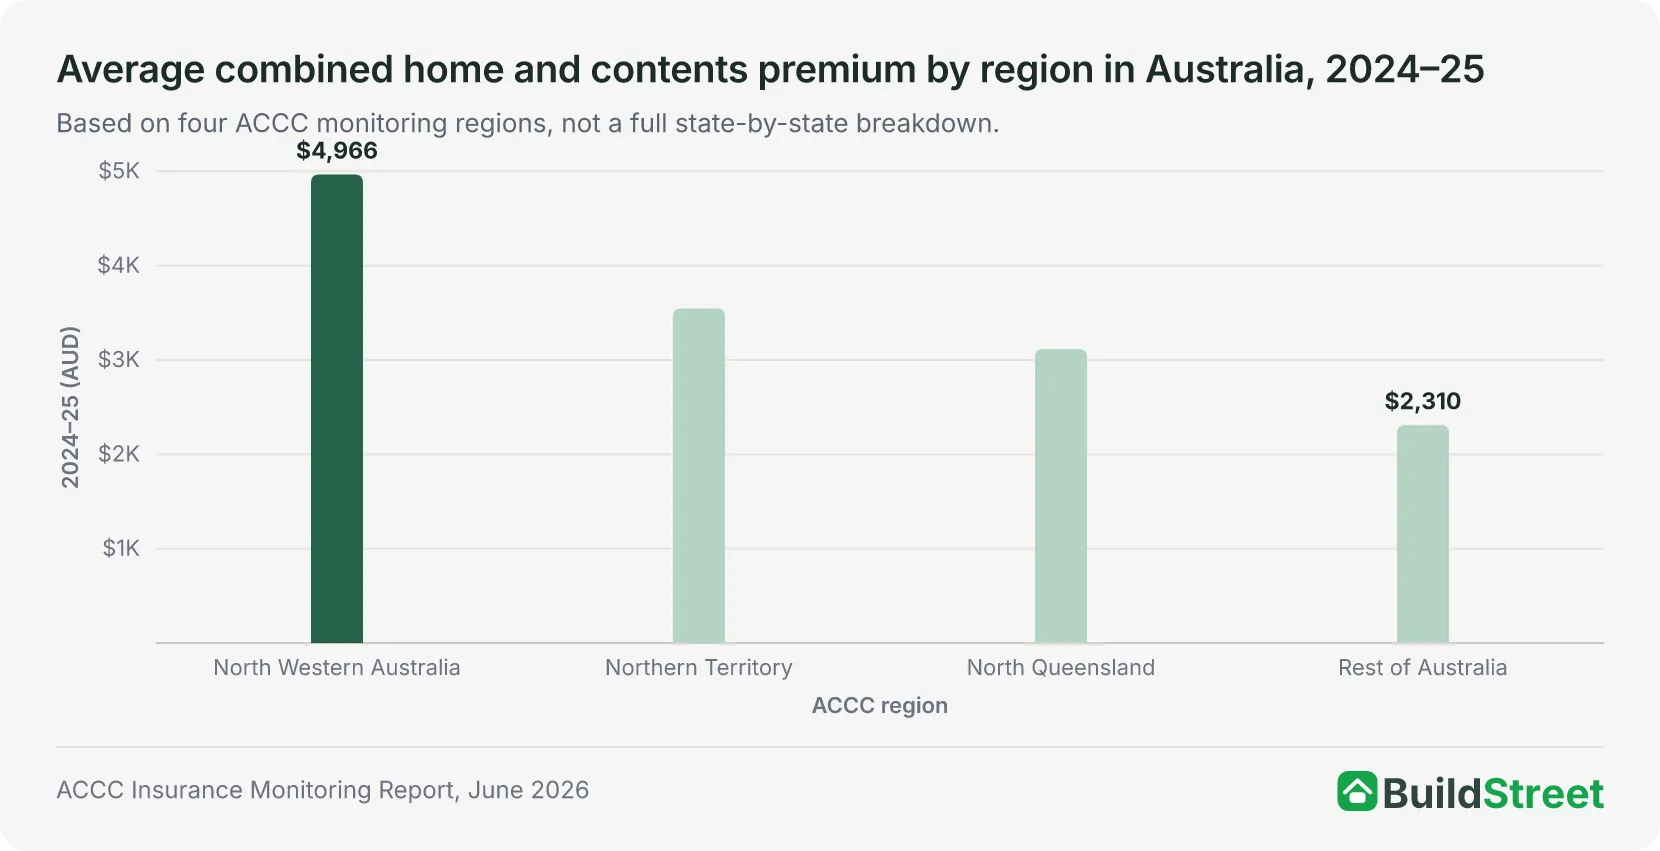
Premium growth and underlying risk pricing do not move together within these regions either. North Queensland’s premium per $100,000 insured fell 3% in 2024–25, even as its overall average premium rose 4%, suggesting that higher sums insured contributed to the overall increase rather than a rise in the price charged per $100,000 insured.
North Western Australia shows a similar pattern: its premium per $100,000 insured rose only 3%, against an 8% rise in its overall premium. In the Northern Territory and the rest of Australia, the two measures moved closer together, up 2% and 7% respectively against overall increases of 6% and 10%. This suggests that changes in the price charged per $100,000 insured played a larger role in those two regions.
The highest average premiums were concentrated in parts of north Western Australia and the Northern Territory. Six of the ten highest-premium Statistical Area Level 3 (SA3) areas in 2025 had average annual premiums of at least $5,000:
- West Pilbara
- East Pilbara
- Gascoyne
- Kimberley
- Darwin City
- East Arnhem
In medium-to-high cyclone-risk areas, average premiums per $100,000 insured fell 11% in the first year after an insurer joined the cyclone reinsurance pool and 14% in the second year.
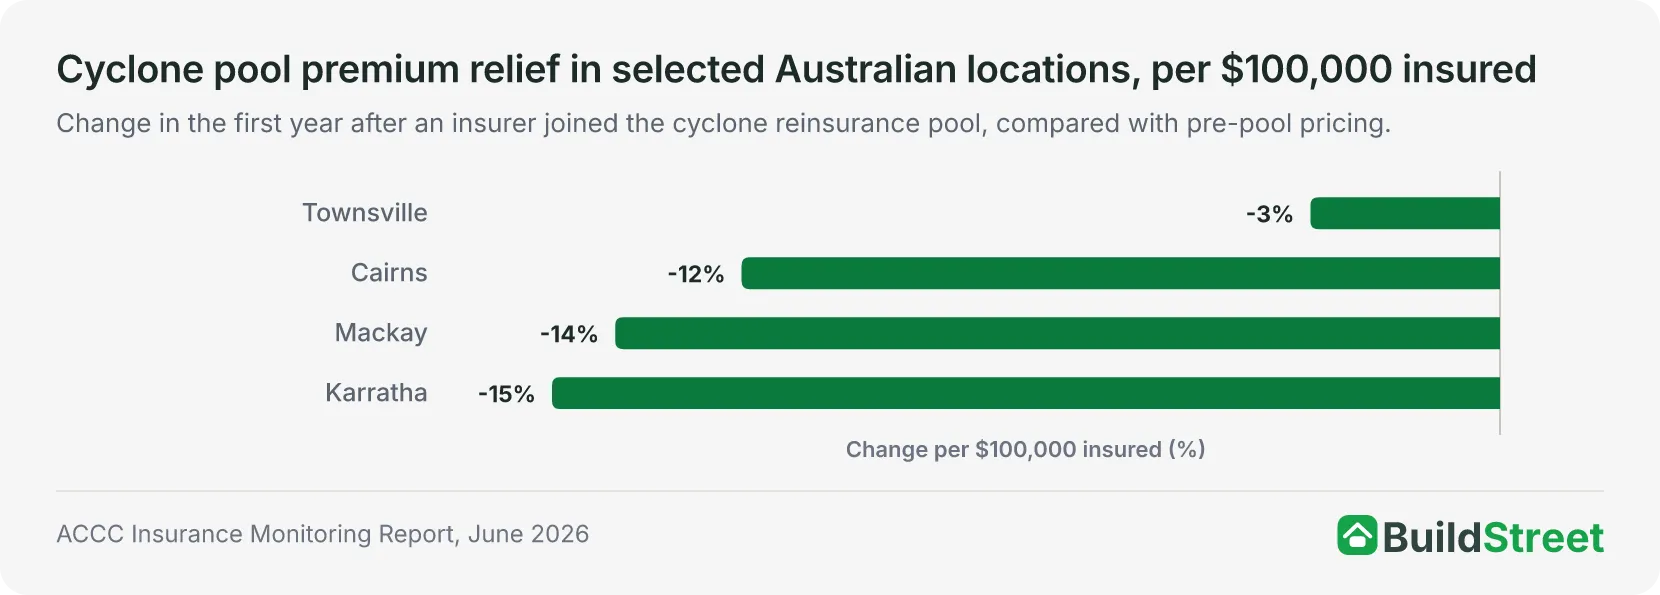
Building-only quotes in medium-to-high cyclone-risk areas were 17% to 37% lower in January 2026 than in October 2022, with quote success rates up 25% to 27% over the same span, according to a separate analysis by the Australian Reinsurance Pool Corporation. This analysis used standardised online quotes rather than actual policy renewals.
The two findings are not directly comparable. The ACCC analyses insurer-supplied premiums for new and renewing policies before and after insurers entered the pool, using a shorter post-entry window.
Section 08 · Affordability
Home insurance affordability and household budget pressure
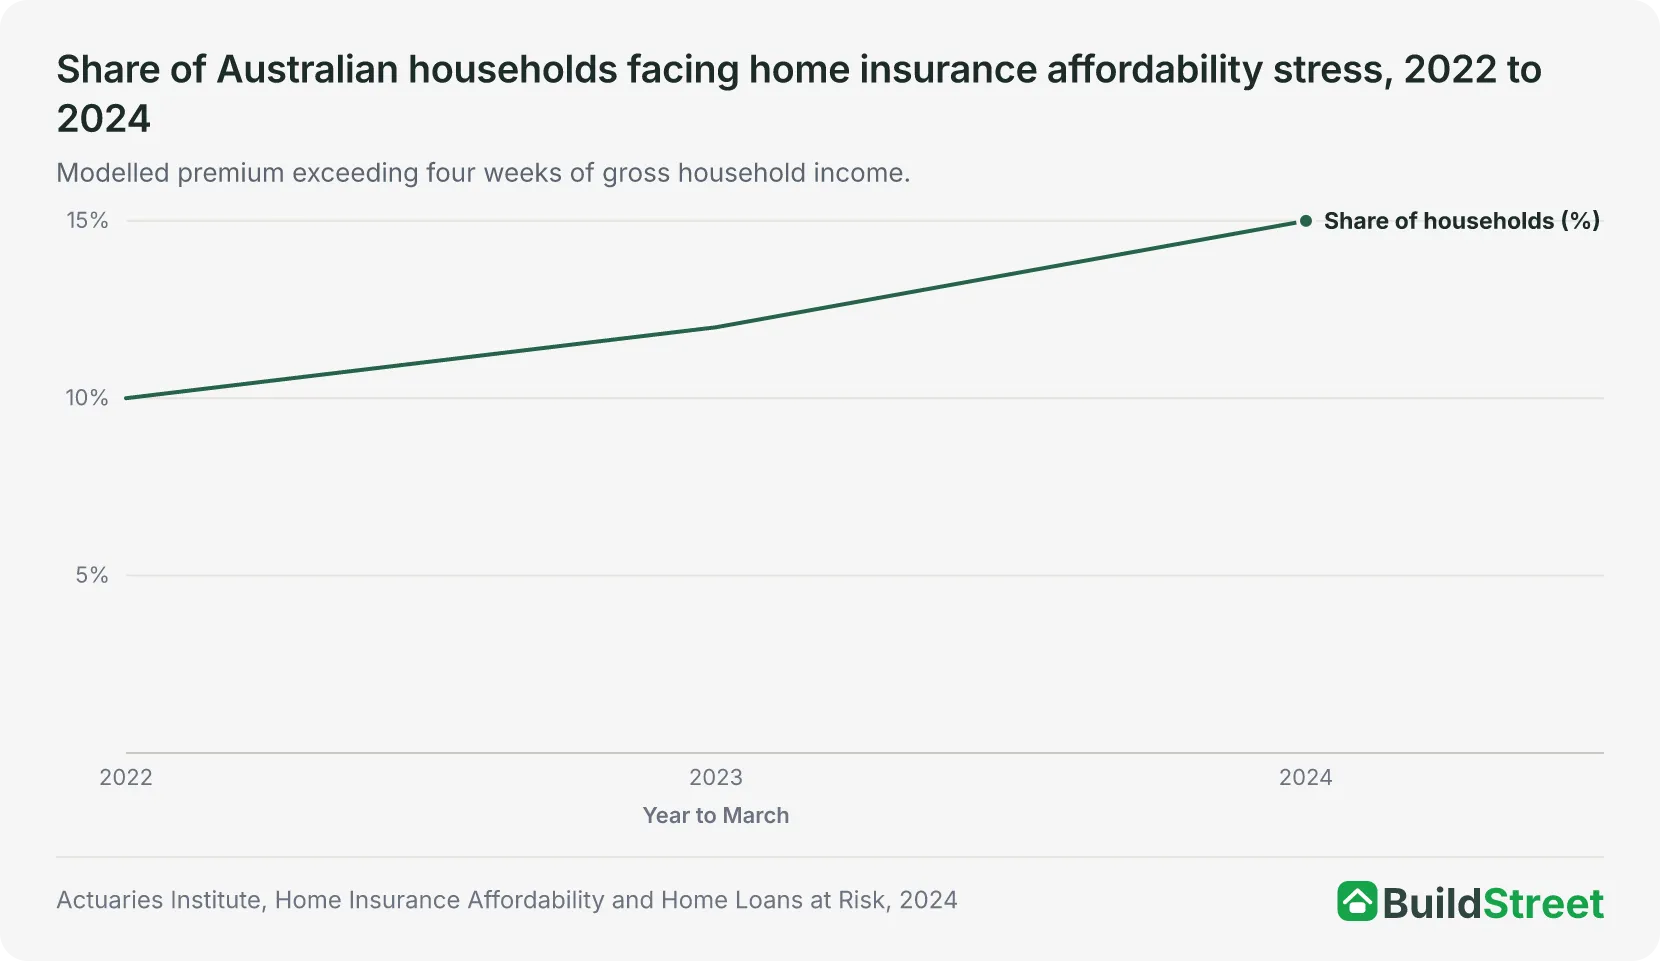
About 15% of Australian households, or 1.61 million households, were estimated to have faced home insurance affordability stress in the year to March 2024, up from 10% in 2022 and 12% in 2023. An affordability-stressed household is defined as one facing a modelled premium costing more than four weeks of gross household income.
Insurance costs for affordability-stressed households
For affordability-stressed households, modelled premiums were equivalent to an average of 9.6 weeks of gross income, compared with 1.4 weeks for households outside the stressed group.
Home insurance affordability stress among households with home loans
Among Australian households with home loans, about 5% faced affordability stress. These households held $57 billion in outstanding loans, equivalent to 3% of all home loan assets.
What Australian homeowners said about insurance affordability
An ACCC survey of 1,039 homeowners conducted during January and February 2026 found:
- Nationally, 45% rated their home insurance as unaffordable (6%) or barely affordable (39%).
- The combined proportion was 48% in medium-to-high cyclone-risk areas, compared with 44% in nil-to-low-risk areas.
- In Western Australia, 21% of respondents in medium-to-high cyclone-risk areas rated their policy as unaffordable, compared with 2% in nil-to-low-risk areas.
- Among the 932 respondents asked about their most recent renewal, 80% said their premium had increased.
The ACCC survey measures reported affordability rather than income-based financial stress. Its findings are therefore not directly comparable with the Actuaries Institute’s modelled figures above.
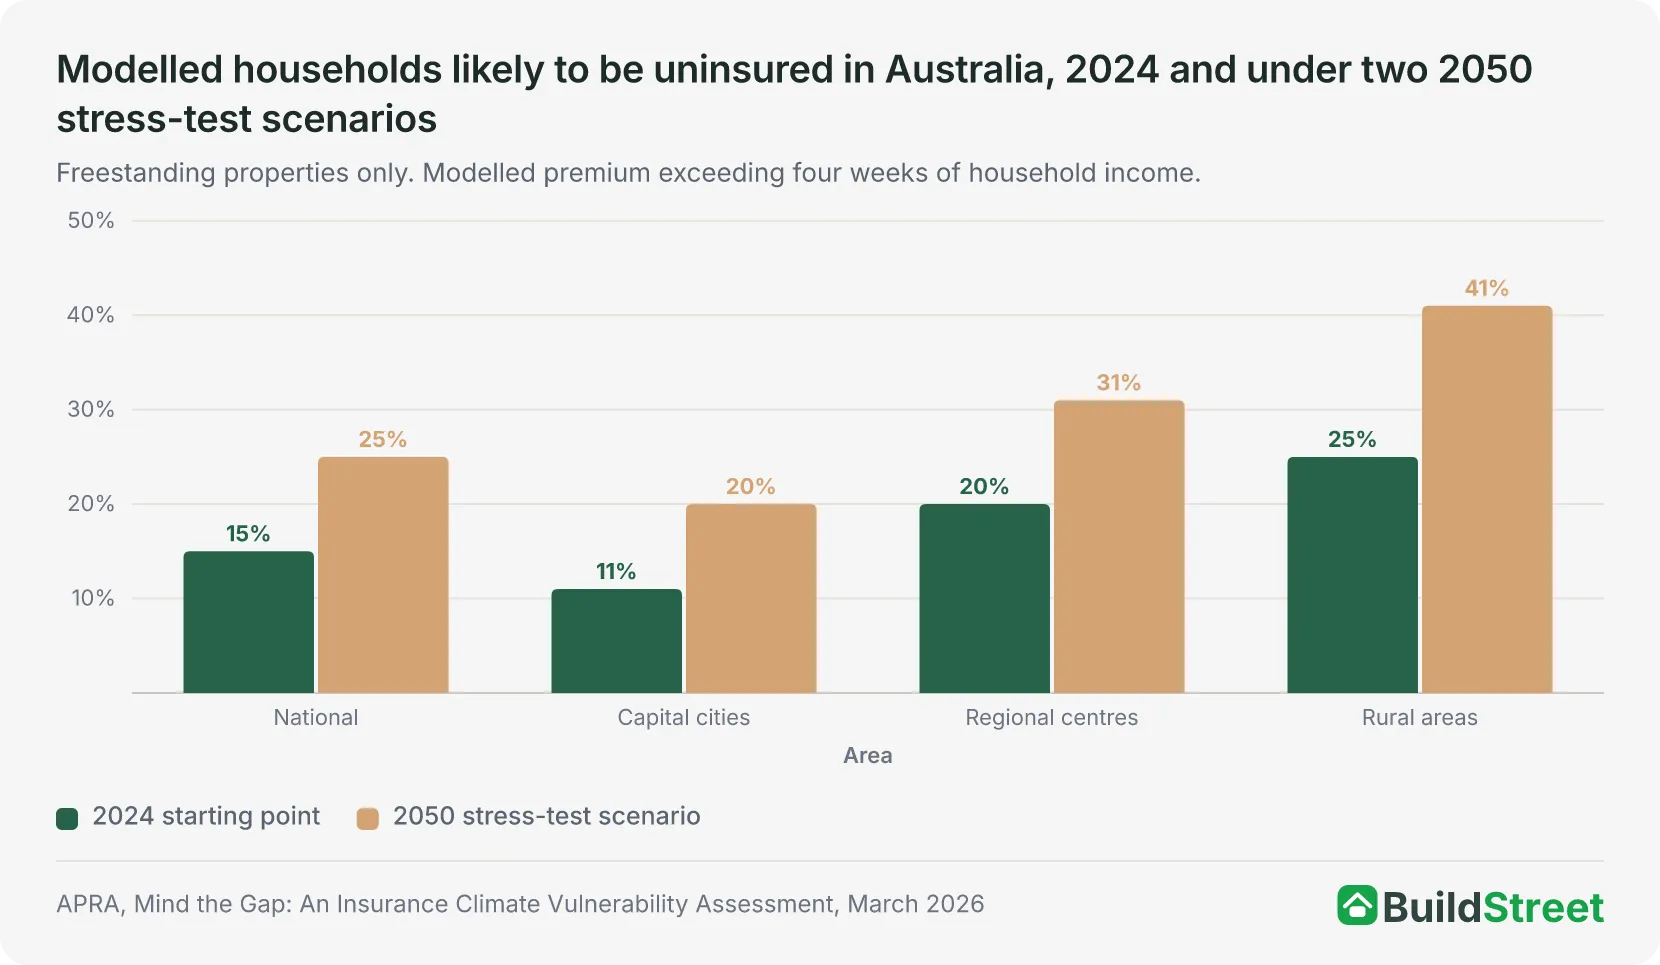
About one in seven households living in existing freestanding properties could be uninsured in 2024. Under both 2050 stress-test scenarios, the proportion could rise to around one in four.
New South Wales and Queensland account for around 60% of uninsured homes nationally, both in APRA’s current modelling and under its two 2050 scenarios. Of the 20 SA3 regions with the widest protection gaps in the current modelling, 90% are in these two states.
APRA said unaffordable insurance could reduce the number of mortgage borrowers able to meet lenders’ insurance requirements and increase credit risks for banks. Separately, no official source currently measures the share of insured Australian households whose sum insured is too low to cover the full cost of rebuilding. APRA did not directly model this form of underinsurance because of its complexity.
Overall, the data shows that home insurance premiums have risen across Australia since 2020, but no official source provides a percentage-point breakdown of how much each factor contributed. Rebuilding costs, natural disasters and reinsurance markets have influenced premiums at different points during the period.
The latest ACCC data shows that reinsurance costs fell and the combined operating ratio improved in 2024–25, while average premiums continued to rise. Affordability pressures remained concentrated in regional and rural Australia and in areas with higher cyclone and flood risk.
References
- ACCC, Insurance Monitoring Report, June 2026 · accc.gov.au
- ABS – Consumer Price Index, Australia, May 2026 · Australian Bureau of Statistics
- ABS, Wage Price Index, Australia, March 2026 · Australian Bureau of Statistics
- ABS, Producer Price Indexes, Australia, March 2026 · Australian Bureau of Statistics
- APRA, Quarterly General Insurance Performance Statistics, March 2026 edition · apra.gov.au
- APRA, Mind the Gap: An Insurance Climate Vulnerability Assessment, March 2026 · apra.gov.au
- ICA, Comprehensive Review of Insurers' Response to the 2022 Flood, October 2023 · insurancecouncil.com.au
- Insurance Council of Australia, Hail Events Push Extreme Weather Costs to $4.8 Billion in 2025, April 2026 · insurancecouncil.com.au
- ICA, Insurance Catastrophe Declared for Tropical Cyclone Alfred, March 2025 · insurancecouncil.com.au
- Actuaries Institute, Home Insurance Affordability and Home Loans at Risk, August 2024 · actuaries.asn.au
- ARPC, Cyclone Reinsurance Pool Premium Assessment, May 2026 · arpc.gov.au
- NEMA, The Rating Scheme Helping Households Stay Safe and Save Money, July 2026 · nema.gov.au
- ASIC Moneysmart, Choosing Home Insurance, accessed July 2026 · moneysmart.gov.au
