

Published 23 June 2026 · Updated 18 Sept 2026
Detached houses still make up most of Australia's homes, but their share has slipped over two decades. In 2021, 72.3% of occupied private dwellings were separate houses, down from 75.3% in 2001.
The fastest-growing dwelling structure category was semi-detached homes and townhouses, which includes duplexes, up from 8.9% to 12.6%. New approvals point to a similar shift away from standalone houses: across 2025, about 42% of private dwelling approvals were for dwellings other than standalone houses.
Modular and prefab homes reflect a separate change in construction methods rather than in dwelling structures. They are generally counted as standalone houses in official dwelling data, so they are not included in the 42% non-house approvals share.
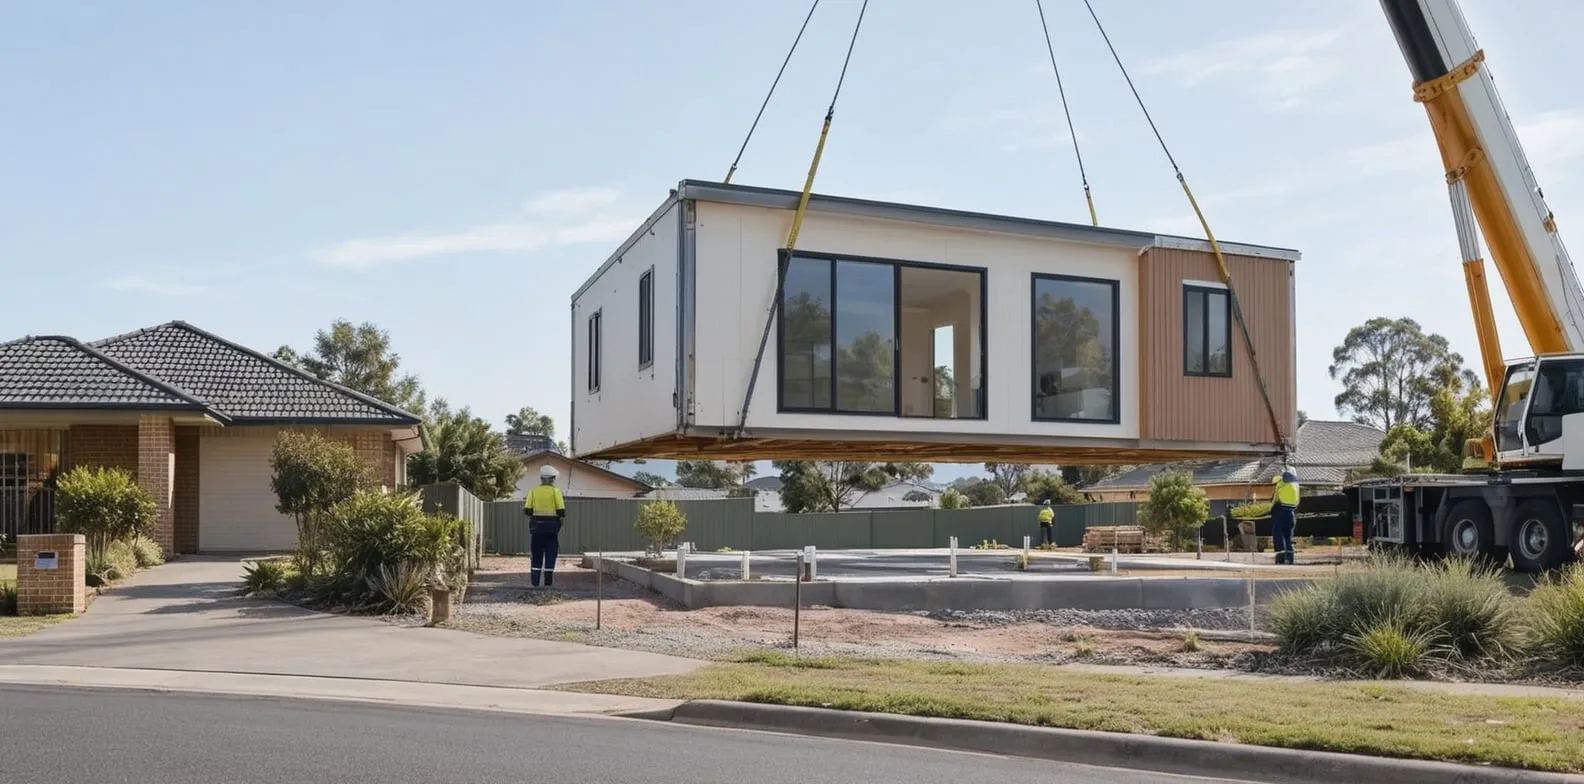 Australian modular housing statistics 2026: build times, costs and government programmesSix Australian state governments have announced, funded or delivered modular, prefabricated or other off-site construction housing programmes to deliver social, regional and key-worker housing faster.…
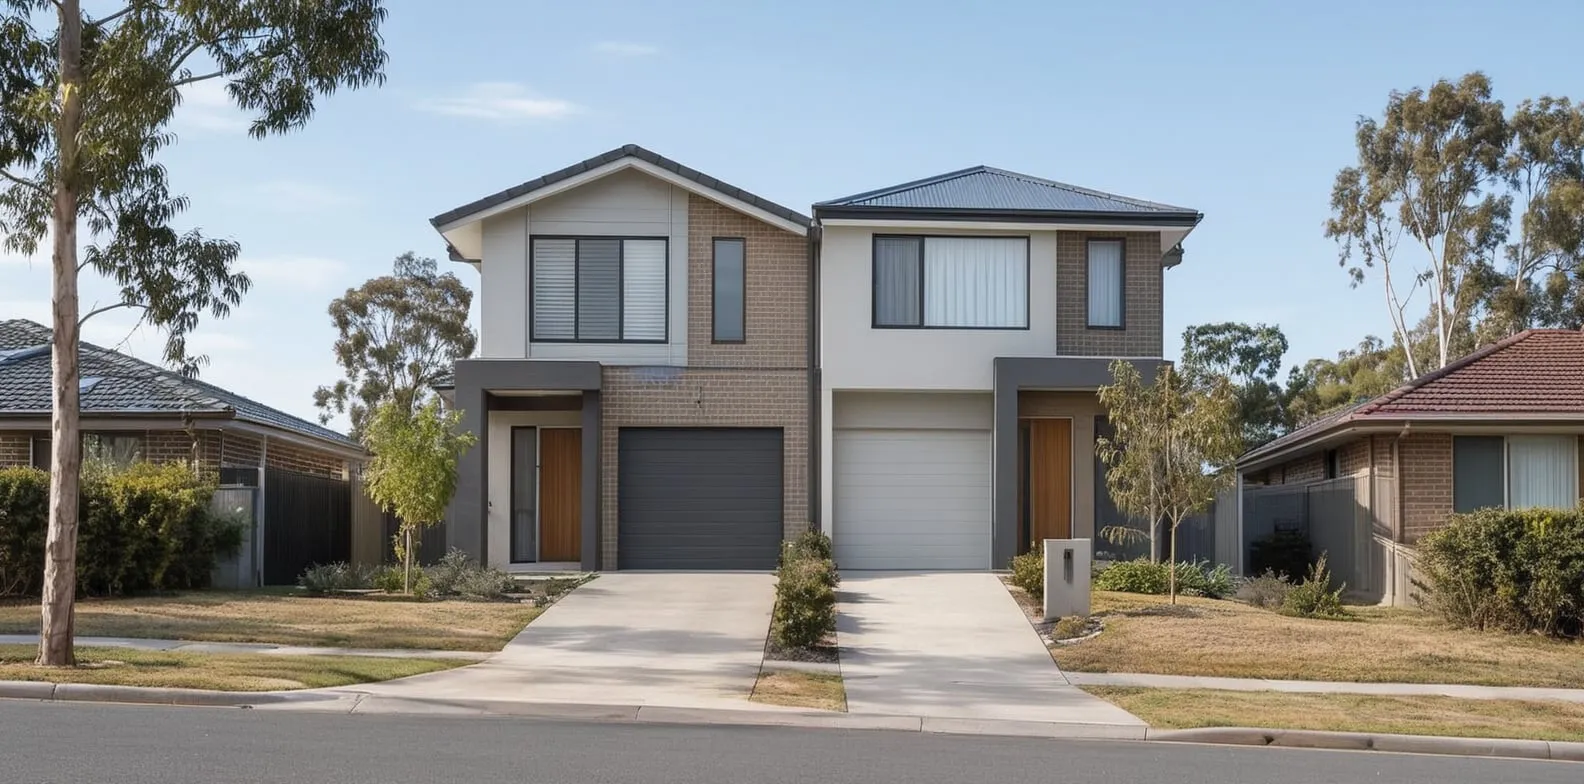 Duplex and semi-detached housing statistics Australia 2025: approvals, building values and state trendsAustralia approved 34,488 semi-detached dwellings, townhouses and duplexes in 2025, the highest annual total since 2017 and up 20.8% from the year before. These dwellings made up 17.6% of all new resi…
Section 01 · Definitions
What are modular homes, prefab homes, duplexes and granny flats?
Homes other than separate houses made up 27.7% of occupied private dwellings in 2021, up from 24.7% two decades earlier. That shift includes several dwelling types, but official data does not measure each one in the same way.
The types covered here are modular and prefab houses, transportable homes, duplexes and granny flats. They share one trait: they are often counted inside broader dwelling categories rather than as standalone categories.
- Modular, prefab and transportable houses are counted as separate houses, because dwelling structure is classified by form, not construction method.
- Duplexes sit inside the semi-detached and townhouse group, the fastest-growing category.
- Granny flats gained their own class only in 2021, so there is no long-run national count.
| Home type | What it is | How the data counts it |
|---|---|---|
| Modular/prefabricated (kit home) | A separate house built mainly from components manufactured off-site, then assembled on the block. | Classified as a "kit house", a sub-type of separate houses. Not counted apart from other detached houses. |
| Transportable/relocatable home | A house designed to be readily moved, including long-term caravans fixed on a site. | Sits within the broad houses category. No separate published series. |
| Duplex (semi-detached) | Two attached dwellings that share a wall on one lot. Dual occupancies, terraces and townhouses sit in the same family. | Recorded under "semi-detached, row or terrace houses and townhouses". Not separated from townhouses. |
| Granny flat (detached secondary dwelling) | A self-contained dwelling on the same lot as the main house. | Given its own class in the 2021 building classification. Earlier data counted these as separate houses. |
Duplexes and granny flats are classified by dwelling form and site arrangement, not how they are built. A duplex is counted within the semi-detached and townhouse group. Granny flats gained a dedicated "detached secondary dwelling" class only in January 2021.
Section 02 · The long view
How Australia's dwelling mix has changed since 2001
Separate houses fell 3.0 percentage points to 72.3% of occupied private dwellings between 2001 and 2021, while semi-detached homes and townhouses grew fastest, from 8.9% to 12.6%. Apartments increased slightly, up 1.1 percentage points to 14.2%.
The change in Australia's housing mix over the past two decades came mostly from medium-density forms, including townhouses, terraces and duplexes, rather than a large increase in apartments.
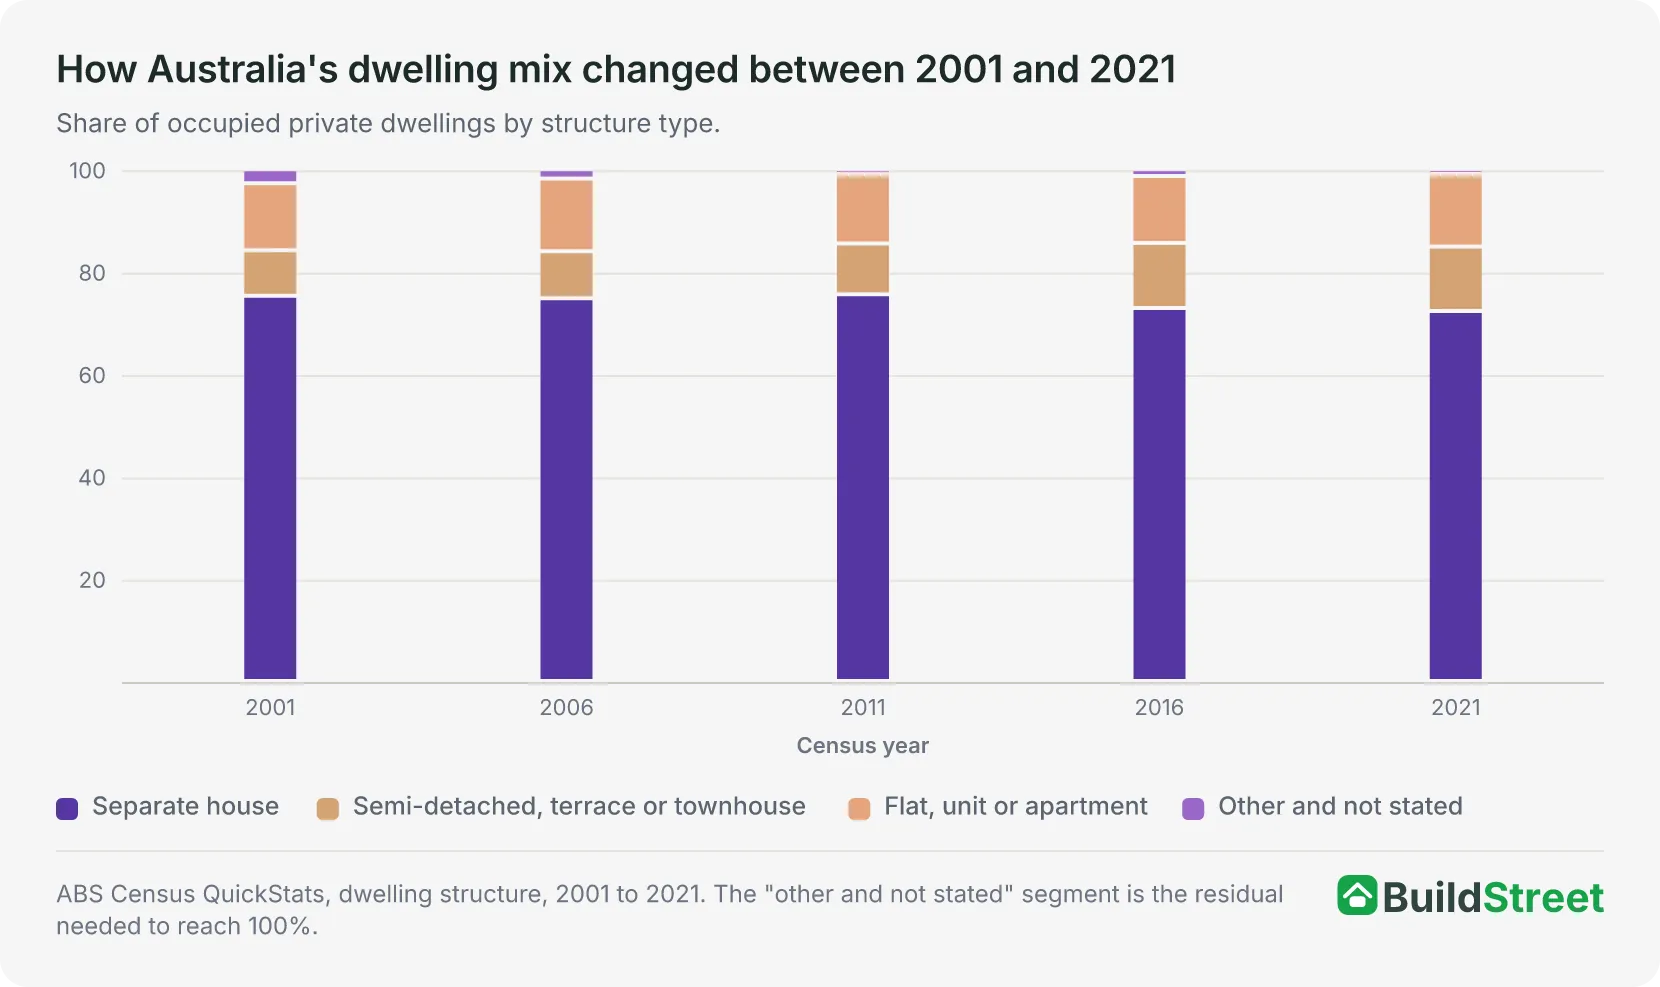
| Census year | Separate house | Semi-detached / townhouse | Flat, unit or apartment | Other and not stated |
|---|---|---|---|---|
| 2001 | 75.3% | 8.9% | 13.1% | 2.7% |
| 2006 | 74.8% | 9.2% | 14.2% | 1.8% |
| 2011 | 75.6% | 9.9% | 13.6% | 0.9% |
| 2016 | 72.9% | 12.7% | 13.1% | 1.3% |
| 2021 | 72.3% | 12.6% | 14.2% | 0.9% |
Source · Figures are for occupied private dwellings and represent a broad trend rather than a precise year-by-year series, since category groupings vary across Census years. The sharpest single fall in the detached-house share came between 2011 and 2016.
2001
- Townhouses & duplexes
8.9%
2021
- Townhouses & duplexes
12.6% (+3.7 pts)
Semi-detached homes and townhouses recorded the largest gain of any category, rising by 3.7 percentage points. Apartments rose 1.1 points; the detached-house share fell 3.0 points.
What types of homes are being approved in Australia in 2026?
Houses account for about 60% of new approvals so far in 2026, with apartments near 24% and semi-detached homes and townhouses at 16.7%, one of the highest shares in the series shown.
The apartment share of approvals peaked at 34.5% in 2016, then fell as detached houses rose to 65% in 2021, the year of the HomeBuilder grants. Approval counts swing with the building cycle, so single years are volatile.
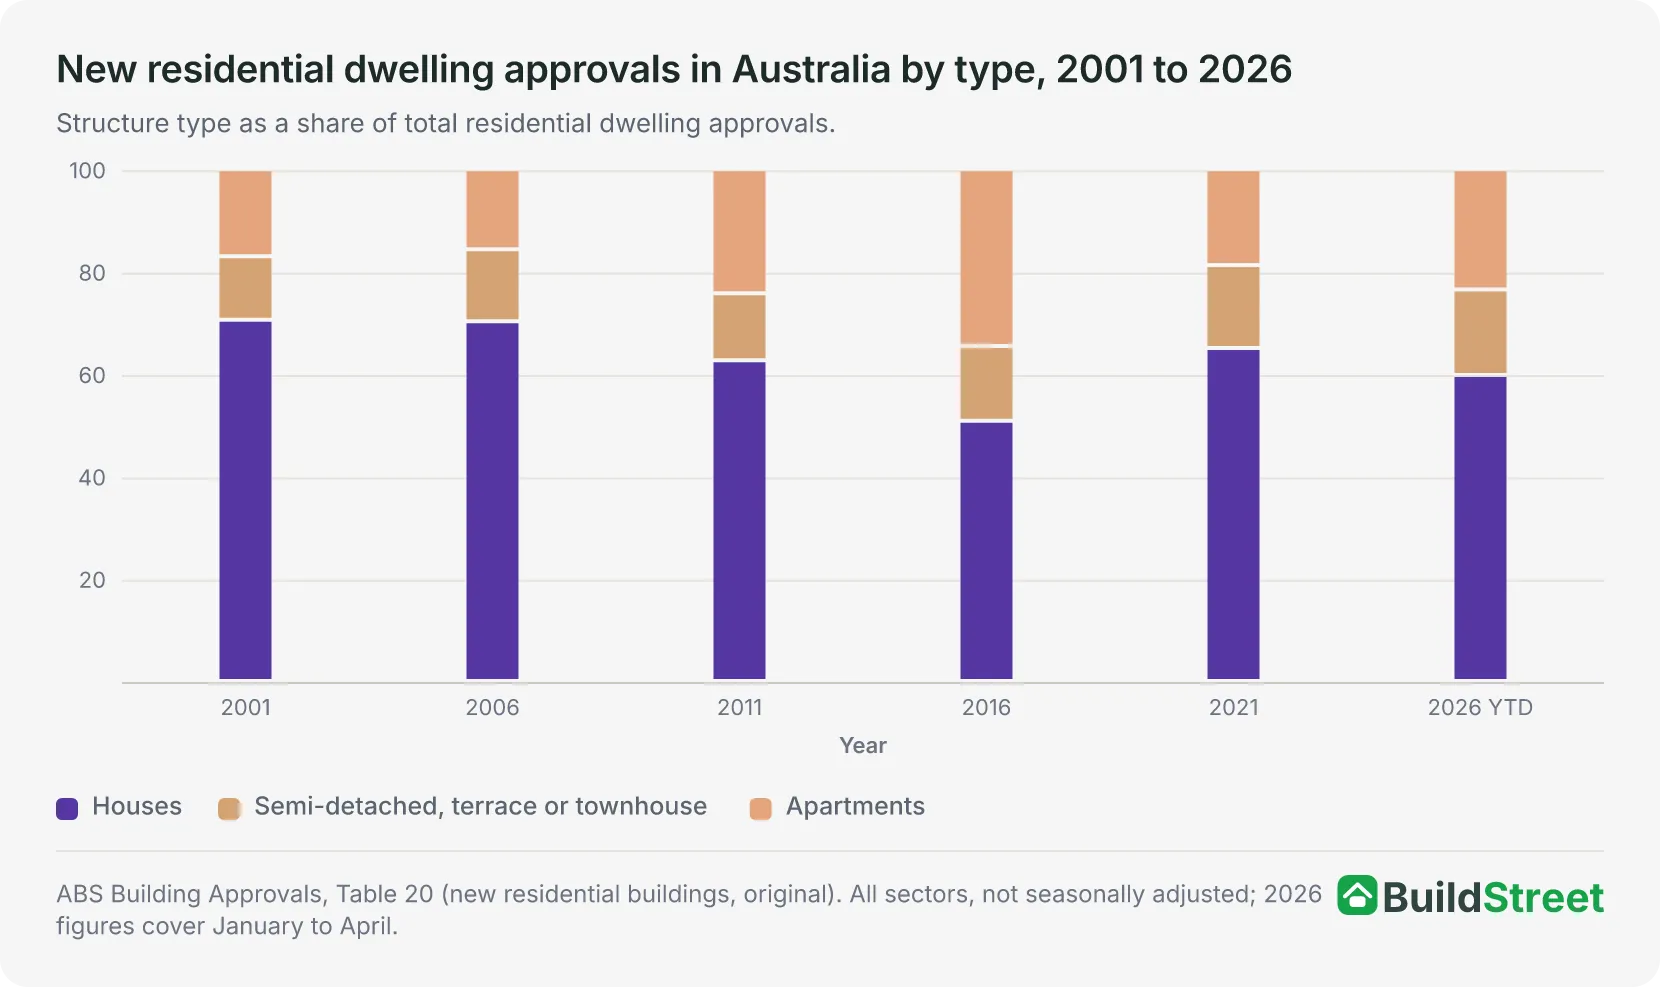
Approvals track the flow of new permits, not the existing dwelling stock, so they move more sharply than the Census shares and are not directly comparable with them.
Section 03 · New dwelling approvals
What share of new dwelling approvals are not standalone houses?
Census data shows how Australia's existing housing stock has changed, while approvals data shows what is being approved now. The two sources measure different things, but together they show how the mix of new dwellings can move faster than the overall housing stock.
Across 2025, about 42% of private dwelling approvals were for dwellings other than standalone houses, the highest share in the period shown. Over the year to April 2026, non-house approvals rose 20.5%, compared with 7.0% for houses.
In April 2026 alone, 10,088 private houses and 6,403 other private dwellings were approved, putting non-house types at about 39% for the month. That total includes townhouses, duplexes, apartments and smaller multi-unit projects, so its make-up shifts with the development cycle.
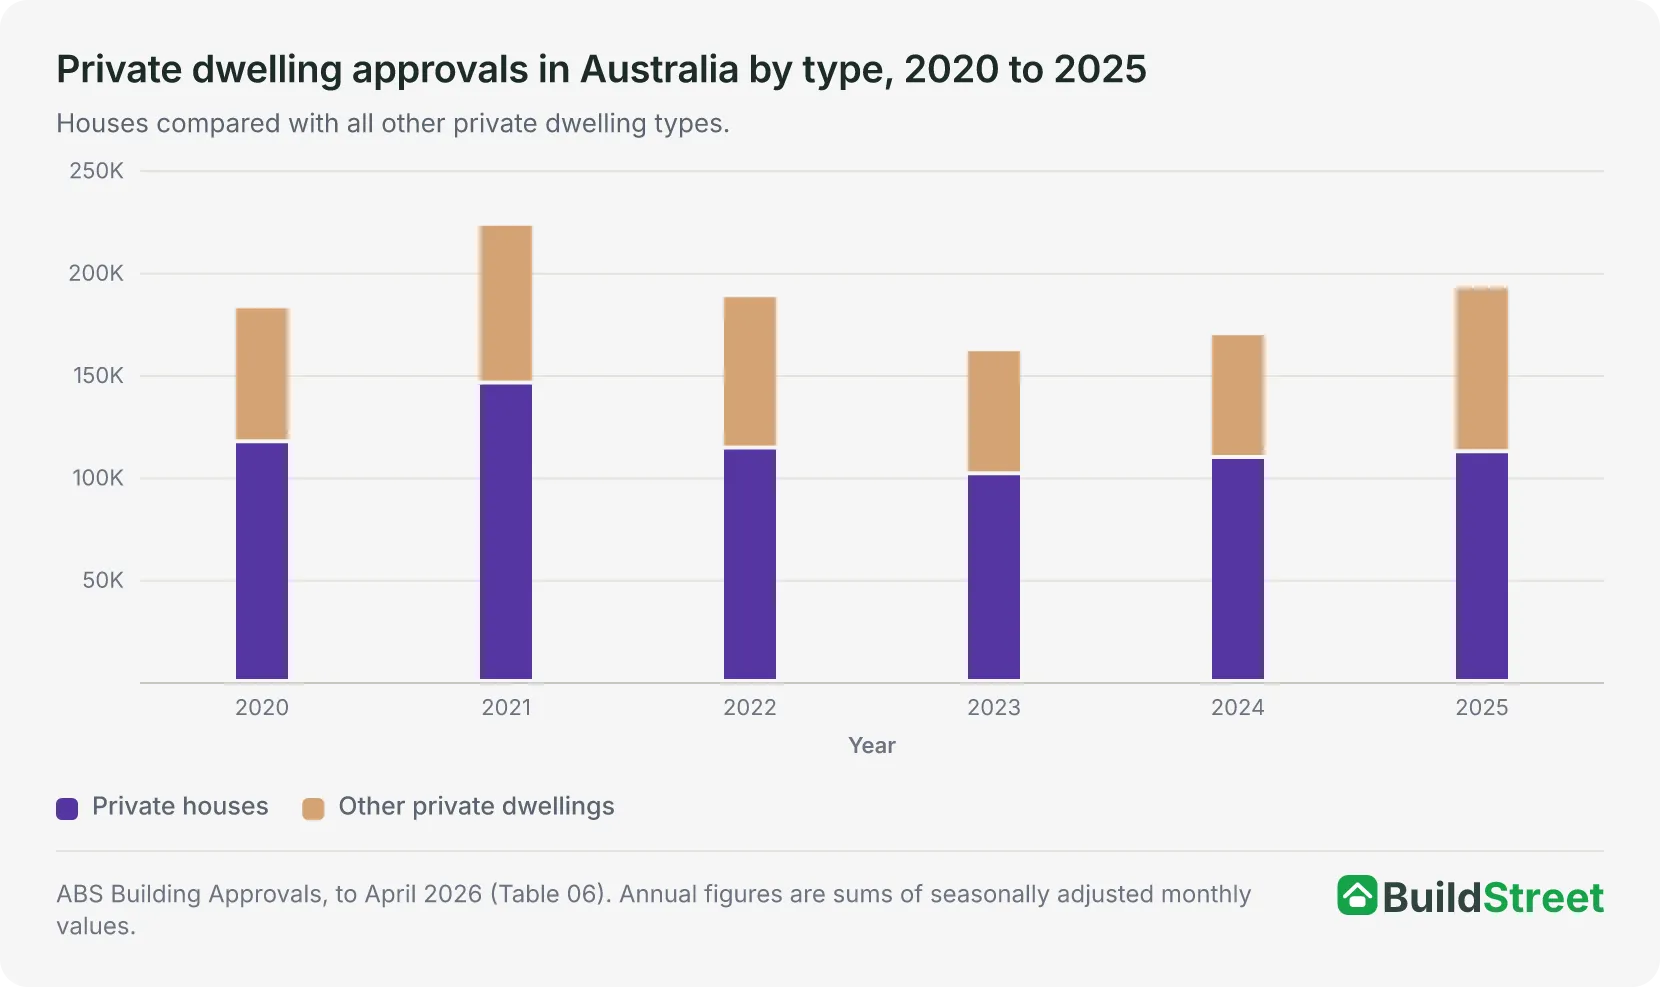
The non-house share moved between about 34% and 42% of private approvals from 2020 to 2025, rising and falling with the apartment cycle. The underlying housing stock shifts far more gradually.
Year to April 2026. Both categories grew; the gap in growth rates shifted the overall mix.
Which state approved the most new private dwellings in April 2026?
Victoria approved the most private dwellings of any state in April 2026, recording the highest house count and, with New South Wales, one of the highest non-house dwelling counts.
- Victoria led on total approvals and detached houses.
- Victoria and New South Wales approved comparable numbers of non-house dwellings.
- Western Australia and South Australia had a higher share of detached-house approvals.
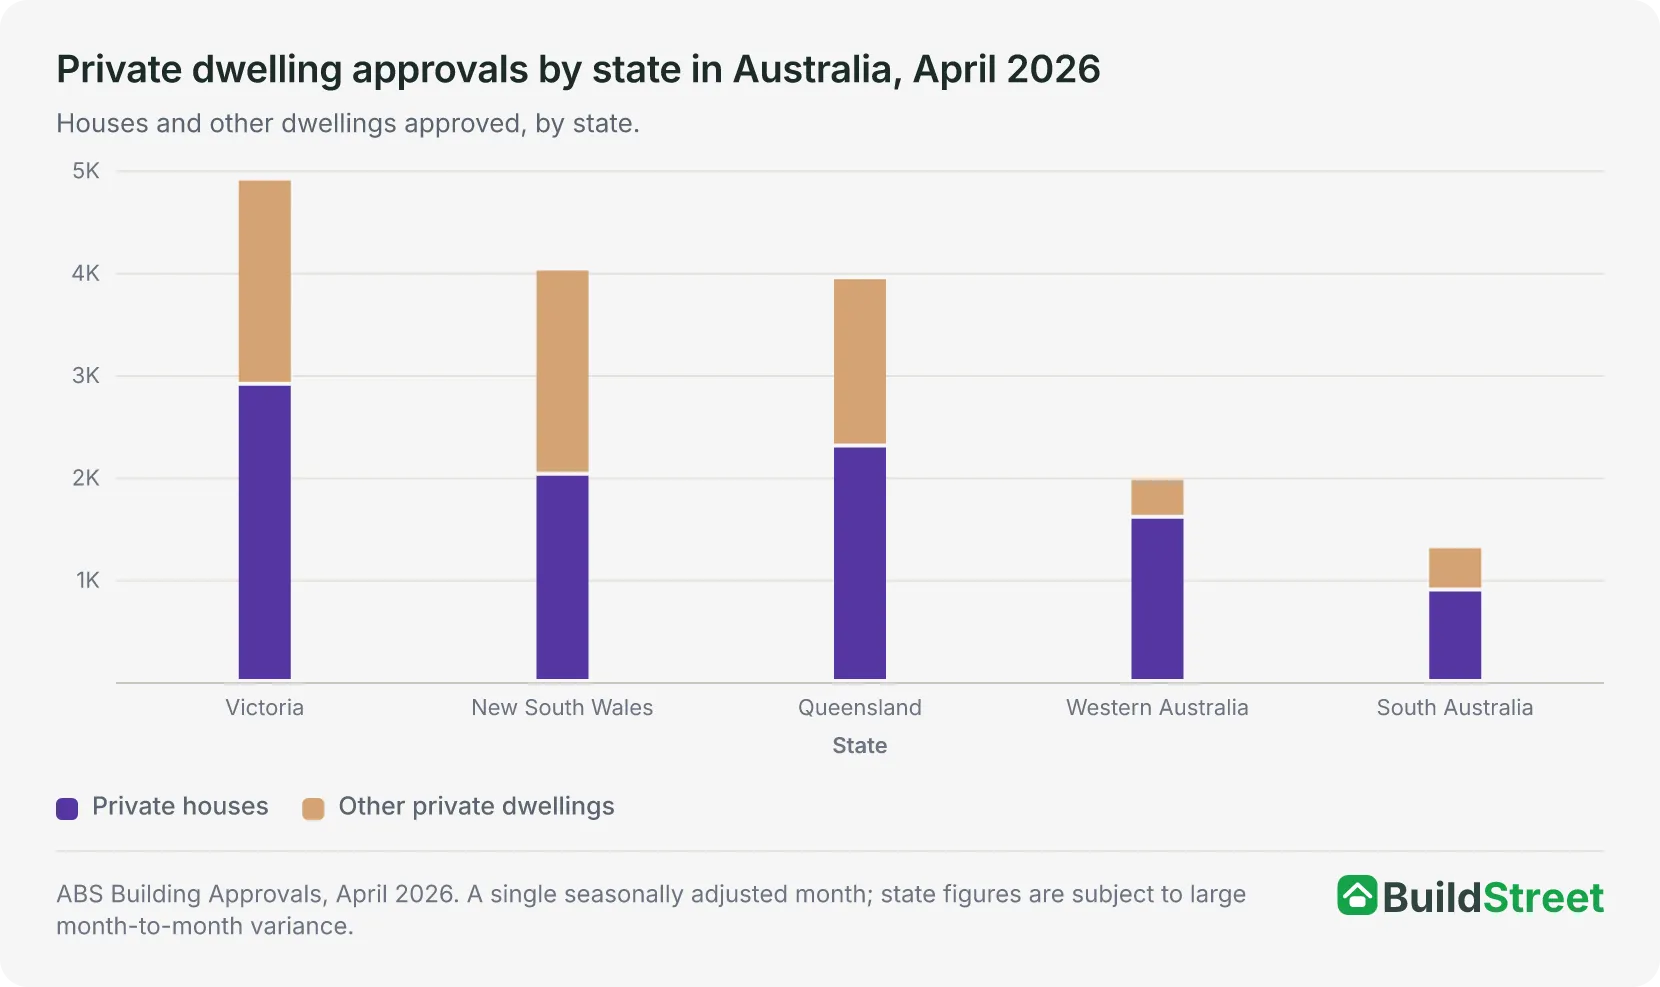
Seasonally adjusted house-level splits are not published for Tasmania, the Northern Territory or the ACT. Tasmania's seasonally adjusted total was 283 dwellings; Northern Territory and ACT totals were not published. Monthly state figures swing widely on small bases, so a single month should be read as a point-in-time comparison, not a longer-term pattern.
Why approvals are not the same as completed homes
In the December quarter 2025, 43,536 dwellings were completed nationally, with private houses making up about 60% of all completions, a higher share than in approvals for the same period.
Completions run behind approvals: an approval is permission to build, while a completion is a finished home. The longer build times of larger apartment projects can widen the gap, and the two series are released separately.
- Total dwellings completed
- 43,536
- December quarter 2025, all sectors, seasonally adjusted
- Private houses
- 26,052
- About 60% of all completions, or 62% of private-sector completions
- Other private dwellings
- 16,172
- Apartments, townhouses and attached types
Source: ABS Building Activity, December quarter 2025. Approvals and completions are separate series and are not directly comparable.
Section 04 · The measurement gap
Why modular and prefab home numbers are hard to measure
Unlike duplexes, townhouses and apartments, modular and prefab homes are mainly a construction method rather than a separate dwelling structure. That makes them harder to track in official housing data.
Prefabrication is estimated at about 5% of Australian construction output. The industry body prefabAUS separately projects that 10% of Australian homes could be prefabricated by 2030. The two figures are not directly comparable; the first estimates prefab's current share of all construction output, while the second is a forward-looking industry projection for residential housing only, so they are best read as separate indicators rather than two points on a single scale.
No official count of modular or prefab homes exists. The classification recognises these dwelling types but does not report them as a separate national series, and neither figure is an official ABS statistic.
The 5% estimate and the 2030 forecast help explain why prefab is being discussed as a possible supply channel. In 2025, the federal government separately committed funding to prefab and modular manufacturing as part of its broader housing agenda.
Section 05 · Housing demand and supply pressure
What factors are linked to changing home types in Australia?
Australia's changing home mix sits within a broader housing supply and demand picture. Population growth, land constraints and planning settings are often discussed alongside smaller, attached and faster-to-build housing types, although the data does not show one single cause.
Net overseas migration peaked at about 556,000 in the year to September 2023 before easing to 306,000 in 2024-25. Even at the lower level, net overseas migration added more than 300,000 people to Australia's population in a single year.
Attached and smaller dwellings can increase the number of homes on land within established suburbs, while modular methods may reduce on-site build time. The growth in these types lines up with recent demand pressure, although the data does not isolate any single cause. Factors commonly cited include:
- Affordability conditions
- Land supply constraints
- Planning rules
- Borrowing conditions
Section 06 · Policy and targets
How prefab and modular housing fit into Australia's housing supply target
Prefab and modular housing have been positioned by the federal government as one possible way to support faster housing delivery. The policy focus is on manufacturing capacity and building approvals processes, but official data does not yet show how many completed homes prefab methods are adding.
The federal government committed $54 million to prefab and modular manufacturing in March 2025, part of a national target of 1.2 million new homes by June 2029. The government says prefab homes can be built up to 50% faster than traditional construction.
The funding and the speed claim are commitments and government statements, rather than measured outcomes. No projection has been published for how many homes prefab methods are expected to add, and the data does not yet record prefab's contribution to delivery.
Federal · March 2025
Prefab and modular funding
$54 million committed in total
$49.3 million for state and territory programs
$4.7 million for a national certification process
Government claim
Speed of construction
Prefab and modular homes built up to 50% faster than traditional homes
The cited release does not explain the calculation behind the figure
National Housing Accord
The five-year target
1.2 million new homes
From 1 July 2024 to 30 June 2029
Prefab positioned as one delivery channel, not a separate quota
References
- ABS Building Approvals, Australia (latest release, Cat. 8731.0) · Australian Bureau of Statistics
- ABS, Building Activity, Australia (latest release, Cat. 8752.0) · Australian Bureau of Statistics
- ABS 2021 Census of Population and Housing, All persons QuickStats · Australian Bureau of Statistics
- Australian Bureau of Statistics, Functional Classification of Buildings, January 2021 · Australian Bureau of Statistics
- ABS: Overseas Migration, 2024–25 · Australian Bureau of Statistics
- $54 million to manufacture more homes more quickly · ministers.treasury.gov.au
- Current state of using prefabricated construction in Australia · mdpi.com
- Unpacking the economic challenges of prefabricated construction in Australia: a systematic review · doi.org
- Building the Future We Want: A Prefabrication Industry Roadmap 2023–2033 · prefabaus.org.au
