

Published 6 May 2026 · Updated 21 Sept 2026
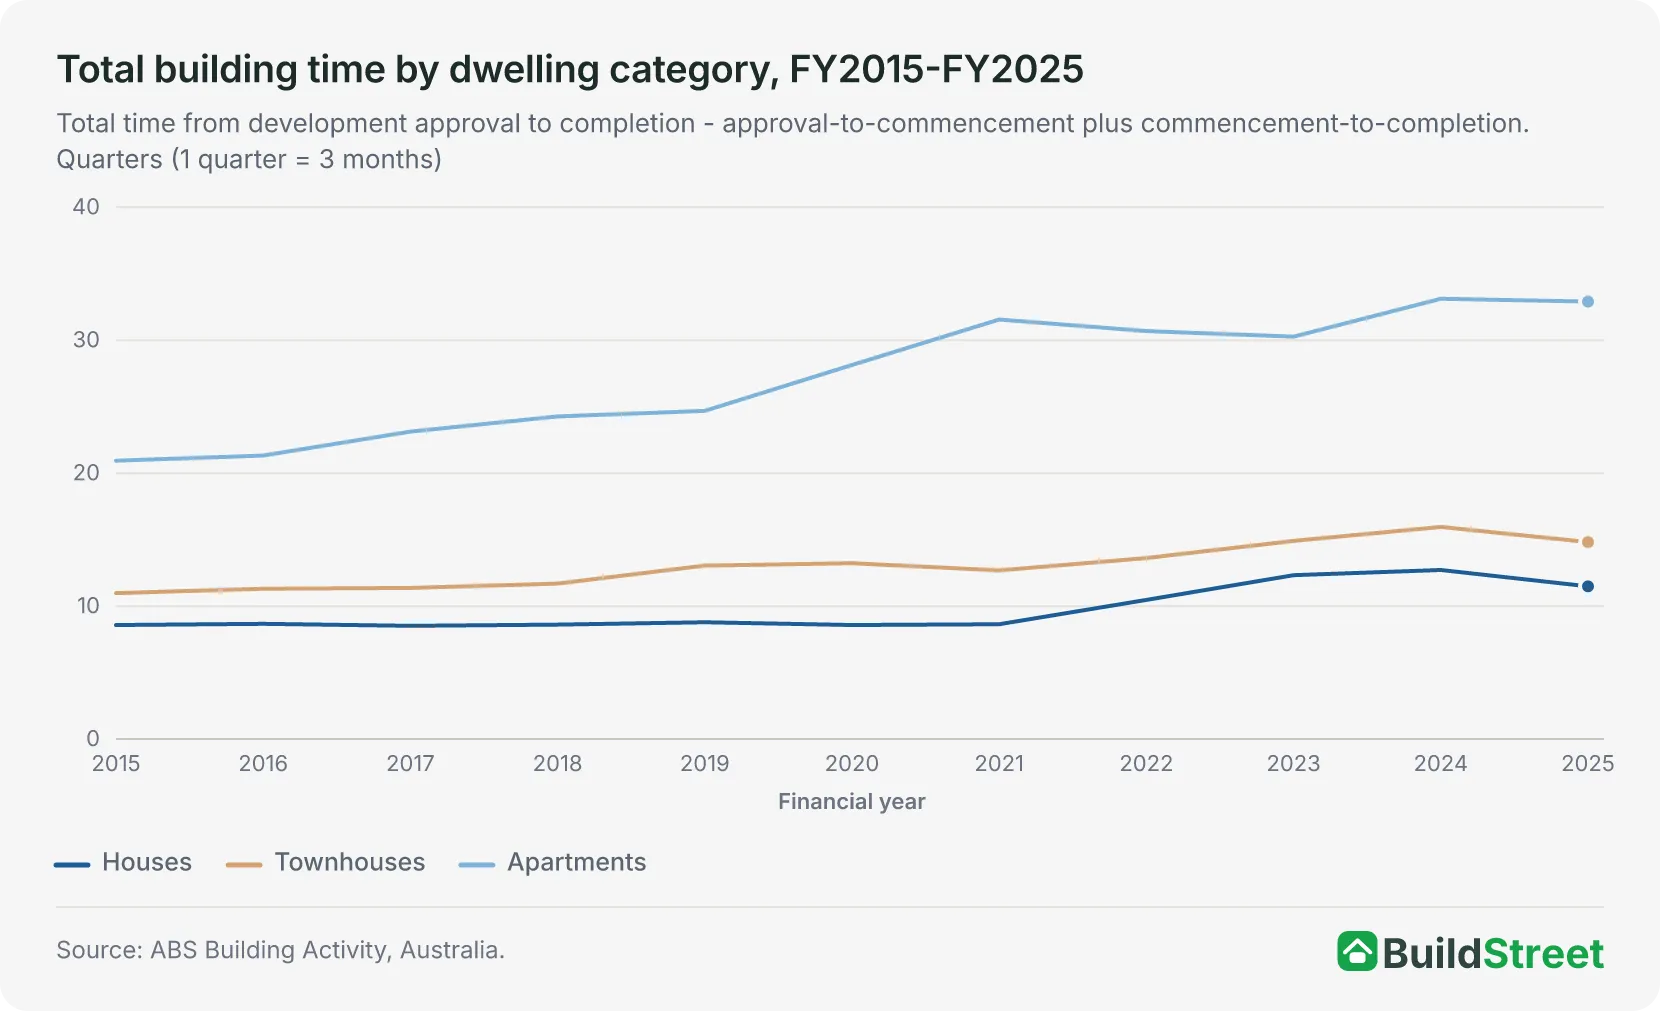
The average time from approval to handover is now about 11.5 months for a house, 14.8 months for a townhouse and almost 33 months for an apartment in Australia12. While homes still take much longer to build than they did before COVID, new data suggests conditions are starting to improve. Houses and townhouses were completed faster last year, while apartments remain the slowest part of the market by a wide margin. The past decade of data shows how sharply the system slowed, and where it is now beginning to recover.
 The states with the fastest and slowest home build times in AustraliaBuilding a new home in Australia involves two key waiting periods: approval to commencement (the time from receiving planning approval to breaking ground), and commencement to completion (the time fro…
 How many homes are built in Australia each year?Two distinct cycles have shaped Australia's housing output since 2010:
Section 01
Home build time trends in Australia (2015–2025)
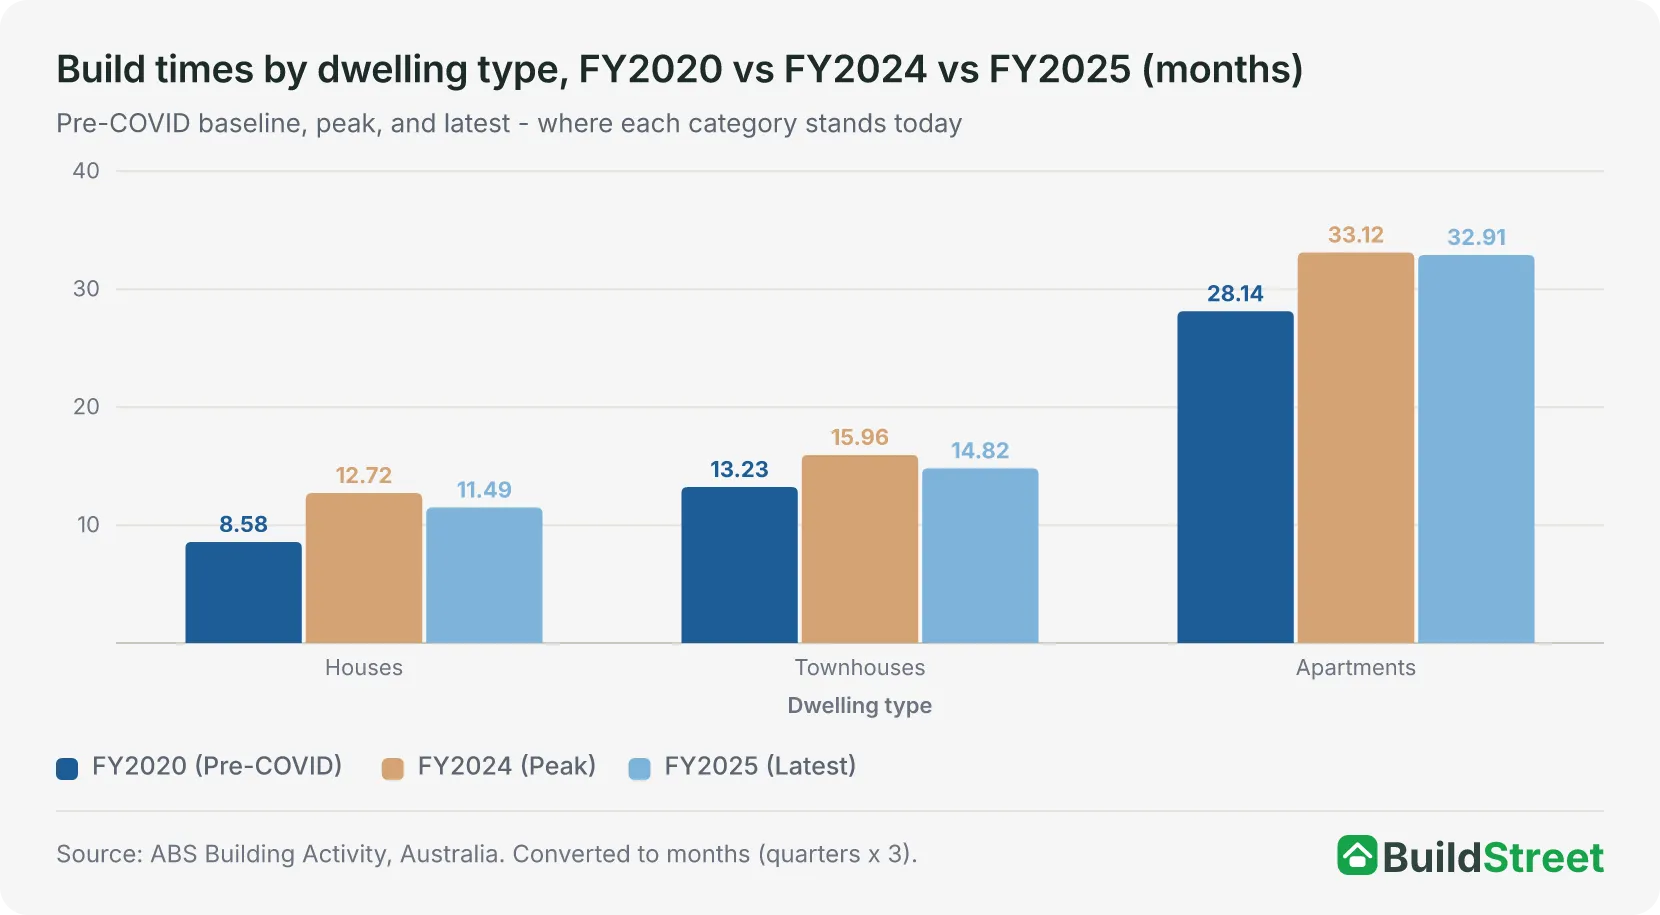
For most of the 2010s, build times in Australia were relatively steady. Then COVID disrupted the system. Government stimulus triggered a surge in new construction, but labour and materials could not keep up. By 2022, build times had blown out across houses, townhouses and apartments. In 2025, houses and townhouses are finally starting to improve. Apartments are still moving in the wrong direction.
Show full table
| Financial Year | Houses | Townhouses | Apartments |
|---|---|---|---|
| FY2015 | 2.868.6 mo | 3.6611 mo | 6.9820.9 mo |
| FY2016 | 2.898.7 mo | 3.7711.3 mo | 7.1121.3 mo |
| FY2017 | 2.848.5 mo | 3.7911.4 mo | 7.7123.1 mo |
| FY2018 | 2.878.6 mo | 3.911.7 mo | 8.0924.3 mo |
| FY2019 | 2.938.8 mo | 4.3513.1 mo | 8.2324.7 mo |
| FY2020 | 2.868.6 mo | 4.4113.2 mo | 9.3828.1 mo |
| FY2021 | 2.888.6 mo | 4.2312.7 mo | 10.5231.6 mo |
| FY2022 | 3.4910.5 mo | 4.5413.6 mo | 10.2330.7 mo |
| FY2023 | 4.1112.3 mo | 4.9714.9 mo | 10.0930.3 mo |
| FY2024 | 4.2412.7 mo | 5.3216 mo | 11.0433.1 mo |
| FY2025 | 3.8311.5 mo | 4.9414.8 mo | 10.9732.9 mo |
Source · ABS Building Activity, Australia.
What is driving the improvement?
For houses, almost all of the improvements came from the commencement-to-completion phase, which fell from 10.4 months in 2024 to 9.2 months in 20252, cutting more than five weeks off the average build. Townhouses saw a similar shift, with the same phase easing from 12.9 months to 11.7 months. Neither category saw meaningful improvement in the approval-to-commencement phase, which suggests pre-construction pipelines are stabilising but not yet accelerating.
Houses
- Approval → Start
0.76 qtrs
- Start → Finish
3.07 qtrs
- Total FY2025
3.83 qtrs · 11.5 mo
Townhouses
- Approval → Start
1.03 qtrs
- Start → Finish
3.91 qtrs
- Total FY2025
4.94 qtrs · 14.8 mo
Apartments
- Approval → Start
1.39 qtrs
- Start → Finish
9.58 qtrs
- Total FY2025
10.97 qtrs · 32.9 mo
Section 02
Which states improved the most?
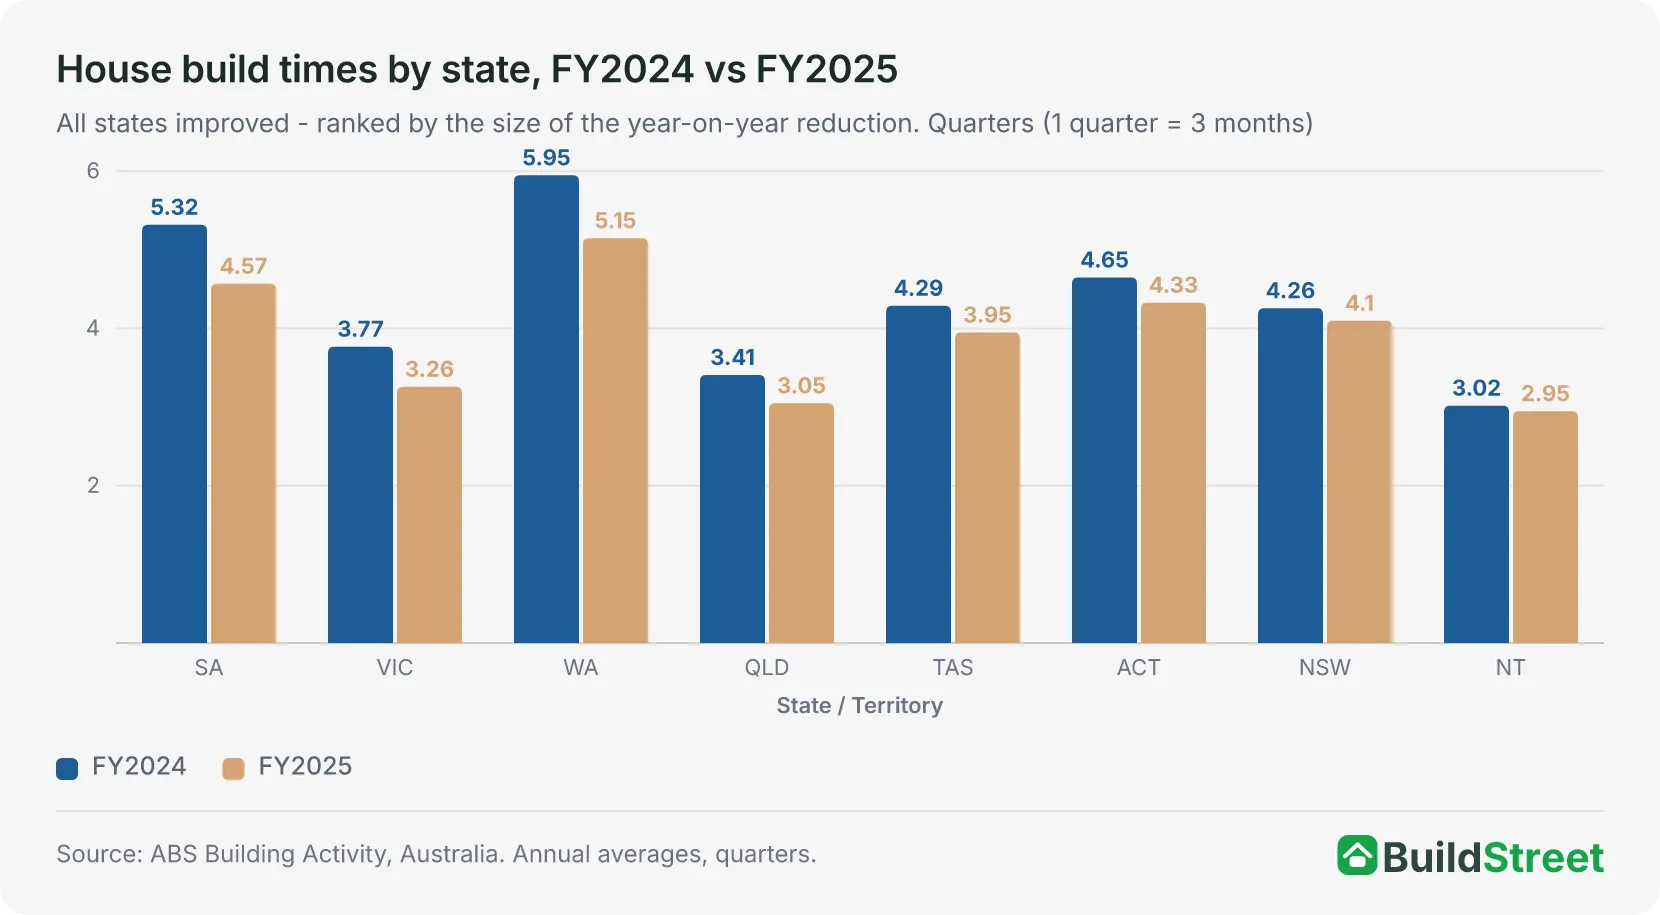
Every state and territory in Australia built houses faster in 2025 than in 2024. That has not happened in years. But the improvement was far from even, with some states making much bigger gains than others.
| State / Territory | FY2024 | FY2025 | Change |
|---|---|---|---|
| South Australia | 5.3216 mo | 4.5713.7 mo | ▼ 14.1% faster |
| Victoria | 3.7711.3 mo | 3.269.8 mo | ▼ 13.5% faster |
| Western Australia | 5.9517.9 mo | 5.1515.5 mo | ▼ 13.4% faster |
| Queensland | 3.4110.2 mo | 3.059.1 mo | ▼ 10.6% faster |
| Tasmania | 4.2912.9 mo | 3.9511.9 mo | ▼ 7.9% faster |
| ACT | 4.6514 mo | 4.3313 mo | ▼ 6.9% faster |
| New South Wales | 4.2612.8 mo | 4.112.3 mo | ▼ 3.8% faster |
| Northern Territory | 3.029.1 mo | 2.958.9 mo | ▼ 2.3% faster |
Source · ABS Building Activity, Australia. Annual averages, quarters.
South Australia, Victoria, and Western Australia recorded the sharpest single-year drops, each cutting build times by more than 13%. For WA in particular, this is a meaningful turning point. The state accumulated the worst backlog during the boom years and is now showing one of the strongest rates of improvement as its pipeline begins to clear and labour supply catches up to demand.
NSW and the NT moved the least, at 3.8% and 2.3% faster, respectively. NSW's large and complex pipeline means improvements take longer to show up in the averages, and the NT's small volume makes it more susceptible to project-by-project variation.
Section 03
Apartments remain the weakest part of the market
Houses and townhouses are getting faster, but apartments are barely moving. Build times improved by just 0.6% in 2025, effectively no change at all. Worse, the time spent actually building on site increased compared with a year earlier2. Apartment projects remain close to their slowest levels on record.
| Dwelling Type | FY2020 (Pre-COVID) | FY2024 (Peak) | FY2025 (Latest) | FY2024 to 2025 |
|---|---|---|---|---|
| Houses | 2.868.6 mo | 4.2412.7 mo | 3.8311.5 mo | ▼ 9.7% faster |
| Townhouses | 4.4113.2 mo | 5.3216 mo | 4.9414.8 mo | ▼ 7.1% faster |
| Apartments | 9.3828.1 mo | 11.0433.1 mo | 10.9732.9 mo | ▼ 0.6% (marginal) |
Source · ABS Building Activity, Australia. Converted to months (quarters × 3).
Why are apartments in a different category?
Apartments face structural constraints that detached houses do not. Large, complex multi-storey projects are more exposed to coordination risk, material cost volatility and tighter financing conditions. The average time between approval and commencement is 4.2 months for apartments, compared with 2.3 months for houses1, suggesting many projects are stalling between approval and groundbreak as pre-sales soften or lending conditions tighten.
What this means for the housing supply
Australia needs more homes, and apartments are a big part of that plan. But if they keep taking this long to build, the country will keep falling short of its housing goals. An apartment approved today might not be ready to move into until 2028.
Section 04
Is Australia on track to hit its 1.2 million housing target?
Australia has a big goal: build 1.2 million new homes by June 2029 under the National Housing Accord3. For a long time, that number looked very hard to reach. But with build times now improving, the picture is starting to look a little more hopeful.
According to the National Housing Supply and Affordability Council's State of the Housing System 2026 report, Australia was on track to deliver around 980,000 new homes by June 2029, based on conditions before the conflict in the Middle East pushed up construction costs4. That is 42,000 more than the Council forecast a year earlier, but still well short of the 1.2 million target. The Council's August 2026 quarterly report now expects the target to be reached in the December quarter of 20305.
Why do build times matter for this target?
Faster build times mean homes that are already approved get finished sooner. Every month cut from a build time is a home that enters the market earlier. As houses and townhouses speed up, more of the existing pipeline turns into actual completions.
The good news is that faster house and townhouse build times feed directly into higher completion numbers. When builders can finish homes more quickly, more completions flow through each year. If the 2025 improvements hold and spread to more states, Australia could start to close some of that gap.
The bigger challenge is apartments. They make up a large share of the homes needed to hit the 1.2 million target, and they are still taking close to three years to build. Until apartment build times come down and more projects move from approval to construction, that shortfall of around 220,000 homes4 will be difficult to close.
References
- ABS Building Activity, Australia, June 2025 — Average Dwelling Commencement Times · Australian Bureau of Statistics ↑ b
- ABS Building Activity, Australia — Average dwelling completion times (jun-2025) · Australian Bureau of Statistics ↑ b c
- NHSAC Quarterly Report, March 2026 · nhsac.gov.au ↑
- NHSAC State of the Housing System 2026 · nhsac.gov.au ↑ b
- NHSAC Quarterly Report – August 2026 · nhsac.gov.au ↑
- NHSAC Quarterly Report, March 2026 · nhsac.gov.au
- ABS Building Activity, Dec 2025 · Australian Bureau of Statistics
