

Published 26 May 2026 · Updated 23 Sept 2026
Building material costs in Australia are 41.2% higher than in early 2020, even though annual price growth has slowed sharply. ABS data shows annual inflation peaked at 17.3% in mid-2022 and eased to 1.1% in 2024, before picking up to 3.8% in the June 2026 quarter as fuel and freight costs rose1. Prices have not returned to pre-pandemic levels, leaving builders, buyers and developers working from a much higher cost base.
 How long does it take to build a house in Australia?The average time from approval to handover is now about 11.5 months for a house, 14.8 months for a townhouse and almost 33 months for an apartment in Australia. While homes still take much longer to b…
 What does it cost to build a house in Australia? (2026)Building a new house in Australia costs $474,939 on average for the structure alone, based on the latest ABS completion data. Add land, and the national total sits around $847,000 at the median, climb…
Section 01 · Inflation rate
Are building material costs still rising in Australia?
Building material costs are still rising, but much more slowly than during the pandemic cost surge.
Building material input costs rose 3.8% over the year to June 2026, with a quarterly increase of 2.1% in the June quarter1. That annual rate is well below the sustained double-digit growth of 2021 and 2022, but above the pre-pandemic 10-year average of 2.1%.
The pace of change shifted quickly from its peak. Annual inflation hit 17.3% in June 2022, then declined steadily through 2023 and 2024, reaching a low of 1.1% in June 2024 and again in March 2025 before rising to 3.8% by June 2026.
The March 2025 quarter was the first quarterly decline since 2012, with input costs falling 0.1% as timber and steel prices eased. That pause was brief, with costs rising again in later quarters. The 2.1% rise in the June quarter 2026 was the largest since the December quarter 2022, driven by higher raw material, freight and fuel costs linked to the conflict in the Middle East.
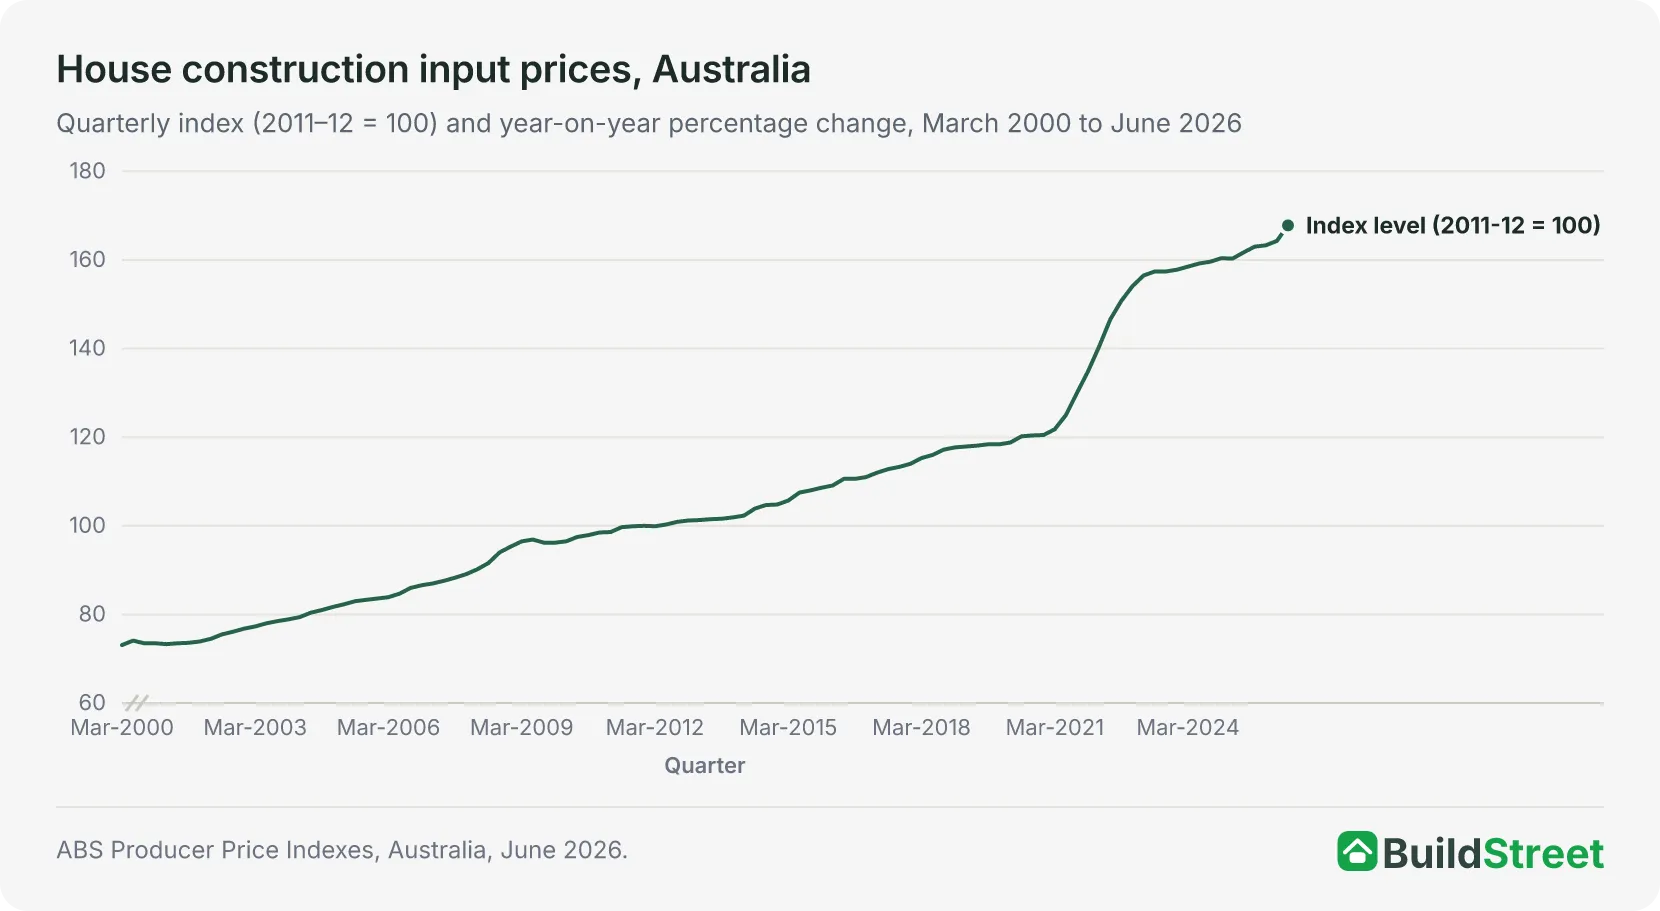
Recent quarterly data show modest growth followed by a sharp rise in mid-2026. After the −0.1% dip in March 2025, the index rose 0.9% in June, 0.8% in September, 0.2% in December, and 0.6% in March 2026, before jumping 2.1% in June 2026. The annual rate for the twelve months to June 2026 was 3.8%, compared with 17.3% in the year to June 2022.
| Quarter | Index value | Quarterly change | Annual change |
|---|---|---|---|
| Dec 2024 | 160.4 | +0.5% | +1.6% |
| Mar 2025 | 160.3 | −0.1% | +1.1% |
| Jun 2025 | 161.7 | +0.9% | +1.6% |
| Sep 2025 | 163.0 | +0.8% | +2.1% |
| Dec 2025 | 163.3 | +0.2% | +1.8% |
| Mar 2026 | 164.3 | +0.6% | +2.5% |
| Jun 2026 | 167.8 | +2.1% | +3.8% |
Source · ABS Producer Price Indexes, Australia, June 2026 (Table 18). Index reference period: 2011–12 = 100.
Section 02 · Since 2020
How much have building material costs increased since 2020?
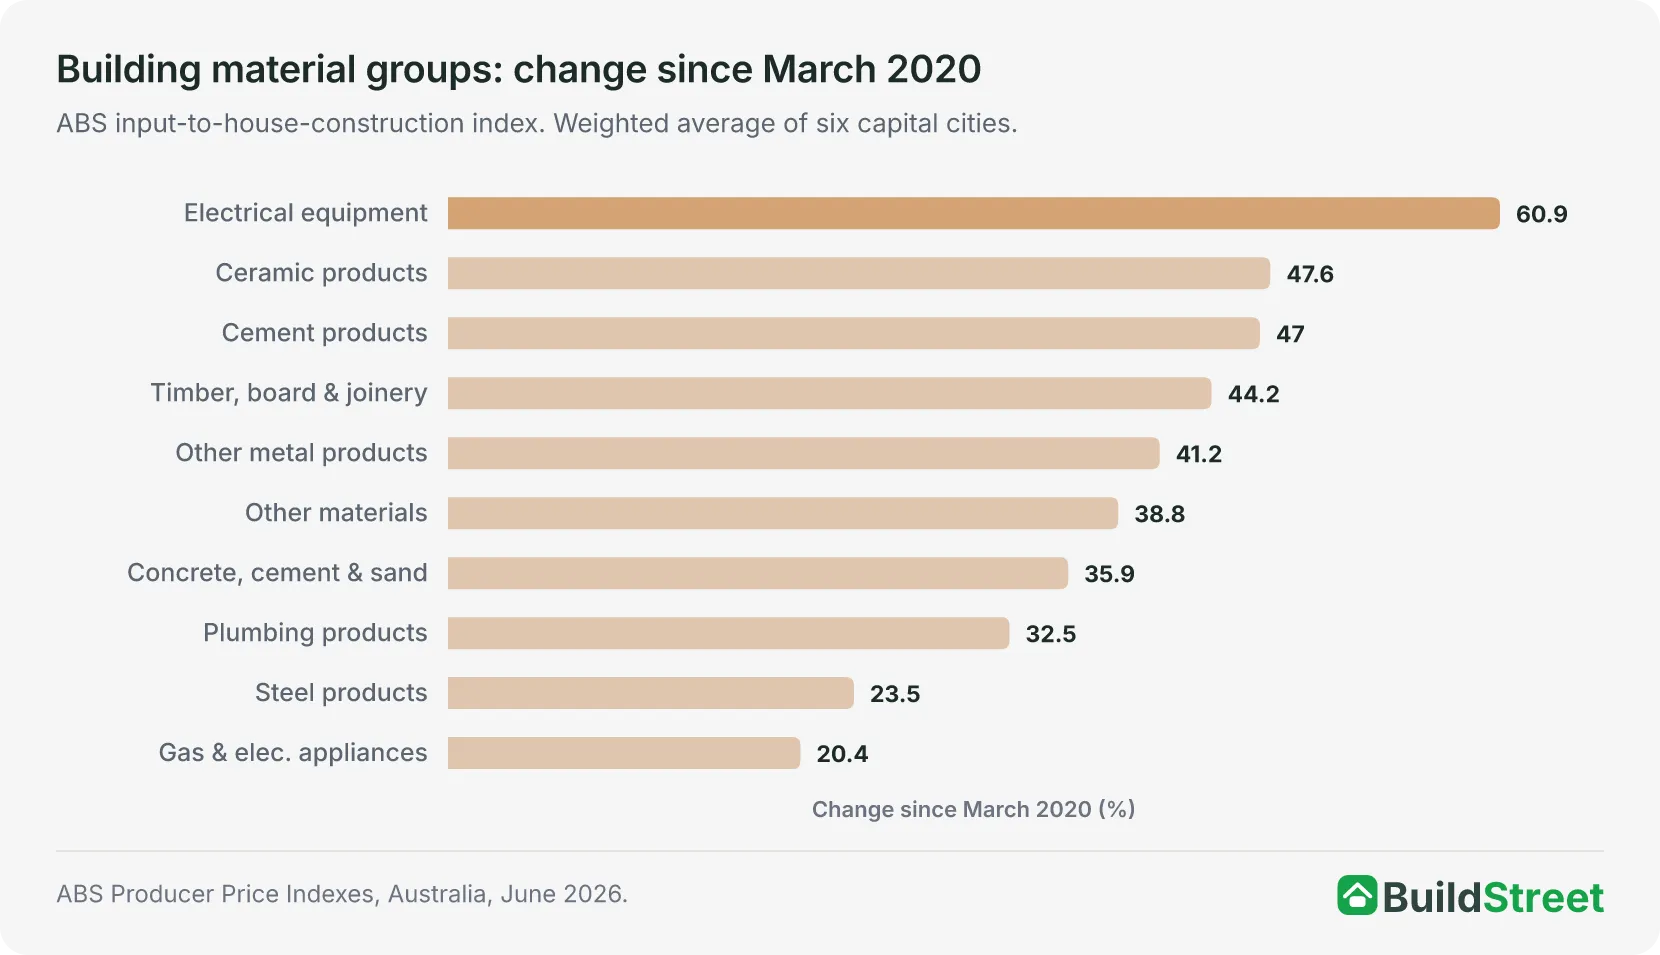
Building material input costs rose 41.2% between March 2020 and June 2026, from an index value of 118.8 to 167.8. Most of that increase was concentrated in a two-year window. Between March 2020 and June 2022 alone, costs climbed 23.4%. From June 2022 to June 2026, the index added a further 21.2 points, but spread across four years.
The 2022 calendar year recorded an annual average change of 15.7%, the highest in the 2000 to 2026 series. By 2024 and 2025, that rate had returned to 1.4% and 1.7% respectively, both below the pre-pandemic 10-year average of 2.1%.
The key qualification is that a lower inflation rate does not mean lower costs. Builders, buyers and project managers are working from a cost base that is roughly 41% above pre-pandemic levels, and that elevated baseline has not reversed.
| Year | Annual average index | Annual average change |
|---|---|---|
| 2016 | 110.3 | +2.7% |
| 2017 | 113.0 | +2.4% |
| 2018 | 116.6 | +3.1% |
| 2019 | 118.2 | +1.4% |
| 2020 | 120.0 | +1.5% |
| 2021 | 127.9 | +6.6% |
| 2022 | 148.0 | +15.7% |
| 2023 | 157.3 | +6.3% |
| 2024 | 159.4 | +1.4% |
| 2025 | 162.1 | +1.7% |
Source · ABS Producer Price Indexes, Australia, March 2026 and March 2021 releases. Methodology: Annual averages are calculated from the four quarterly ABS index values within each calendar year (March, June, September, December). The 2016 entry is used as the base for the first change calculation.
Section 03 · Materials breakdown
Which building materials have increased the most?
Plastic pipes and fittings were the fastest-rising material in the June quarter 2026, up 12.4% for the quarter. Electric cable and conduit rose 11.2% over the same period, and copper pipes and fittings were 25.1% higher than a year earlier.
The inflation profile has changed significantly since 2020. Timber and steel were the main pressure points in 2021 and 2022, but both have eased. Copper-linked electrical products, aluminium and plaster, along with higher fuel and freight costs, are now contributing more to ongoing cost pressure.
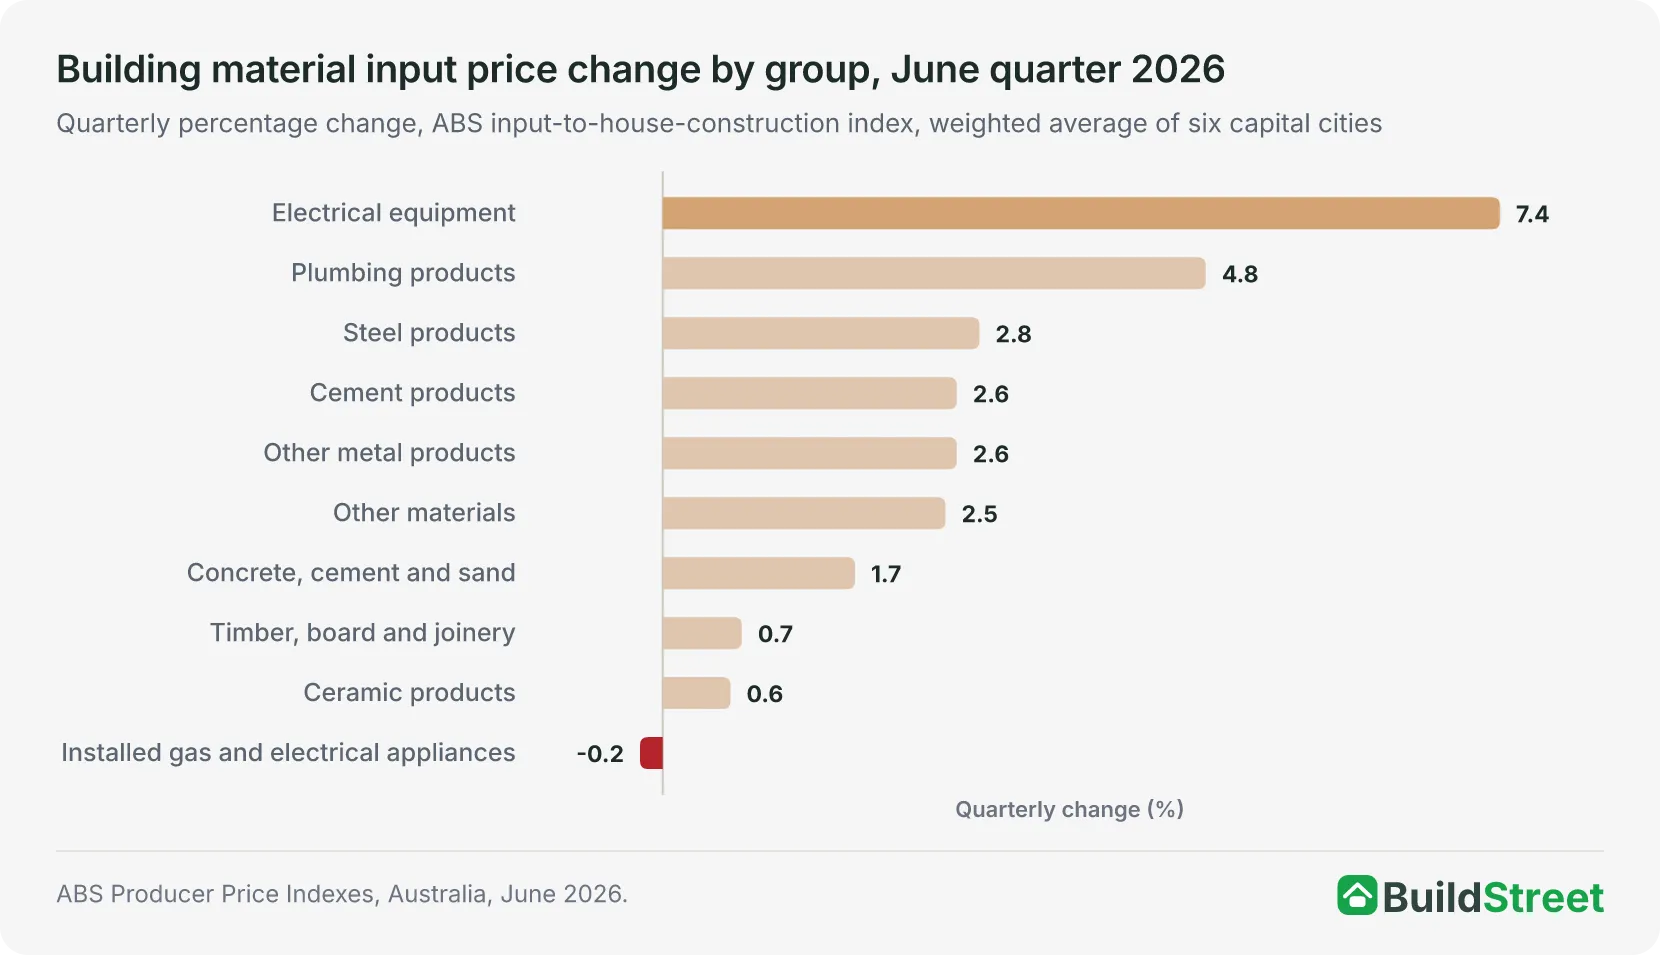
Source · ABS Producer Price Indexes, Australia, June 2026 (Table 18). Quarterly change calculated from material group index numbers, weighted average of six capital cities.
Timber prices
Timber was one of the clearest pandemic-era pressure points. By the March quarter 2022, timber, board and joinery had risen 20.6% over the year2, driven by supply shortages amplified by demand from the federal HomeBuilder programme and state construction grants. That pressure has since eased. In the June quarter 2026, the timber, board and joinery group rose 0.7% for the quarter and was 2.8% higher than a year earlier.
Steel and rebar prices
Steel products shifted from a major inflation driver in 2021 and 2022 to a disinflationary force by 2023. Steel product prices fell 4.4% in the March quarter 2023 and were down 6.2% over the year by the March quarter 2025. They fell 4.6% over the full year 2025, then rose 2.8% in the June quarter 2026, led by reinforcing steel, although prices were still 1.2% lower than a year earlier.
Concrete and cement costs
Concrete and cement have remained a steadier source of inflation. In the June quarter 2026, concrete, cement and sand rose 1.7% for the quarter and 2.8% over the year, with sand (up 5.0%) and cement (up 3.8%) rising fastest. Over the full year 2025, the same category rose 1.6%. Sustained infrastructure construction activity continues to support demand for concrete.
Copper, plumbing and electrical material costs
Copper-linked products remained a major cost driver in the June quarter 2026. Electric cable and conduit rose 11.2% for the quarter on higher copper and PVC costs, while copper pipes and fittings rose 5.7% and were 25.1% higher than a year earlier. At the group level, electrical equipment rose 7.4% in the quarter, the largest increase of any group. Other metal products rose 2.6%, led by aluminium windows and doors, and made the largest contribution to the quarter’s overall rise.
Section 04 · Drivers
What caused Australia’s building material cost surge?
Building material input costs rose 23.4% between March 2020 and June 2022, driven by a combination of demand and supply pressures that arrived simultaneously and reinforced each other. Multiple factors converged during that period, shifting the cost base to levels from which it has not retreated.
Demand-side stimulus
The federal HomeBuilder programme and state government grants created a surge in new residential construction at exactly the point when global supply chains were already under stress. More dwellings were being ordered and started than the industry could efficiently deliver.
Supply chain disruption and freight costs
Global shipping delays and high international freight costs increased the cost of imported materials, particularly timber. Shipping delays and freight costs were cited directly in commentary from 2022 as contributors to quarterly input price growth.
Timber shortages
Shortages of structural timber, combined with higher global demand and pandemic-era sawmill disruptions, pushed timber prices up sharply. Timber shortages were identified as a specific contributor in multiple quarterly releases from 2021 to 2022.
Energy costs and metals inflation
Rising energy prices raised production costs for energy-intensive materials, including steel, aluminium and concrete. ABS commentary from 2023 identified high energy and transport costs as ongoing contributors to input price growth, even after the initial surge had eased.
Trade shortages and build delays
Labour shortages meant builders could not schedule work efficiently. Housing Australia’s State of the Nation’s Housing 2022–23 reported that around 28,000 dwellings were delayed. Builders also made cost allowances of up to 40% for unexpected delays, compared with a more typical 20%. Those delay costs flowed through to final prices.
Section 05 · Cities and states
States and cities with the highest building cost pressure
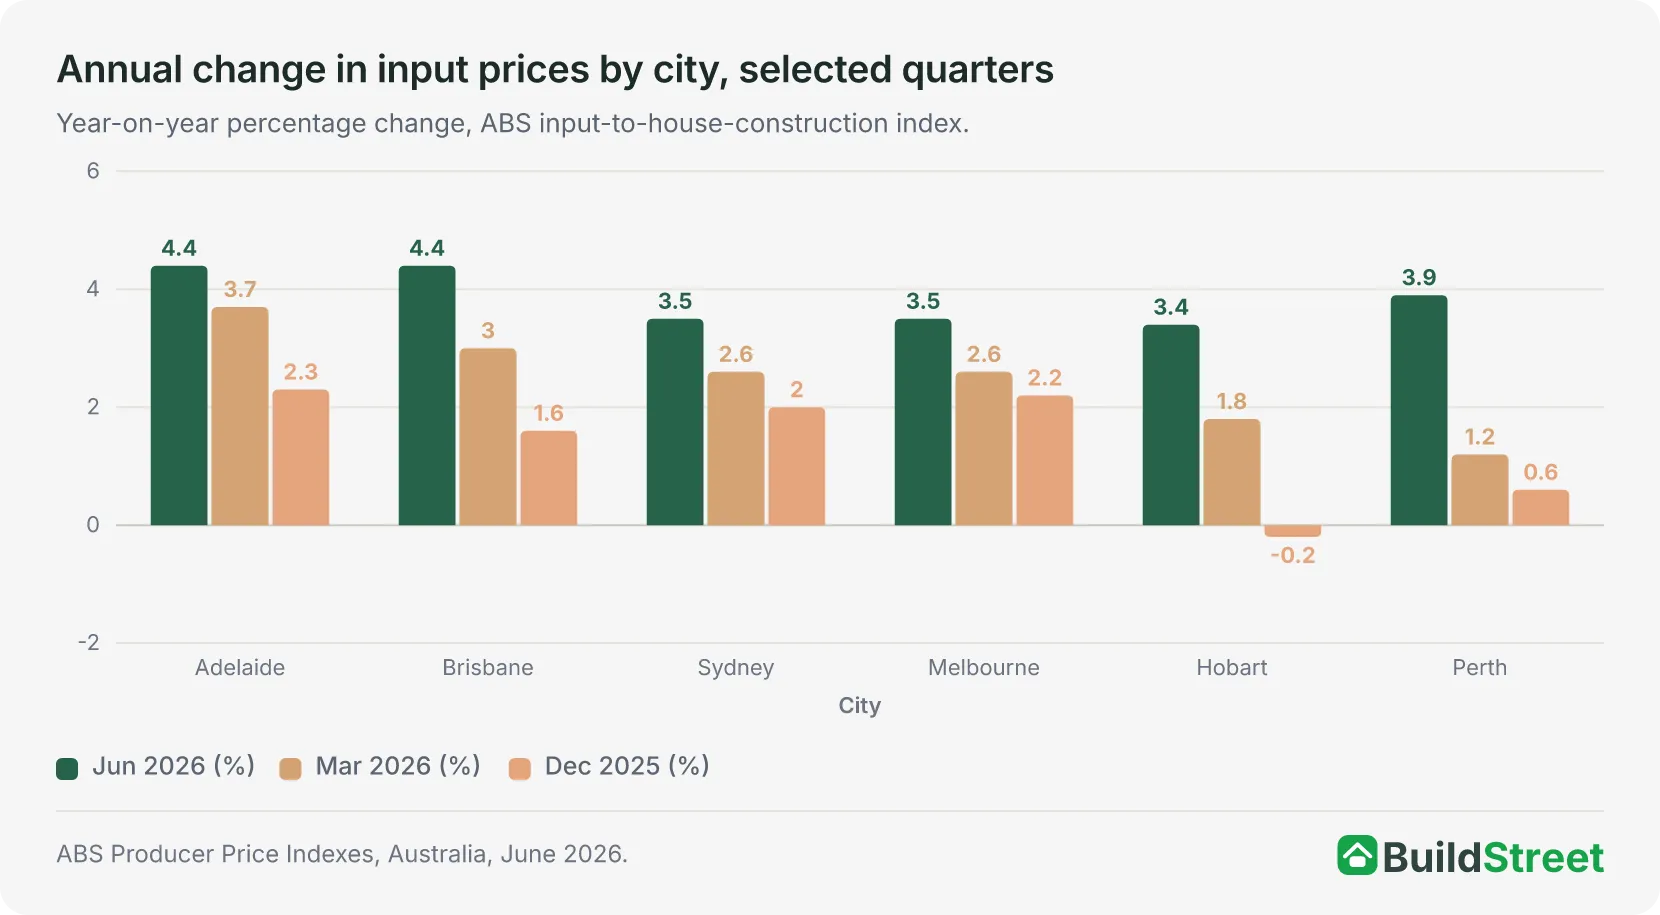
Building cost pressure varies by location and by measure. City-level input prices show changes in material costs, while state-level output prices show what builders charge for new house construction. Adelaide and Brisbane recorded the highest annual input cost increases of any capital city in the year to June 2026, both at 4.4%.
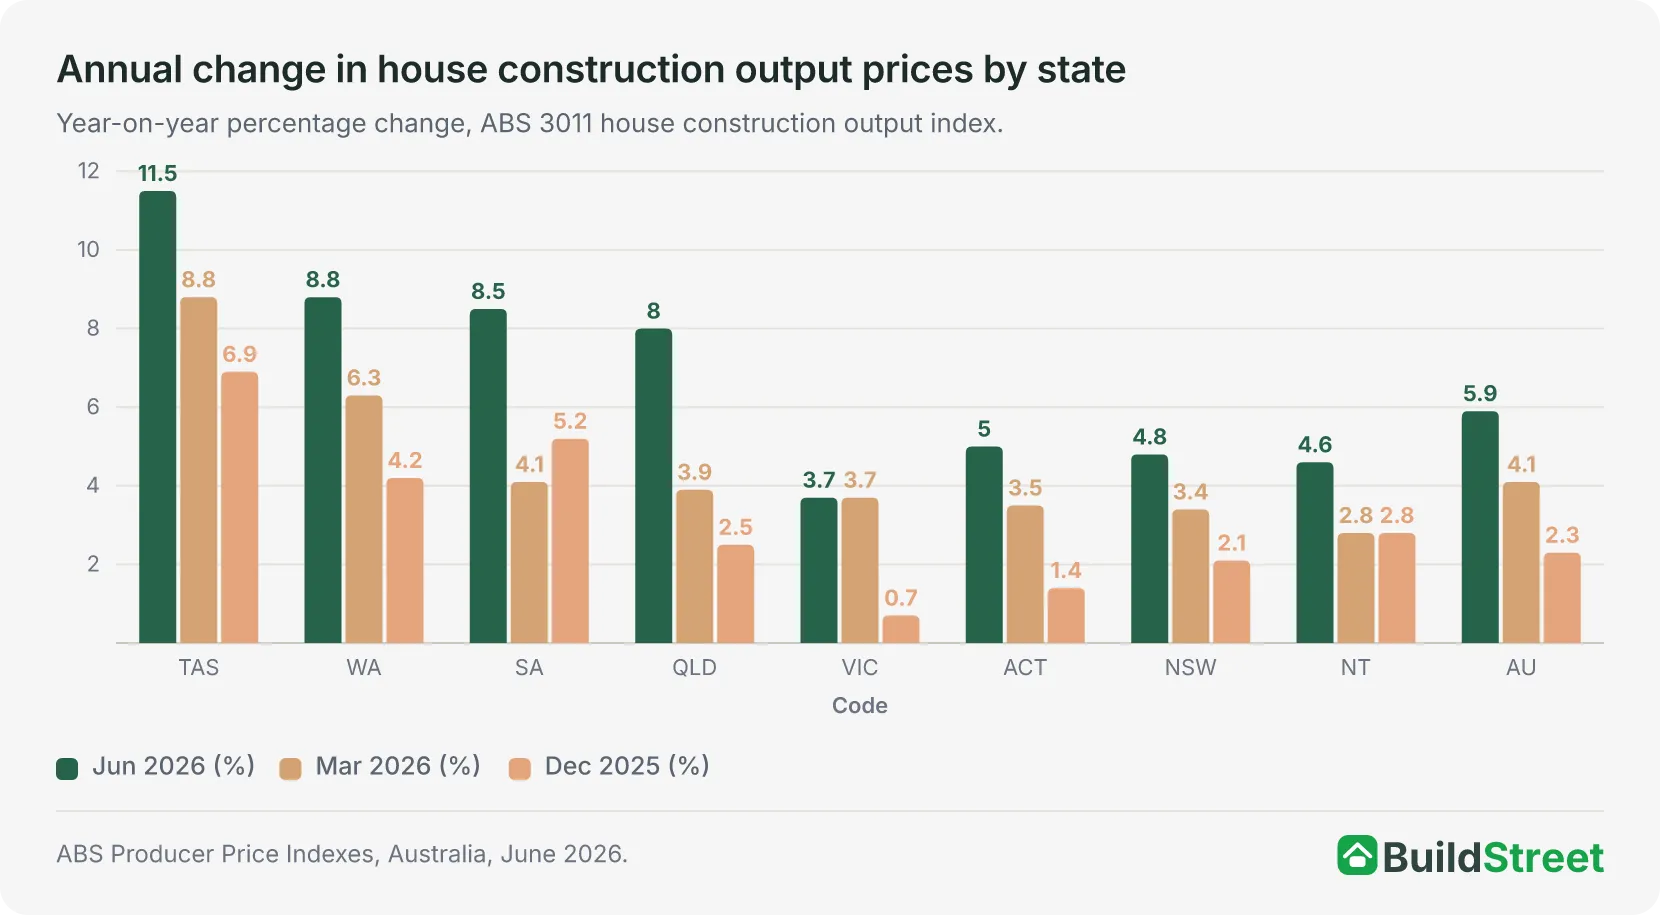
At state level, Tasmania and Western Australia recorded the strongest builder-side price growth. House construction output prices rose 11.5% in Tasmania and 8.8% in Western Australia.
Input prices show what builders pay for materials in each city. Output prices show what builders charge for new house construction, including labour, margins and other costs. The two measures can diverge, particularly in states with tight labour markets or strong demand.
Input prices by capital city
Among the six sampled capital cities, Adelaide and Brisbane recorded the highest annual input cost increases in the year to June 2026, both at 4.4%, followed by Perth at 3.9%1. Sydney and Melbourne were level at 3.5%. Hobart posted the lowest annual increase at 3.4%. Quarterly, Sydney and Brisbane recorded the highest city gains at 2.3% in the June quarter 2026.
On a cumulative basis since March 2020, the differences narrow: Brisbane’s input costs have risen 43.7% and Sydney’s 37.8%, with the other cities clustered between 41% and 43%.
Output prices by state
Builder-side price pressure is strongest in Tasmania and Western Australia. Tasmania’s house construction output prices rose 11.5% in the year to June 2026, the highest of any state1, while WA posted 8.8%, just ahead of South Australia (8.5%) and Queensland (8.0%). The national average annual change for house construction output was 5.9%, well above the input-price inflation rate of 3.8%.
On a cumulative basis, the difference since March 2020 is more pronounced. Western Australia’s house construction output prices have risen 102.9%, more than doubling in just over six years. Tasmania recorded the next-largest increase at 68.2%, followed by South Australia at 64.4% and Queensland at 62.6%. Among the states, Victoria recorded the smallest cumulative rise at 34.2%.
| State | Output index (Jun 2026) | Annual change | Cumulative since Mar 2020 |
|---|---|---|---|
| Tasmania | 201.3 | +11.5% | +68.2% |
| Western Australia | 219.7 | +8.8% | +102.9% |
| South Australia | 179.7 | +8.5% | +64.4% |
| Queensland | 199.2 | +8.0% | +62.6% |
| Australia (national) | 182.6 | +5.9% | +50.4% |
| ACT | 168.3 | +5.0% | +53.4% |
| New South Wales | 193.0 | +4.8% | +41.2% |
| Northern Territory | 132.6 | +4.6% | +19.9% |
| Victoria | 164.7 | +3.7% | +34.2% |
Source · ABS Producer Price Indexes, Australia, June 2026 (Table 17). ABS subdivision 3011 House construction. Annual change calculated from June 2025 and June 2026 index values. Cumulative change from March 2020 to June 2026. Index reference period: 2011–12 = 100.
Section 06 · New home building
How do material costs affect new home prices?
New dwelling prices charged to owner-occupiers rose 5.8% over the year to June 20263. That outpaced the input-only inflation rate of 3.8%. House construction output prices rose 5.9% over the same period.
The gap reflects the additional weight of labour costs, builder margins and financing conditions, which sit on top of materials in the final price. Builders faced continued pressure in securing bricklayers, carpenters and concreters during the June quarter, while higher fuel and delivery costs were passed on to customers. That combination of labour and material tightness feeds through directly to prices charged to owner-occupiers contracting to build a new home.
On a cumulative basis, the output-of-building-construction index rose from 116.0 in March 2020 to 163.3 in June 2026, a gain of 40.8%. This closely tracked the increase in input costs over the same period. Even where individual materials, such as steel, have fallen recently, overall residential construction prices remain far above 2020 levels.
Section 07 · Housing target
Why construction costs matter for the 1.2 million homes target
Construction costs matter for the National Housing Accord because they affect whether approved homes can move through to commencement and completion.
Since the Accord began in July 2024, quarterly building approvals have risen by 26% and commencements by 15%. About 308,000 homes were completed over the first seven quarters of the Accord, around one-quarter of the target. However, the NHSAC’s August 2026 Quarterly Report expects the 1.2 million target to be reached only in the December quarter 20304, well after the Accord period ends in mid-2029.
The NHSAC’s annual housing assessment modelled two construction cost shock scenarios linked to geopolitical instability. A 6% peak increase in construction costs could reduce completions by 10,000 homes by mid-2029. A 10% peak increase could reduce completions by 33,000 homes. By the NHSAC’s August 2026 Quarterly Report, real construction costs for new houses were 0.2% higher than when the Accord began, reversing the 0.9% fall it reported in March, after fuel and petrochemical prices rose with the conflict in the Middle East. The Council warns that higher costs may make some housing projects unviable in the near term.
ABS pipeline data shows the current gap between approvals and completions. In July 2026, total dwelling approvals were 17,687 seasonally adjusted, up 9.0% from a year earlier. In the March quarter 2026, commencements fell to 48,012, while completions were 43,816, up 0.8% over the year. There were 243,864 dwellings under construction at the end of that quarter5, the most since records began in 1984.
Section 08 · Outlook
What building cost trends mean in 2026
Builder-side prices are rising at 4.9% to 5.9% annually, well above the materials-only rate of 3.8%. This is because labour costs, trades availability and builder margins also feed into the final price of a new home. The cost base set during 2022 has not reversed. In 2026, construction quotes typically reflect costs that are around 41% above 2020 levels.
Three conclusions follow from the data.
Material cost inflation has picked up again, but remains far below its 2021 and 2022 peak. The June quarter 2026 rise was driven by fuel, freight and petrochemical costs linked to the conflict in the Middle East, on top of ongoing pressure in copper-linked electrical products, aluminium and plaster. The ABS found the conflict’s overall effect on building prices was smaller than expected, as the initial price shocks eased during the quarter, so a repeat of the 2021 and 2022 materials shock is not the base case, but it is a clearer risk than it was earlier in 2026.
Builder-side prices are still rising faster than material inputs. Output prices are up 4.9% to 5.9% annually, compared with 3.8% for inputs. Monthly CPI data also shows that prices charged to owner-occupiers for new homes continue to increase.
The higher cost base remains in place. Construction quotes in 2026 are likely to reflect costs that are roughly 41% above 2020 levels, and further increases are running faster than they were a year ago.
Lower risk
Annual input inflation (3.8%) is far below its 2022 peak, though above its pre-pandemic average of 2.1%. Timber and steel are not adding significant pressure. The Middle East conflict’s effect on building prices was smaller than the ABS expected, so a repeat of the 2022 shock is unlikely on current data.
Ongoing pressure
Copper-linked costs are rising sharply and feeding through to electrical and plumbing components. Fuel, freight and PVC costs jumped in the June quarter 2026, and concrete remains elevated. Labour costs and trades availability continue to push output prices above the input-price benchmark.
Key risk
The NHSAC has modelled scenarios in which a 6–10% construction cost shock (from geopolitical disruption or commodity price moves) could cut housing completions by 10,000 to 33,000 through to mid-2029, adding pressure to an already constrained supply pipeline.
Monthly CPI data on new dwellings provide a useful near-term indicator. New dwelling prices rose 4.5% over the year in March 2026, 4.7% in April, 5.6% in May and 5.8% in June, before easing slightly to 5.7% in July. The climb through mid-2026 suggests builder pricing has not settled, even as the materials-only measure remains comparatively contained.
For the construction sector, the main pricing risks in 2026 are fuel and freight shocks that spread across many materials at once, as in the June quarter, and continued volatility in copper-linked plumbing and electrical products, combined with ongoing labour and subcontractor cost pressure. Quotes should allow for escalation in those categories and for fuel and delivery surcharges, rather than assuming all materials are rising at a uniform rate.
References
- ABS Producer Price Indexes, Australia, June 2026 (Cat. 6427.0) · Australian Bureau of Statistics ↑ b c d
- ABS Producer Price Indexes, Australia, March Quarter 2022 · Australian Bureau of Statistics ↑
- ABS Consumer Price Index, Australia (latest release, Cat. 6401.0) · Australian Bureau of Statistics ↑
- NHSAC Quarterly Report – August 2026 · nhsac.gov.au ↑
- ABS Building Activity, Australia, March 2026 (Cat. 8752.0) · Australian Bureau of Statistics ↑
- ABS Producer Price Indexes, Australia (Cat. 6427.0) — latest release · Australian Bureau of Statistics
- ABS Producer Price Indexes, Australia, March Quarter 2025 · Australian Bureau of Statistics
- ABS Producer Price Indexes, Australia, March Quarter 2024 · Australian Bureau of Statistics
- ABS Producer Price Indexes, Australia, March Quarter 2023 · Australian Bureau of Statistics
- ABS Producer Price Indexes, Australia, March Quarter 2021 · Australian Bureau of Statistics
- ABS Building Approvals, Australia (latest release, Cat. 8731.0) · Australian Bureau of Statistics
- NHSAC State of the Housing System 2026 · nhsac.gov.au
- Housing Australia — State of the Nation's Housing 2022–23 · housingaustralia.gov.au
- National Housing Accord · treasury.gov.au
- ABS, Building Activity, Australia (latest release, Cat. 8752.0) · Australian Bureau of Statistics
