

Published 12 Apr 2026 · Updated 22 Sept 2026
Australia has completed 307,635 homes in the first seven quarters of the National Housing Accord1, leaving the country 112,365 homes behind the pace needed to reach 1.2 million by June 2029. Australia is still not on track. In August 2023, National Cabinet committed to building 1.2 million new, well-located homes over five years2. To hit that number, the construction industry needs to average 240,000 completions every year through to June 2029, at 20,000 homes a month for 60 straight months. Data for the first 21 months shows completions running flat against the years before the Accord, and well behind the required pace.
 How many homes are built in Australia each year?Two distinct cycles have shaped Australia's housing output since 2010:
 Why is Australia falling short of its housing target?Australia is behind the pace needed to meet its 1.2 million-home target. By the March 2026 quarter, 308,000 homes had been completed, equal to about 26% of the National Housing Accord goal. To reach t…
Section 01
Target pace vs actual pace for Australia's 1.2 million homes target
To put 240,000 annual completions in context: the best year Australia managed in the decade before the Accord was around 225,000 dwellings. The target asks the industry to beat that record every year for five years, while carrying a chronic labour shortage and a backlog of multi-year projects.
The NHSAC's August 2026 quarterly report puts building approvals 26% higher and commencements 15% higher nationally than in the quarter before the Accord began1. Physical completions are what count toward the target, and at 307,635 across seven quarters, the monthly average sits at around 14,649, some 27% below the required 20,000 per month.
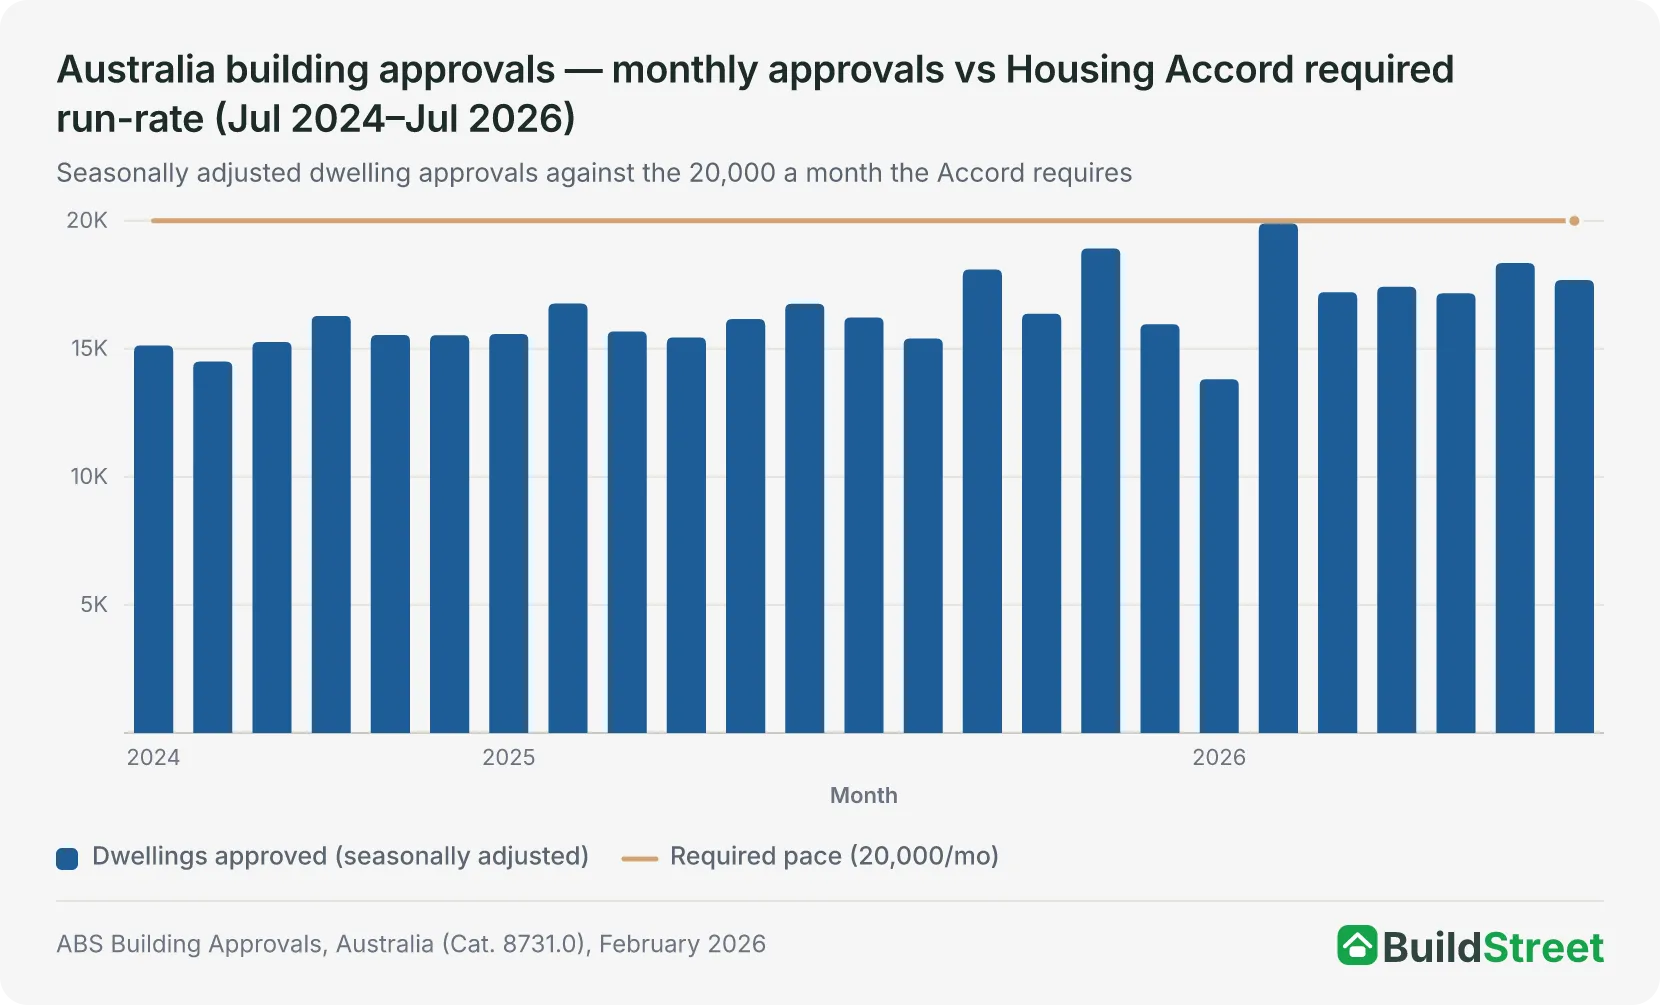
| Period | Total approved | Monthly change | Year-on-year | Key driver |
|---|---|---|---|---|
| May 2026 | 17,169 | −1.5% | +6.2% | Multi-unit eased to 6,443; houses firmed to 10,726. |
| June 2026 | 18,351 | +6.9% | +9.5% | Multi-unit rebounded 15.9% to 7,468; houses at 10,883. |
| July 2026 | 17,687 | −3.6% | +9.0% | Houses eased to 10,395; multi-unit held at 7,292. |
Source · Building Approvals: seasonally adjusted, ABS Building Approvals, Australia (Cat. 8731.0), July 2026 release. Building Activity: seasonally adjusted, ABS Building Activity, Australia (Cat. 8752.0). July 2026 approvals of 17,687 remain below the 20,000 monthly threshold, and no month since the Accord began has cleared it. March 2026 quarter commencements of 48,012 annualise to around 192,000, still below the 240,000 annual target. Not all approvals convert to completions.
| Quarter-by-quarter Accord tracker | |||||
|---|---|---|---|---|---|
| Quarter | Actual completions | Quarterly gap | Cumulative actual | Cumulative target | Cumulative gap |
| Sep 2024 | 45,410 | −14,590 | 45,410 | 60,000 | −14,590 |
| Dec 2024 | 45,373 | −14,627 | 90,783 | 120,000 | −29,217 |
| Mar 2025 | 43,485 | −16,515 | 134,268 | 180,000 | −45,732 |
| Jun 2025 | 40,971 | −19,029 | 175,239 | 240,000 | −64,761 |
| Sep 2025 | 44,601 | −15,399 | 219,840 | 300,000 | −80,160 |
| Dec 2025 | 43,979 | −16,021 | 263,819 | 360,000 | −96,181 |
| Mar 2026 | 43,816 | −16,184 | 307,635 | 420,000 | −112,365 |
Source · ABS Building Activity, Australia, March 2026 (seasonally adjusted, with revisions to earlier quarters). Completions have averaged 43,948 per quarter, roughly 73% of the required pace. Seven of the Accord's 20 quarters have elapsed but only 25.6% of the target has been delivered.
Section 02
The building time blowout: how long it actually takes to finish a home in 2025
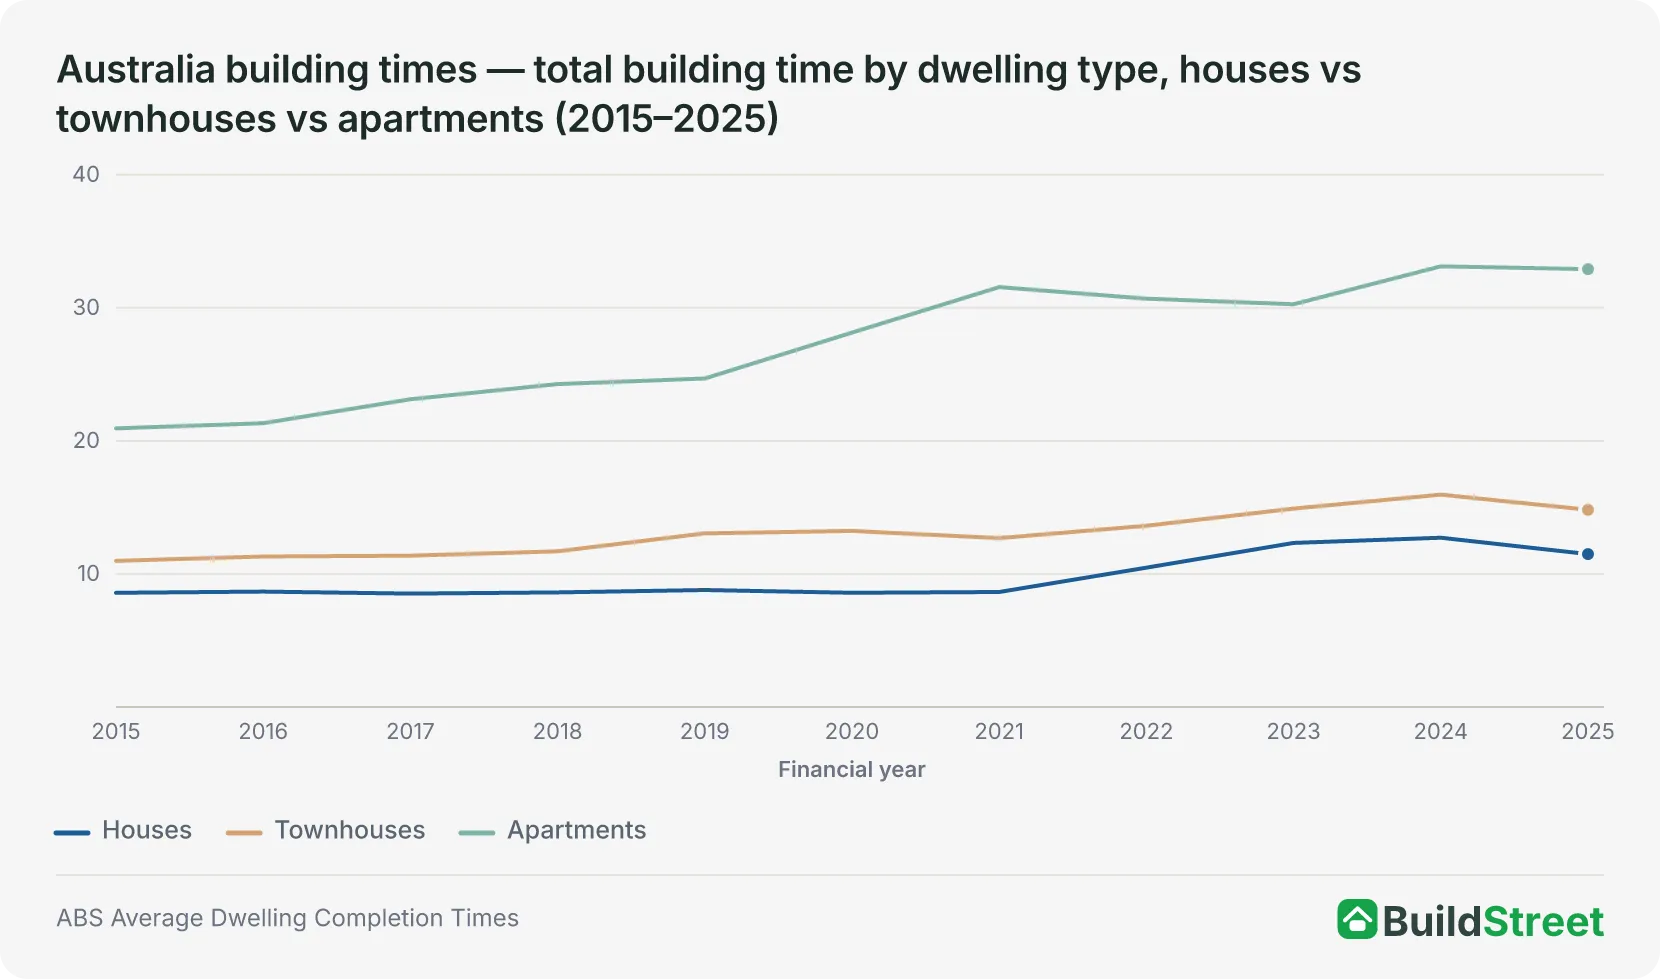
Longer build times are one of the biggest drags on the target. The longer a home takes to finish, the longer capital and trades are locked in, choking the flow of new projects. The pipeline gets bigger, but supply does not.
Total house building time (from approval to completion) has risen from 8.58 months in 2019–20 to 11.49 months in 2024–25. Apartments are in a worse position: build times stretched from 28.14 months to 32.91 months over the same period.
Section 03
State-by-state comparison of housing targets and delivery
The Accord splits the 1.2 million target across states and territories on a per-capita basis. The NHSAC's April 2026 forecast has only Western Australia and the ACT reaching their share, with the rest falling short by margins ranging from 6% in Victoria to 66% in the NT3. Its August 2026 quarterly report has since pushed every jurisdiction's expected finish past June 2029.
| State / Territory | Accord target | NHSAC forecast supply | Shortfall | Gap |
|---|---|---|---|---|
| New South Wales | 376,000 | 258,000 | −118,000 | −31% |
| Victoria | 306,000 | 287,000 | −19,000 | −6% |
| Queensland | 246,000 | 204,000 | −42,000 | −17% |
| Western Australia | 129,000 | 129,000 | 0 | 0% |
| South Australia | 84,000 | 66,000 | −18,000 | −22% |
| Tasmania | 26,000 | 13,000 | −13,000 | −49% |
| ACT | 21,000 | 22,000 | +1,000 | +3% |
| Northern Territory | 11,000 | 4,000 | −7,000 | −66% |
| National total | 1,200,000 | 980,000 | −220,000 | −18% |
Source · NHSAC, State of the Housing System 2026, Table 4.1 (gross new housing supply estimates, FY2024–25 to FY2028–29, early 2026 outlook). Figures are rounded to the nearest thousand, so shortfalls may not exactly match the ratio column. Targets are the Council's population-implied shares of the 1.2 million target, not a figure the states have formally agreed.
- New South Wales has the largest allocation (376,000 homes) but only 21% built against a 35% pace benchmark. Approvals are up 6% over the past year while completions have slipped 1%, and although 70,000+ homes are under construction, NSW is forecast to deliver 258,000 homes, 69% of its share, and isn't expected to complete it until March 2032, almost three years late.
- Victoria targets 800,000 homes over ten years, more ambitious than its federal share, yet recorded its lowest annual completions since 2014 in the year to September 2025. Approvals have fallen 2% and completions 9% over the past year, and the state's high property tax burden and projected $192.6 billion net debt are pushing developer capital to other states.
- Queensland and Western Australia are the standout performers. QLD approvals are up 23% over the past year, though completions have slipped 2% and it is still forecast to land at 83% of its share, now reaching it by March 2031. WA is the only state projected to meet its target in full, but its completions fell 9% over the past year and the August 2026 report now expects it to get there by December 2029, six months late.
- South Australia, Tasmania and the Northern Territory face the deepest gaps: SA at 22% below target, Tasmania at 49% and the NT at 66%. Tasmania is not expected to reach its share until mid-2034, the NT not until after 2034. In smaller markets, planning reform only goes so far; industry capacity is the binding constraint.
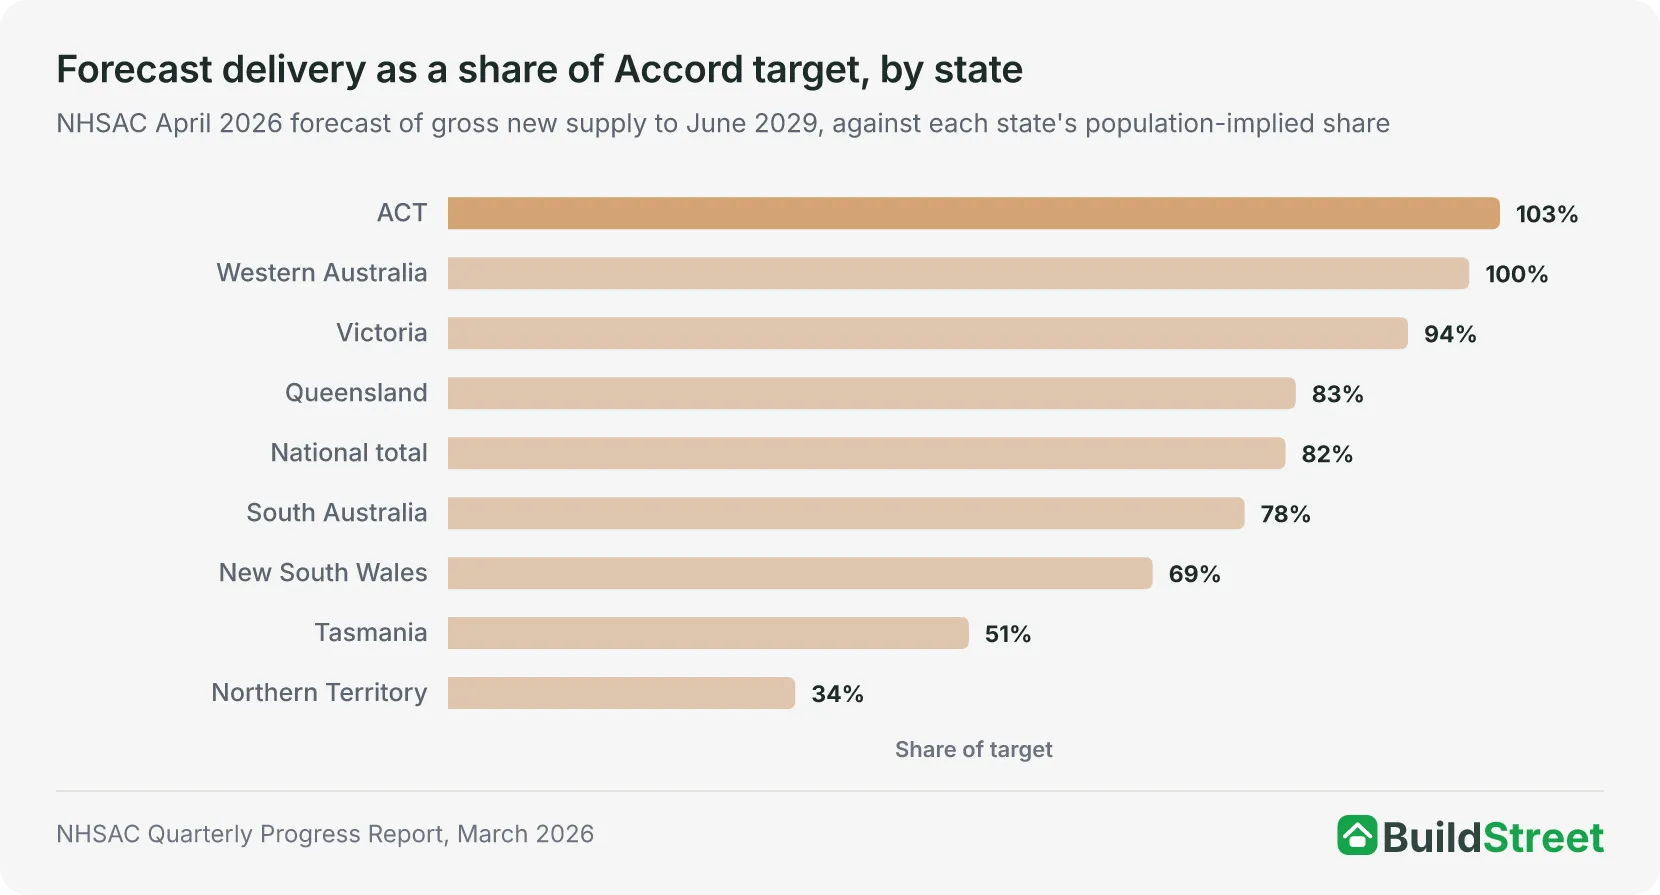
Only Western Australia, at 100% of its share, and the ACT, at 103%, are forecast to meet their per-capita allocation. Victoria comes close at 94%; Tasmania at 51% and the NT at 34% are furthest behind3. Source: NHSAC, State of the Housing System 2026.
Forecast volumes tell only part of the story. The NHSAC also projects when each state is likely to complete its Accord share, based on current approval and build rates. In its August 2026 quarterly report the Council no longer expects any state or territory to get there by the June 2029 deadline: Victoria, Western Australia and the ACT are closest at December 2029, and the national total is now expected in the December quarter of 20301.
| When each state is on pace to complete its Housing Accord share | ||||
|---|---|---|---|---|
| State / Territory | Share approved to date | Share built to date | Gap to 35% pace | Expected completion |
| New South Wales | 27% | 21% | −14 pp | Mar 2032 |
| Victoria | 37% | 32% | −3 pp | Dec 2029 |
| Queensland | 35% | 24% | −11 pp | Mar 2031 |
| South Australia | 35% | 28% | −7 pp | Mar 2031 |
| Western Australia | 38% | 29% | −6 pp | Dec 2029 |
| Tasmania | 20% | 16% | −19 pp | Jun 2034 |
| Northern Territory | 14% | 9% | −26 pp | After 2034 |
| ACT | 33% | 34% | −1 pp | Dec 2029 |
| Australia | 33% | 26% | −9 pp | Dec 2030 |
Source · Share approved and share built to date: NHSAC Quarterly Report, August 2026 (approvals to June 2026, completions to the March 2026 quarter, the seven-quarter mark; pp = percentage points, against the 35% of the Accord period elapsed). Expected completion: NHSAC Quarterly Report, August 2026, which revised the dates in State of the Housing System 2026. State and territory targets are the Council's population-implied shares of the 1.2 million target.
Section 04
The size of the shortfall: three forecasts, one clear answer
Australia's three leading forecasters all agree the 1.2 million target won't be met. Where they differ is on how large the miss will be.
- The NHSAC projects gross supply of 179,000 dwellings in 2025–26, rising to a peak of 215,000 by 2028–29. Across the full Accord period that totals 980,000 homes3, around 44,000 a year short of target, and in its August 2026 quarterly report the Council pushed the date it expects the 1.2 million mark to be reached to the December quarter of 2030, 18 months past the deadline. Its conclusion: for every five homes the target demands, the industry is on track to build four.
- The HIA forecast 1.01 million commencements across the five years in its August 2025 outlook, with multi-unit starts nearly doubling from their 2024 trough to around 100,000 a year by 2029. Its July 2026 reading of the ABS data put commencements at 197,340 in the year to March 20264, up 12% on the year before but short of the 240,000 the Accord needs — and further short of the 250,000 a year the HIA argues is required to clear the existing shortage. That optimism hinges on one assumption: rising house prices restoring the financial viability of off-the-plan apartments. If prices rise enough, the shortfall narrows. If rates stay elevated, it widens.
- Master Builders Australia forecasts 1.034 million starts, a 13.8% miss5, based on detailed state-by-state capacity modelling. The MBA also notes the Accord launched from its weakest starting point in over a decade: FY 2023–24 recorded just 158,690 new starts, an 8.8% annual fall.
The chart below maps the two published annual forecast paths against the 240,000-per-year required rate. Note they measure different things: the NHSAC forecasts gross new supply, which is completions, while Master Builders forecasts new dwelling starts, an earlier point in the build. Both climb through 2027–29, and neither reaches 240,000 in any single year. The HIA is not plotted because it publishes calendar-year commencements rather than an annual financial-year path.
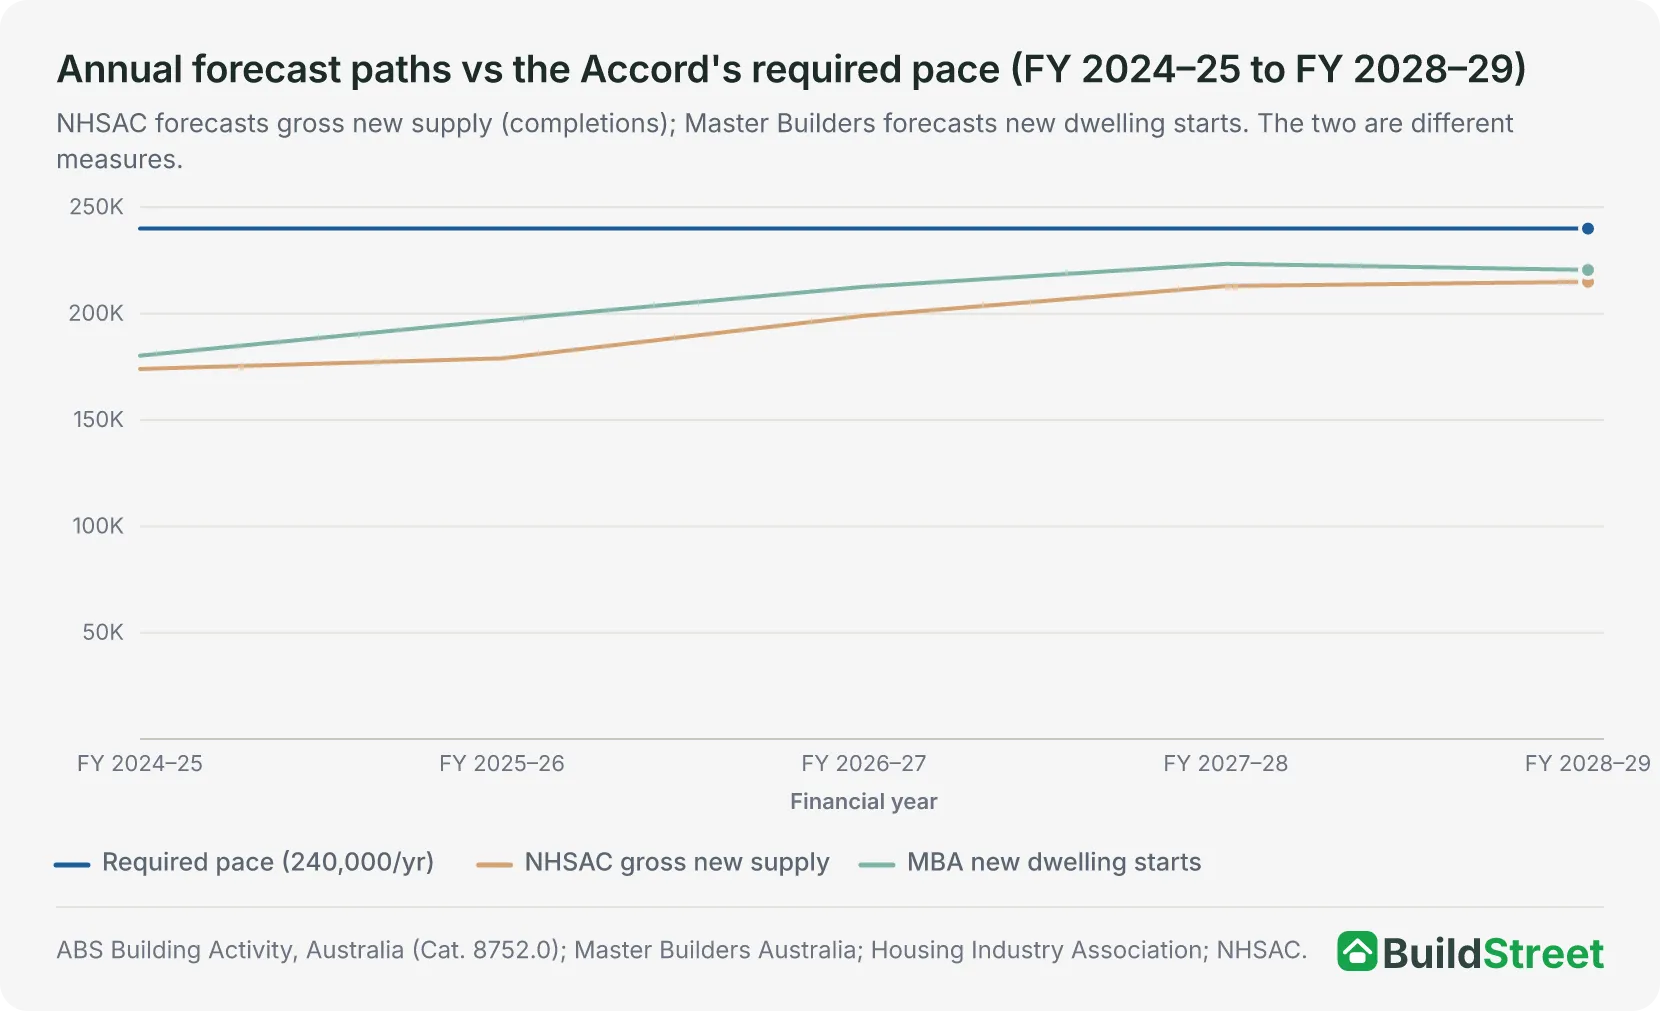
FY 2024–25 completions are confirmed at 175,239. The forecasters start close to that mark and diverge from there: Master Builders projects new dwelling starts climbing to 223,437 by FY 2027–28 before easing to 220,564, while the NHSAC has gross new supply reaching 215,000 by FY 2028–29. Neither reaches 240,000 in any year of the Accord. Source: ABS Building Activity, Australia (Cat. 8752.0); NHSAC, State of the Housing System 2026; Master Builders Australia, Building and Construction Industry Forecasts (September 2024).
Section 05
What's actually holding the build back
The gap is not a demand problem. Australians need housing urgently. It is a supply-side problem, and no single policy can resolve it on its own.
- Labour shortage. BuildSkills Australia estimates the sector needs 90,000 additional workers immediately to meet the Accord target, with the biggest gaps in bricklaying, carpentry, tiling and roofing. A shortfall in one trade delays every trade that follows. Skilled migration helps, but it also adds to housing demand.
- Costs at a permanently elevated baseline. Building construction costs are up 40.8% since just before the pandemic, and 7.2% since the Accord began. Growth has slowed — the NHSAC puts detached housing costs up 2.3% over 2025 and higher-density costs up 3.6%3, both below recent peaks — but the absolute baseline remains elevated. A 2025 feasibility review found that mid-rise apartment projects cannot deliver a standard profit margin in mainland capitals without subsidy or lower land costs.
- Planning reform is uneven. NSW and VIC have introduced major top-down changes, but local council implementation is inconsistent. Resident opposition, planning tribunal backlogs and politically-charged rezonings add time to approvals and cost to projects.
- Apartments are still the missing piece. Multi-unit dwellings account for the bulk of homes needed to reach 1.2 million; detached houses cannot fill the gap alone. The high-density sector has been largely stalled since 2022. Developers need pre-sales to start, buyers are hesitant at current borrowing costs, and banks will not release finance without enough pre-sales. This deadlock is beginning to ease, but it has already cost the Accord its first two years of apartment pipeline.
Section 06
The road ahead: slow progress is still progress
Australia is still falling short. Even on the MBA's most optimistic forecast, the country will miss about 1 in 7 of the homes needed by June 2029. On the NHSAC's latest forecast, the shortfall is closer to 1 in 6.
The second half of 2025 brought some genuine momentum. Commencements rose in consecutive quarters to a December peak before falling back 11% in the March 2026 quarter, while completions lifted off their June low and have held near 44,000 a quarter since. Build times eased across every state. NSW planning approvals are moving 15% faster under the Housing Delivery Authority. February 2026's multi-unit approvals spike proved as volatile as it looked: revised ABS figures put the jump at 162%, but the five months since have settled around 7,000 a month against February's 9,5106.
For people building now, two practical points stand out:
- Trade availability is improving as the HomeBuilder backlog clears. The build time data across most states confirms this trend is real.
- Competition for trades will likely intensify again by 2027–28 as the apartment pipeline scales up. The next 12 to 18 months may represent better trade availability than what follows.
References
- NHSAC Quarterly Report – August 2026 · nhsac.gov.au ↑ b c
- Treasury, National Housing Accord · treasury.gov.au ↑
- NHSAC State of the Housing System 2026 · nhsac.gov.au ↑ b c d
- Housing Industry Association, Home building falls to almost 30 per cent below Government's target (8 July 2026) · hia.com.au ↑
- Master Builders Australia, Building and Construction Industry Forecasts · masterbuilders.com.au ↑
- ABS Building Approvals, Australia, July 2026 (Cat. 8731.0) · Australian Bureau of Statistics ↑
- Average dwelling completion times · Australian Bureau of Statistics
- Housing Industry Association, Housing and Economic Outlook Report · hia.com.au
- National Housing Accord · treasury.gov.au
- Institute of Public Affairs, 36,000 Homes Behind Target · ipa.org.au
- ABS Building Activity, Australia, March 2026 (Cat. 8752.0) · Australian Bureau of Statistics
- ABS Building Approvals, Australia, June 2026 (Cat. 8731.0) · Australian Bureau of Statistics
- ABS Producer Price Indexes, Australia, June 2026 (Cat. 6427.0) · Australian Bureau of Statistics
- NHSAC Quarterly Report, March 2026 · nhsac.gov.au
