

Published 14 Apr 2026 · Updated 16 Sept 2026
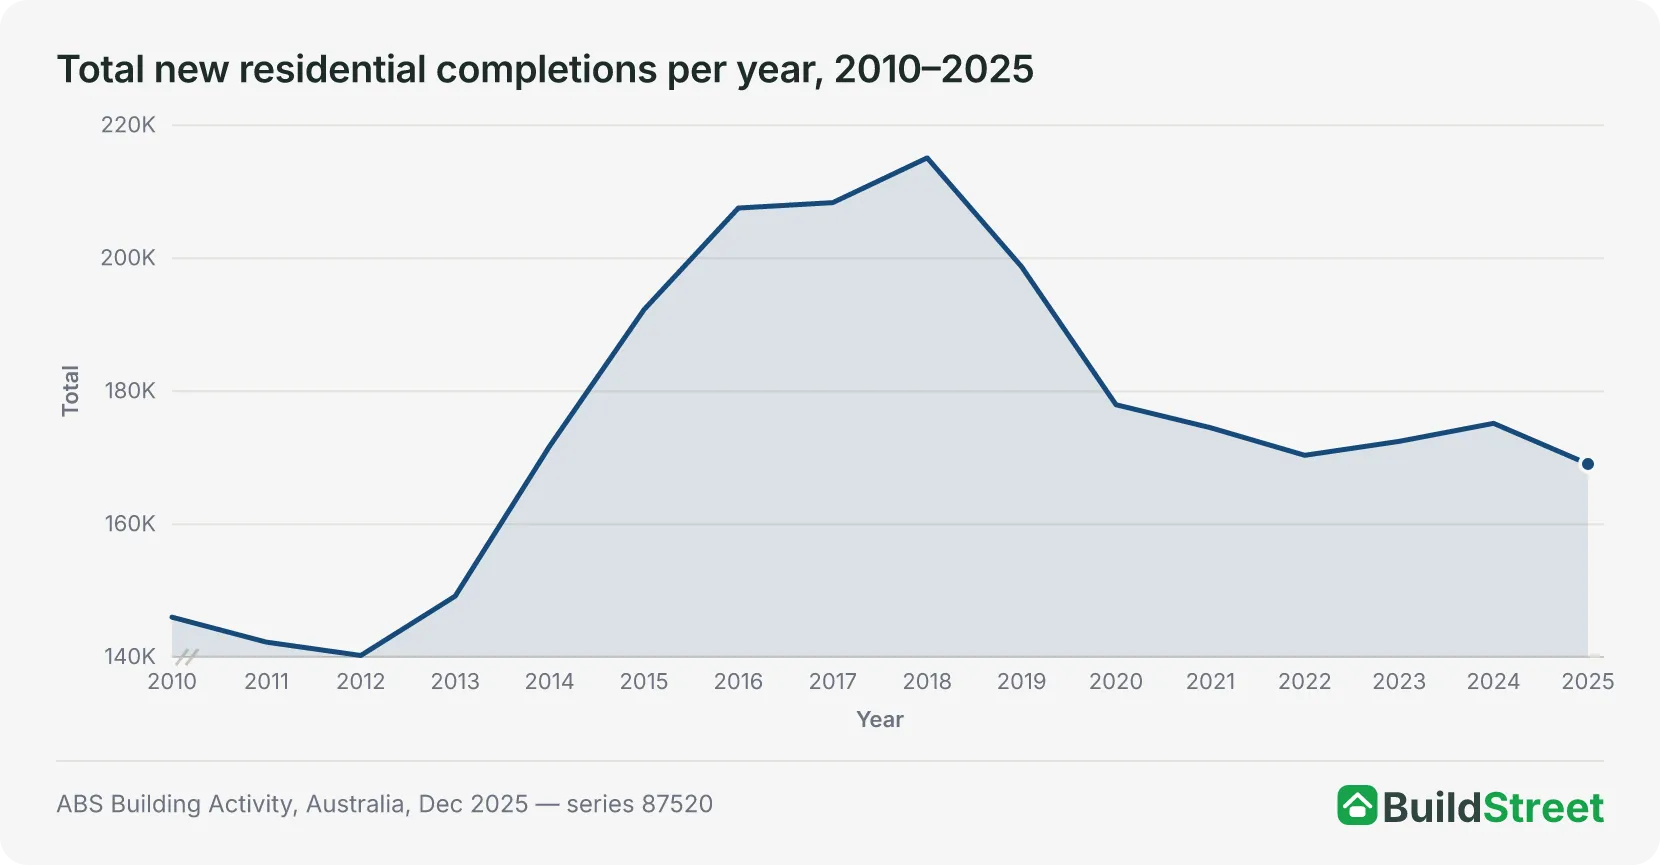
Australia built 169,057 new private sector homes in 2025, or about 172,642 when public and community housing is included1. That was down from 175,167 in 2024 and remains well below the pace needed to meet the National Housing Accord target of 1.2 million new homes by June 20292. Since 2010, private sector output has averaged roughly 175,700 dwellings a year, with completions peaking at 215,103 in 2018 before falling back. This slowdown in overall numbers is reflected in the shifting mix of housing types.
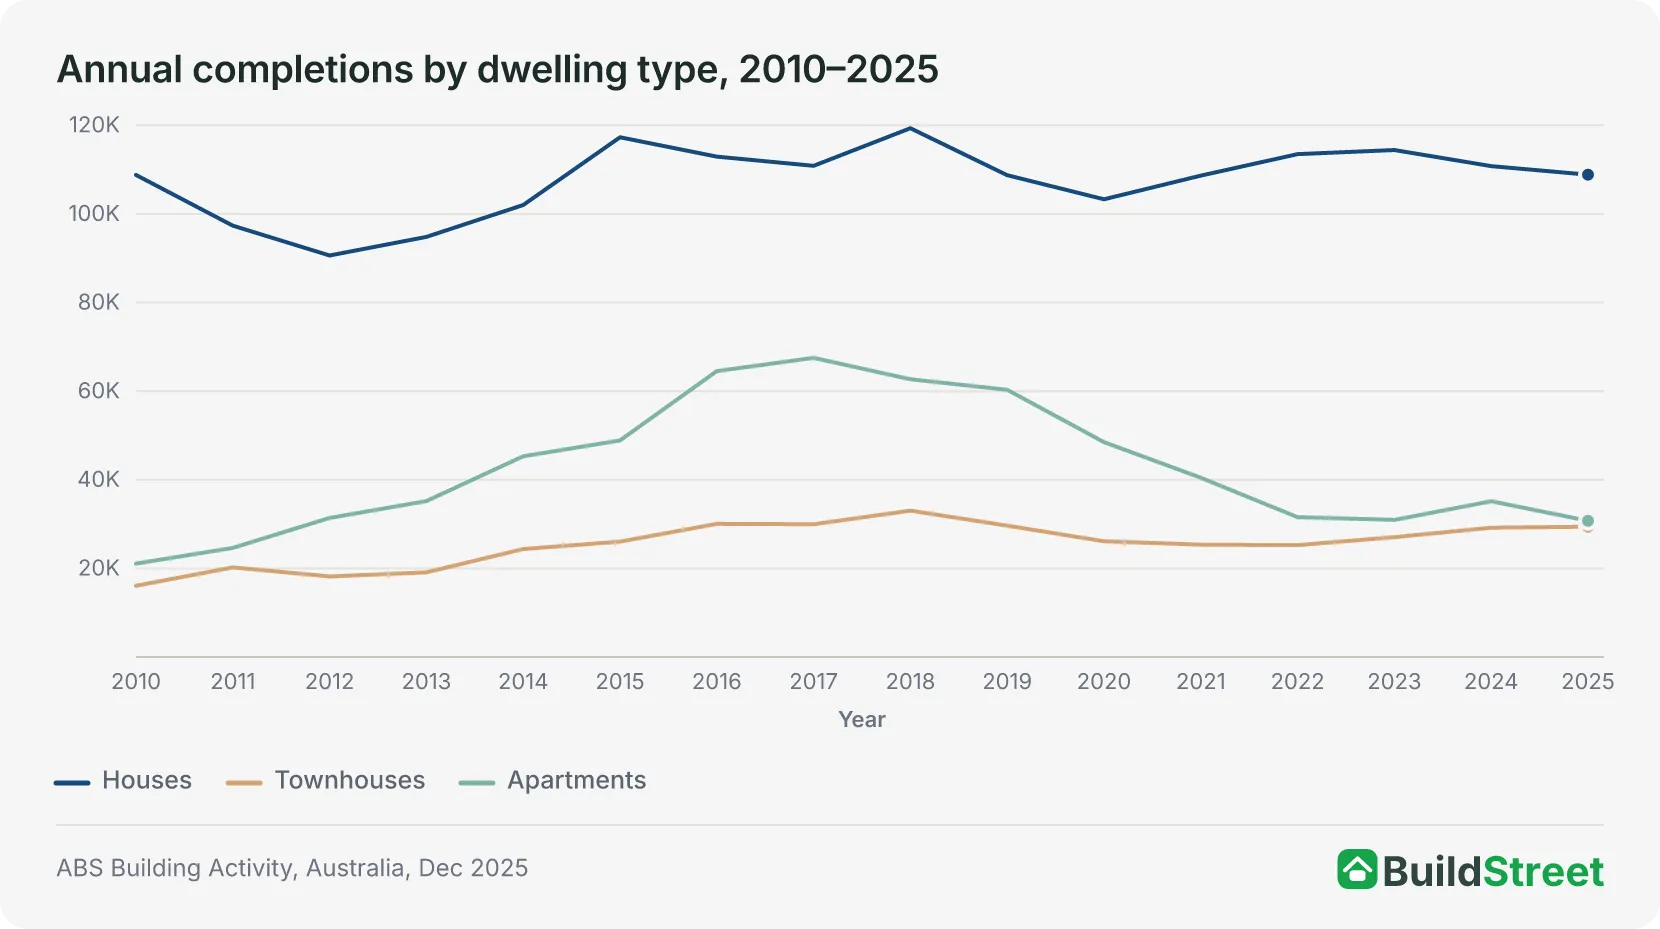
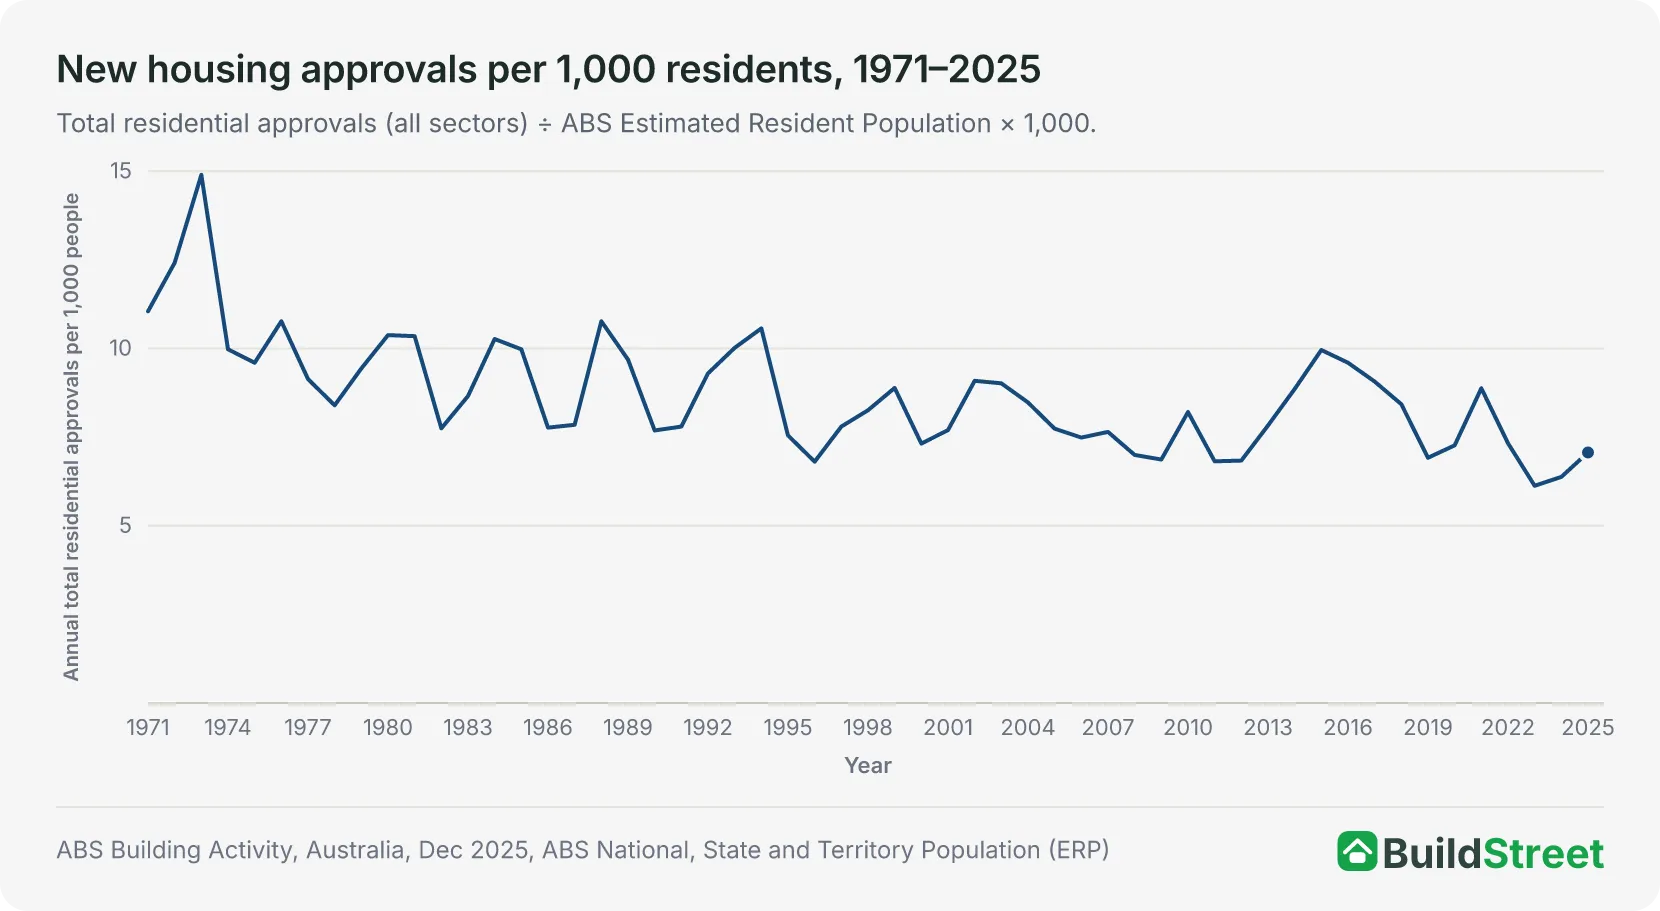
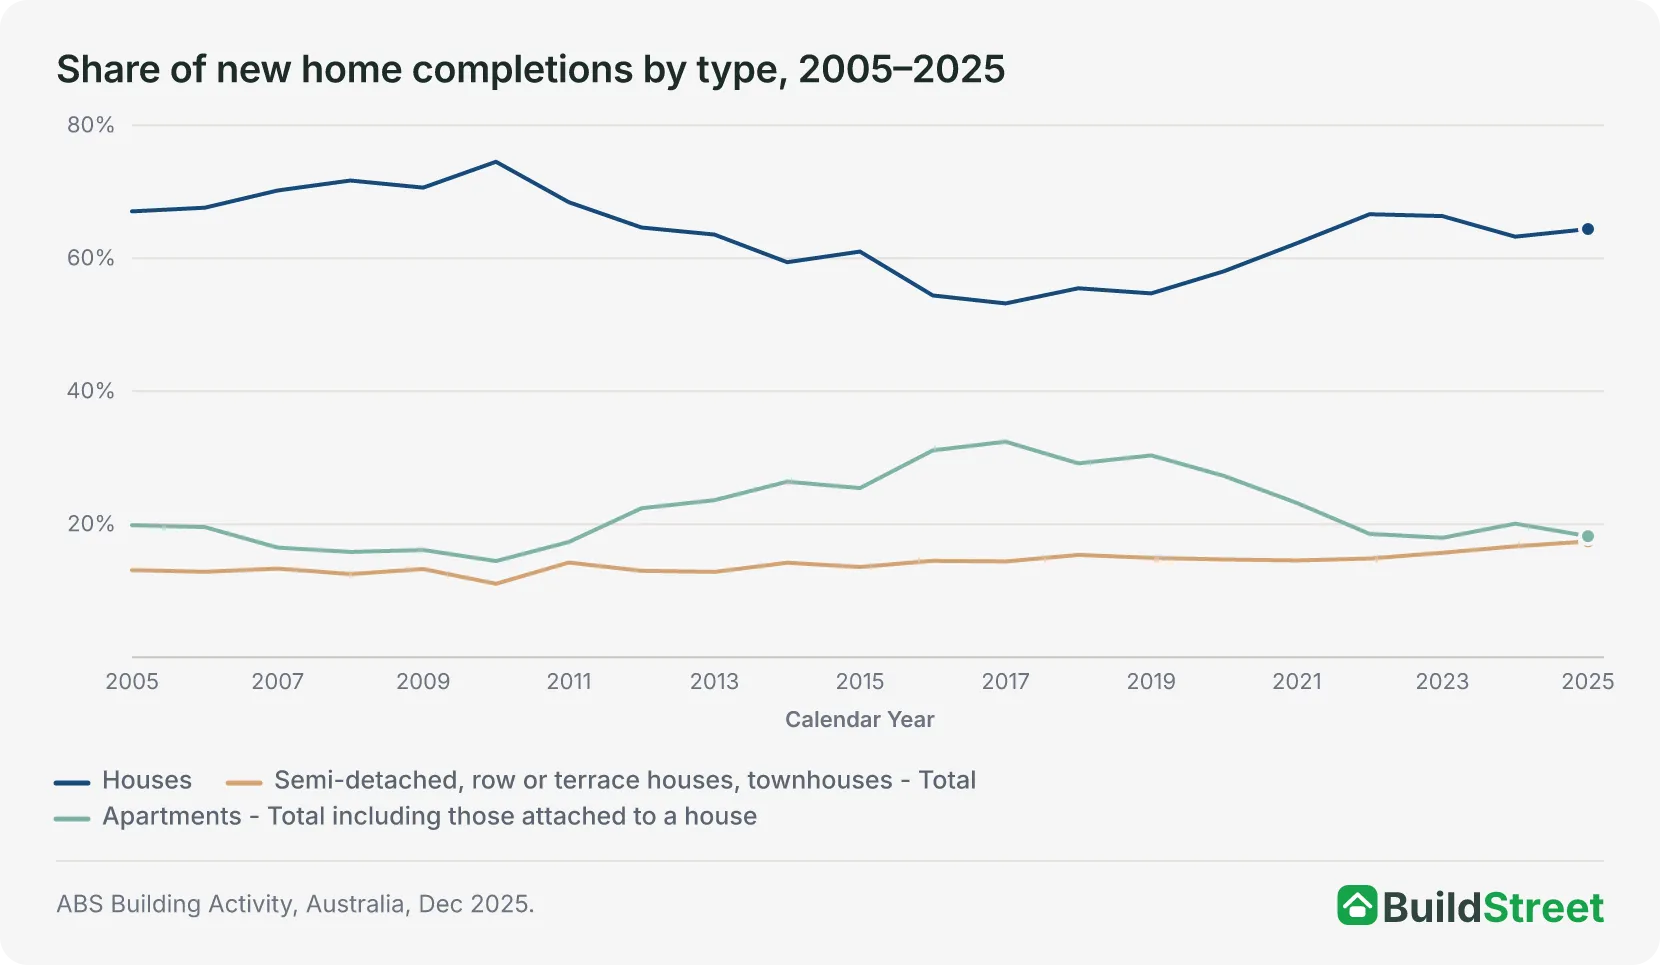
Detached houses now dominate new housing completions, making up 64% of the total, while apartments have fallen to just 18%, little more than half their 2017 peak share. Measured against population growth, Australia is building homes at close to its slowest rate in 50 years.
 Is Australia on track to build 1.2 million homes by June 2029?Australia has completed 307,635 homes in the first seven quarters of the National Housing Accord, leaving the country 112,365 homes behind the pace needed to reach 1.2 million by June 2029. Australia…
 The states with the fastest and slowest home build times in AustraliaBuilding a new home in Australia involves two key waiting periods: approval to commencement (the time from receiving planning approval to breaking ground), and commencement to completion (the time fro…
Section 01
Dwelling completions in Australia, 2010–2025: boom, bust and gradual recovery
Two distinct cycles have shaped Australia's housing output since 2010:
- 2010–2018 boom: Completions climbed from 146,007 to a record 215,1031, driven by high-rise apartment construction in Sydney and Melbourne.
- 2019–2022 retreat: As the apartment pipeline dried up, completions fell to 170,358, a drop of more than 44,000 from peak.
- 2023–2025 recovery: Output has stabilised around 169,000–175,000, with house completions holding steady while apartments remain subdued.
Show full table
| Calendar Year | Total Residential (a) |
|---|---|
| 2,005 | 158,314 |
| 2,006 | 141,613 |
| 2,007 | 148,157 |
| 2,008 | 141,663 |
| 2,009 | 142,859 |
| 2,010 | 146,007 |
| 2,011 | 142,254 |
| 2,012 | 140,240 |
| 2,013 | 149,170 |
| 2,014 | 171,729 |
| 2,015 | 192,267 |
| 2,016 | 207,558 |
| 2,017 | 208,375 |
| 2,018 | 215,103 |
| 2,019 | 198,729 |
| 2,020 | 177,966 |
| 2,021 | 174,514 |
| 2,022 | 170,358 |
| 2,023 | 172,456 |
| 2,024 | 175,167 |
| 2,025 | 169,057 |
Section 02
Houses, townhouses and apartments: how Australia's building mix has shifted
The composition of new housing has shifted significantly since the mid-2000s. Detached houses now make up 64% of completions, up from a low of 53% in 2017 when the apartment boom was at its height. That surge peaked at 67,529 apartment units in 2017 and has since collapsed, with just 30,761 completed in 2025.
Show full table
| Calendar Year | Houses | Townhouses | Apartments |
|---|---|---|---|
| 2,005 | 106,160 | 20,717 | 31,432 |
| 2,006 | 95,739 | 18,170 | 27,704 |
| 2,007 | 104,007 | 19,739 | 24,411 |
| 2,008 | 101,571 | 17,687 | 22,407 |
| 2,009 | 100,908 | 18,924 | 23,026 |
| 2,010 | 108,805 | 16,100 | 21,102 |
| 2,011 | 97,364 | 20,246 | 24,643 |
| 2,012 | 90,632 | 18,199 | 31,408 |
| 2,013 | 94,828 | 19,130 | 35,212 |
| 2,014 | 102,018 | 24,390 | 45,321 |
| 2,015 | 117,305 | 26,063 | 48,898 |
| 2,016 | 112,941 | 30,073 | 64,545 |
| 2,017 | 110,866 | 29,982 | 67,529 |
| 2,018 | 119,351 | 33,053 | 62,699 |
| 2,019 | 108,749 | 29,661 | 60,319 |
| 2,020 | 103,317 | 26,139 | 48,510 |
| 2,021 | 108,656 | 25,376 | 40,484 |
| 2,022 | 113,503 | 25,270 | 31,585 |
| 2,023 | 114,428 | 27,068 | 30,962 |
| 2,024 | 110,792 | 29,203 | 35,173 |
| 2,025 | 108,868 | 29,429 | 30,761 |
Section 03
Pre-COVID, peak and today: how dwelling completions compare by type
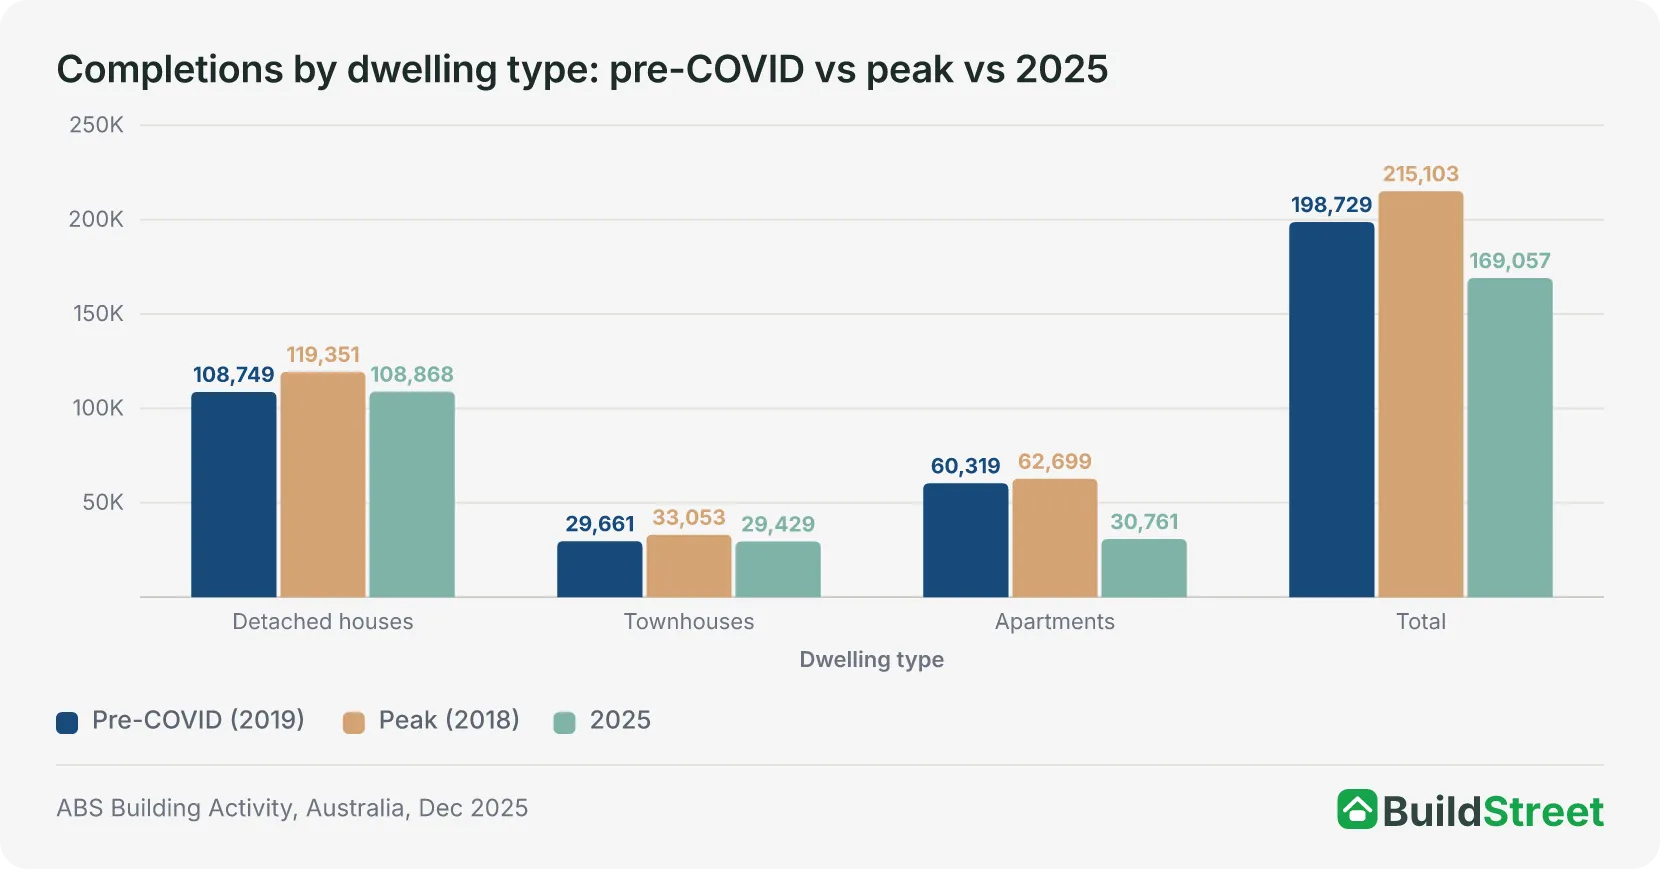
The apartment sector tells the starkest story. From 60,319 completions in 2019, apartments have fallen nearly 49% to just 30,761 in 2025, driven by soaring construction costs, tighter developer finance, and a pipeline that never recovered post-COVID. By contrast, detached house and townhouse completions are virtually unchanged from pre-COVID levels, each within 1% of 2019.
Section 04
Which states are completing the most new houses and dwellings?
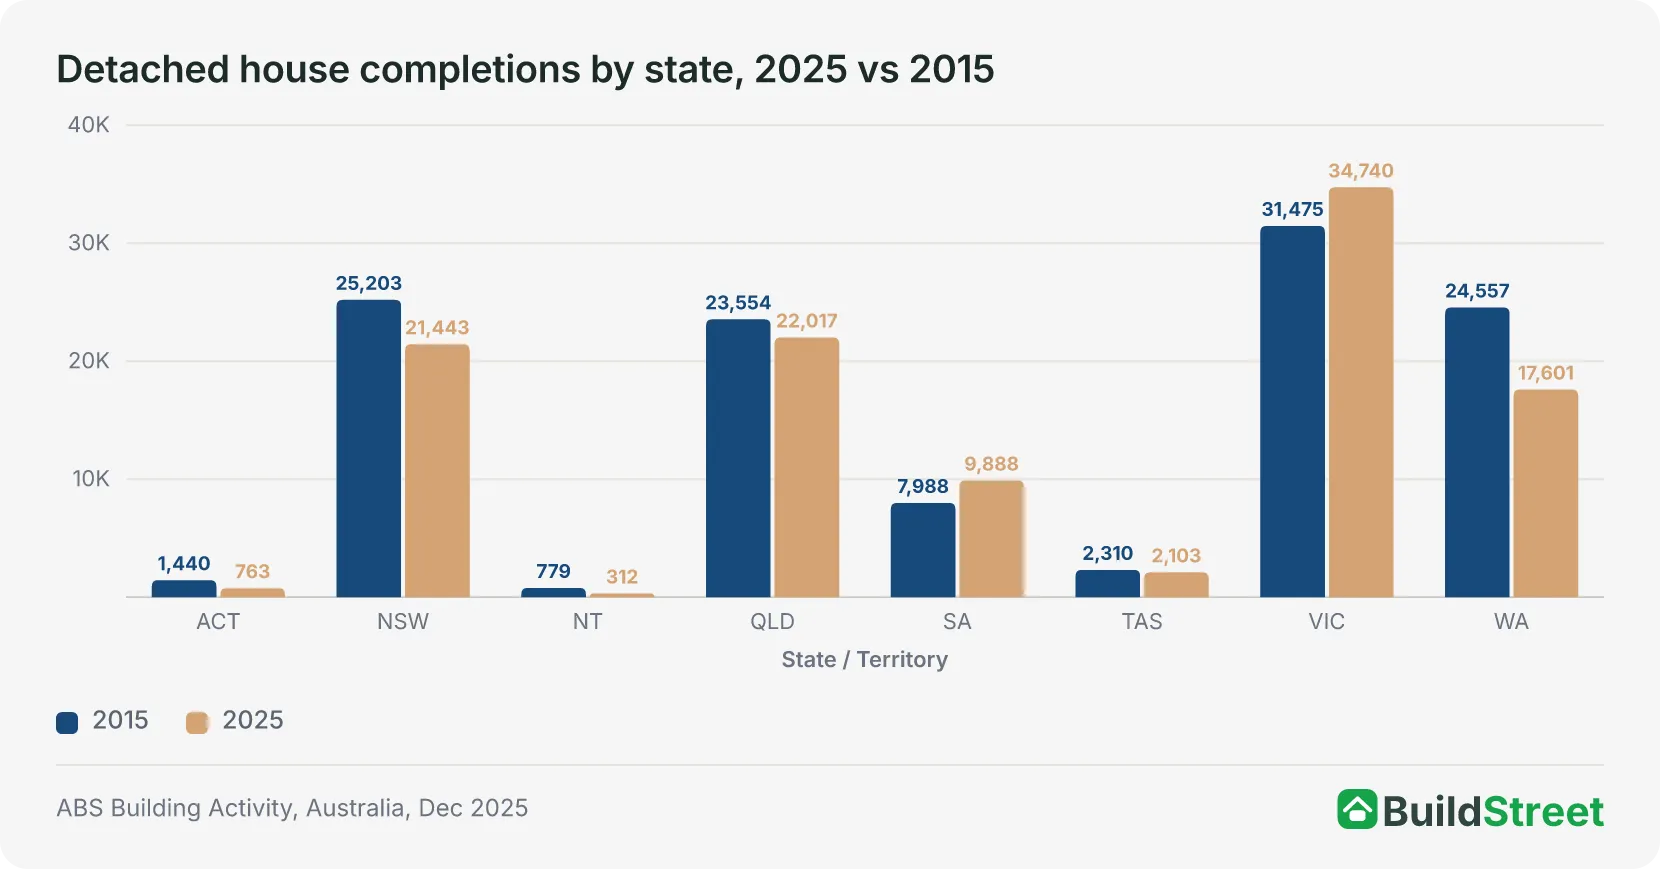
Victoria leads with 34,740 detached house completions in 2025, ahead of Queensland (22,017) and New South Wales (21,443)1. The two states to record meaningful growth since 2015:
Western Australia has recovered strongly, rising from 10,281 in 2020 to 17,601 in 2025, but remains 28.3% below its 2015 peak1. The ACT (−47.0%) and NT (−59.9%) have seen the steepest falls.
Show full table
| Calendar Year | Detached Houses | Townhouses | Apartments |
|---|---|---|---|
| Pre Covid 2019 | 108,749 | 29,661 | 60,319 |
| Peak | 119,351 | 33,053 | 62,699 |
| 2025 | 108,868 | 29,429 | 30,761 |
Section 05
Australia's housing output per person is near a 50-year low
Adjusted for population, Australia's housing output is weaker than headline numbers suggest. The country approved 14.9 new homes per 1,0003 residents at the 1973 postwar peak. By 2023, that had fallen to just 6.13, the lowest on record. The 2025 reading of 7.10 is a step forward, but the trend is one of declining per-capita supply against a rapidly growing population.
Show full table
| Year | Total residential approvals | Population | Annual total residential approvals per 1,000 people |
|---|---|---|---|
| 1,971 | 144,405 | 13,067,265 | 11.05 |
| 1,972 | 165,200 | 13,303,664 | 12.42 |
| 1,973 | 201,158 | 13,504,538 | 14.9 |
| 1,974 | 137,012 | 13,722,571 | 9.98 |
| 1,975 | 133,356 | 13,892,995 | 9.6 |
| 1,976 | 151,104 | 14,033,083 | 10.77 |
| 1,977 | 129,714 | 14,192,234 | 9.14 |
| 1,978 | 120,644 | 14,359,255 | 8.4 |
| 1,979 | 137,138 | 14,515,729 | 9.45 |
| 1,980 | 152,519 | 14,695,356 | 10.38 |
| 1,981 | 154,382 | 14,923,260 | 10.35 |
| 1,982 | 117,630 | 15,184,247 | 7.75 |
| 1,983 | 133,308 | 15,393,472 | 8.66 |
| 1,984 | 159,956 | 15,579,391 | 10.27 |
| 1,985 | 157,616 | 15,788,312 | 9.98 |
| 1,986 | 124,402 | 16,018,350 | 7.77 |
| 1,987 | 127,696 | 16,263,874 | 7.85 |
| 1,988 | 178,006 | 16,532,164 | 10.77 |
| 1,989 | 162,852 | 16,814,416 | 9.69 |
| 1,990 | 131,267 | 17,065,128 | 7.69 |
| 1,991 | 134,814 | 17,284,036 | 7.8 |
| 1,992 | 162,483 | 17,478,635 | 9.3 |
| 1,993 | 176,762 | 17,634,808 | 10.02 |
| 1,994 | 188,115 | 17,805,468 | 10.57 |
| 1,995 | 135,865 | 18,004,882 | 7.55 |
| 1,996 | 124,181 | 18,224,767 | 6.81 |
| 1,997 | 143,653 | 18,423,037 | 7.8 |
| 1,998 | 153,639 | 18,607,584 | 8.26 |
| 1,999 | 167,236 | 18,812,264 | 8.89 |
| 2,000 | 139,338 | 19,028,802 | 7.32 |
| 2,001 | 148,428 | 19,274,701 | 7.7 |
| 2,002 | 177,115 | 19,495,210 | 9.09 |
| 2,003 | 177,941 | 19,720,737 | 9.02 |
| 2,004 | 169,046 | 19,932,722 | 8.48 |
| 2,005 | 156,115 | 20,176,844 | 7.74 |
| 2,006 | 153,254 | 20,450,966 | 7.49 |
| 2,007 | 159,387 | 20,827,622 | 7.65 |
| 2,008 | 148,742 | 21,249,199 | 7 |
| 2,009 | 148,922 | 21,691,653 | 6.87 |
| 2,010 | 180,808 | 22,031,750 | 8.21 |
| 2,011 | 152,306 | 22,340,024 | 6.82 |
| 2,012 | 155,533 | 22,733,465 | 6.84 |
| 2,013 | 181,002 | 23,128,129 | 7.83 |
| 2,014 | 208,087 | 23,475,686 | 8.86 |
| 2,015 | 237,167 | 23,815,995 | 9.96 |
| 2,016 | 232,121 | 24,190,907 | 9.6 |
| 2,017 | 223,175 | 24,592,588 | 9.07 |
| 2,018 | 210,524 | 24,963,258 | 8.43 |
| 2,019 | 175,376 | 25,334,826 | 6.92 |
| 2,020 | 186,400 | 25,649,248 | 7.27 |
| 2,021 | 228,119 | 25,685,412 | 8.88 |
| 2,022 | 190,620 | 26,018,721 | 7.33 |
| 2,023 | 163,389 | 26,659,922 | 6.13 |
| 2,024 | 173,482 | 27,194,286 | 6.38 |
| 2,025 | 196,035 | 27,611,000 | 7.1 |
Section 06
Detached houses have regained share, but still less than in past decades
The apartment-driven surge of 2012–2018 pushed detached houses down to 53% of all completions at its lowest point. That share has recovered to 64% in 2025, close to mid-2000s levels, but the overall volume of homes being built remains insufficient. The key question is whether medium-density townhouse supply can fill the gap left by the collapse in apartments and the affordability ceiling now facing greenfield estates.
- 2010: before the apartment boom
- 74.5%
- detached house
- 2017: peak apartment era
- 32%
- apartments, highest ever
- 2025: current mix
- 64%
- houses · 17% towns · 18% apts
Section 07
How Australia's housing supply is tracking in 2026
The NHSAC Quarterly Report for March 2026 puts residential building approvals for the three months to January 2026 at roughly 48,5002 dwellings. Annualised, that works out to around 194,000 approvals per year, with quarterly approvals 17 per cent higher than when the National Housing Accord period began. To stay on pace with the National Housing Accord, Australia needs an average of 60,000 completed homes per quarter. Approvals are a leading indicator rather than a direct measure of progress against that completion target. At March 2026, NHSAC expected Australia to reach the target in June 2030, a year after the June 2029 deadline.
Build times for detached houses have continued to shorten. In 2024–25, the average from approval to completion fell to about 11.5 months, from 12.7 months in 2023–24. NHSAC described this as a 10 per cent improvement in construction times2. The shorter build times reduce the time between an approval and a completed home. Townhouses and terraces are also part of the higher-density housing pipeline, with several state planning initiatives aimed at increasing low- and mid-rise housing supply in existing suburbs.
Based on the current trajectory, the NHSAC March 2026 report suggests Australia will deliver somewhere between 900,000 and 950,000 new homes by June 2029, well short of 1.2 million2. The apartment sector is where the numbers diverge most sharply from what is needed: just 30,761 were completed in 2025 and the forward pipeline remains thin. Unless higher-density construction picks up significantly, the Accord target is out of reach.
References
- ABS Building Activity, Australia, March 2026 (Cat. 8752.0) · Australian Bureau of Statistics ↑ b c d e f
- NHSAC Quarterly Report, March 2026 · nhsac.gov.au ↑ b c d
- ABS, National, state and territory population (latest release) · Australian Bureau of Statistics ↑
