

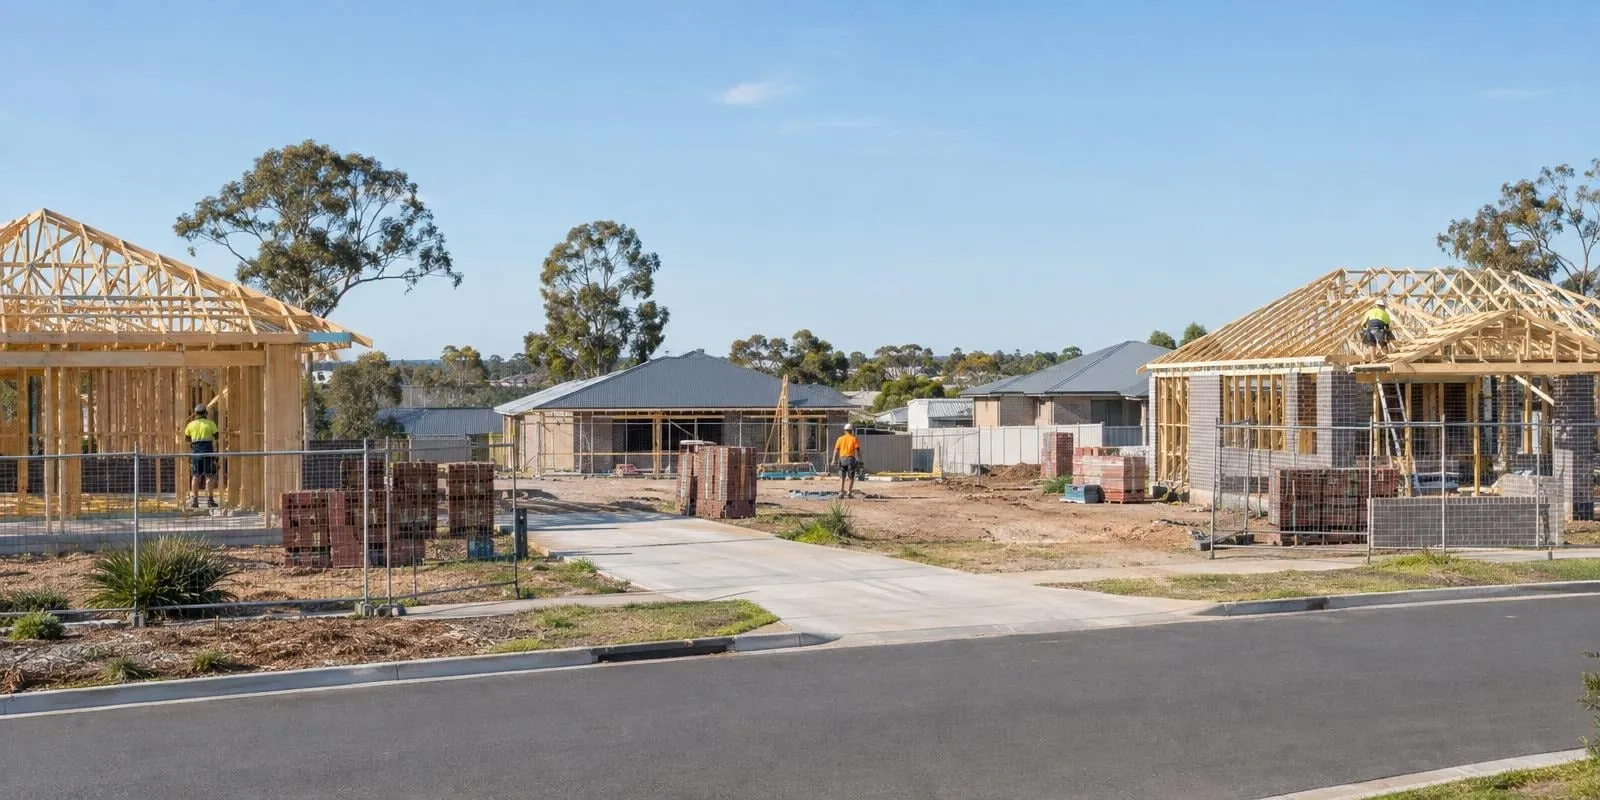
Published 22 Sept 2026
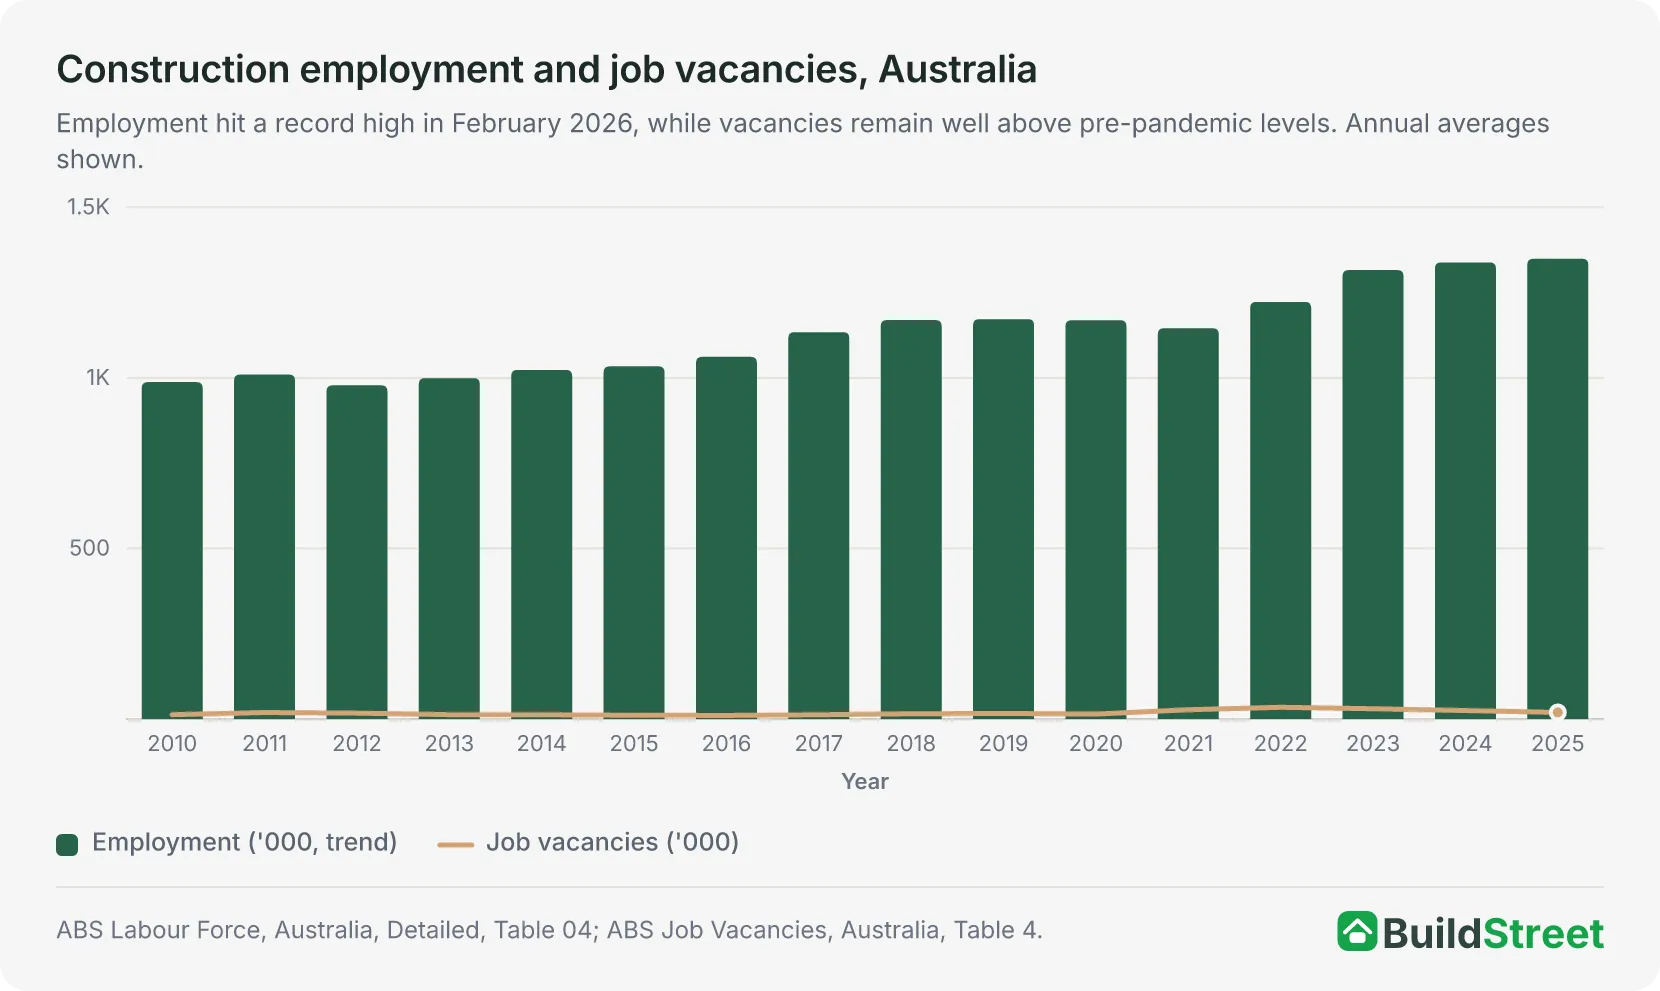
Australia's construction workforce has reached a record 1.37 million workers,1 but the sector is still short of the trades needed to keep up with housing demand. Core residential trades are in shortage across states and territories, while job vacancies remain above pre-pandemic levels.
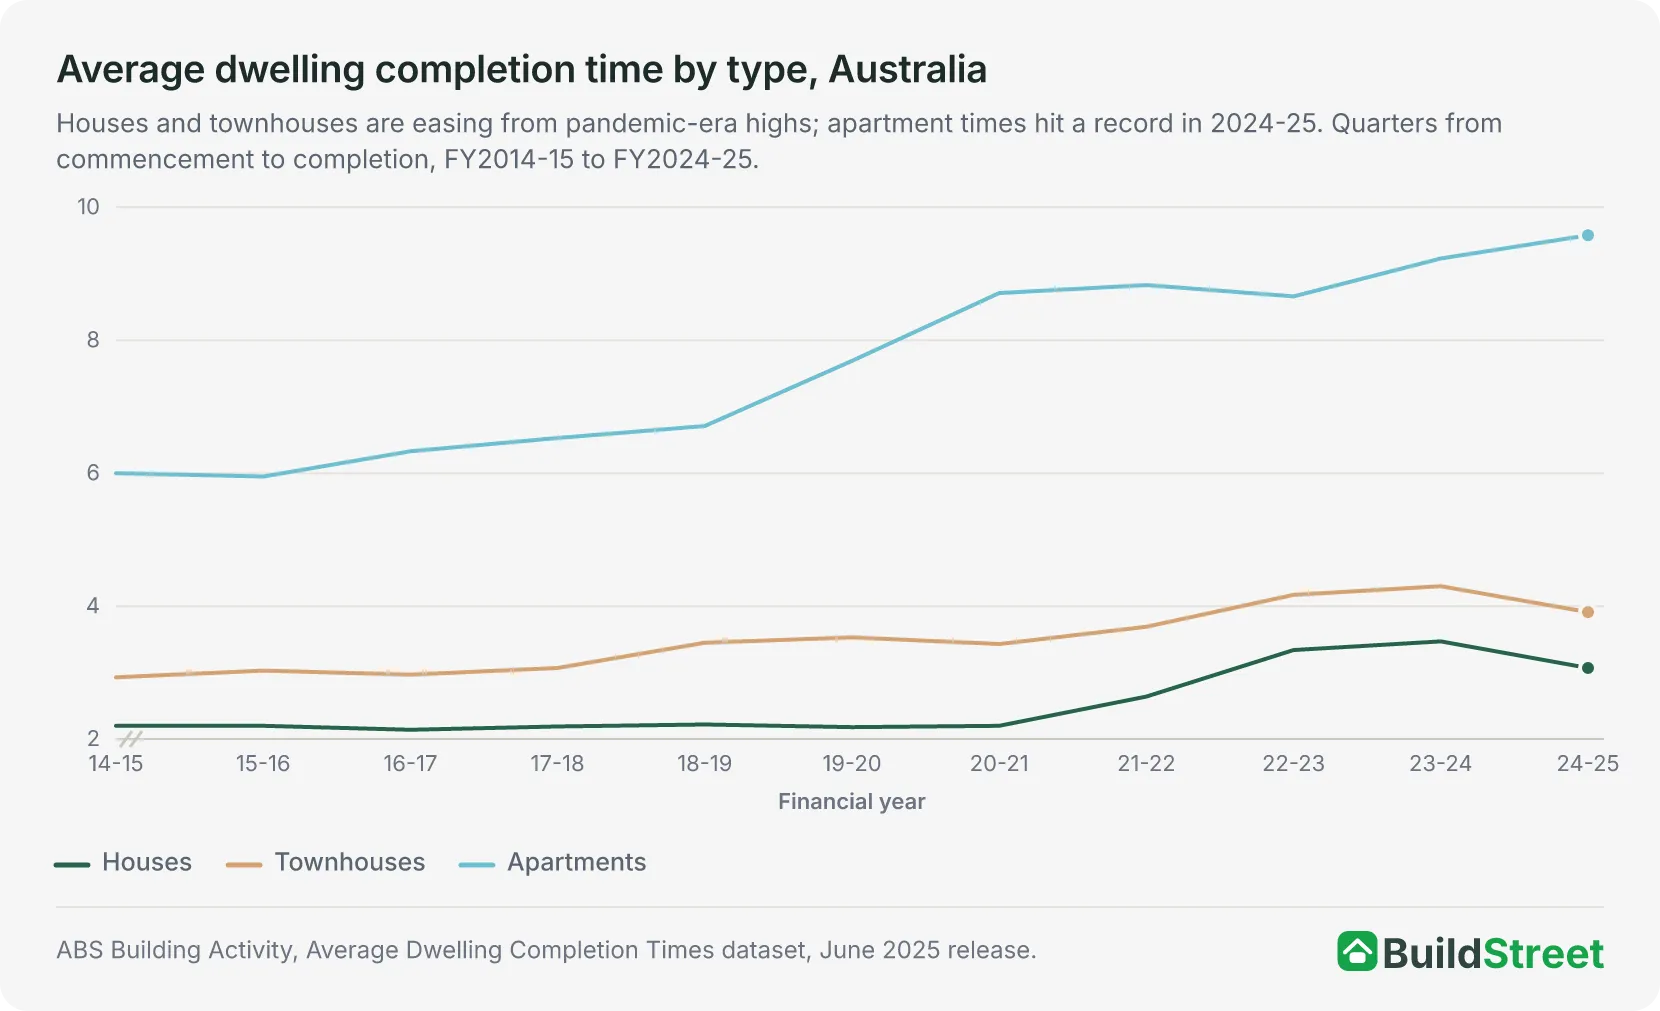
The strain is showing in the delivery numbers. House build times have risen from 2.18 quarters in 2019–20 to 3.07 quarters in 2024–25, apartment build times have reached a record 9.58 quarters, and construction costs are now 42% above their 2019 level.
 Is Australia on track to build 1.2 million homes by June 2029?Australia has completed 307,635 homes in the first seven quarters of the National Housing Accord, leaving the country 112,365 homes behind the pace needed to reach 1.2 million by June 2029. Australia…
 How long does it take to build a house in Australia?The average time from approval to handover is now about 11.5 months for a house, 14.8 months for a townhouse and almost 33 months for an apartment in Australia. While homes still take much longer to b…
Section 01 · Shortage overview
The state of Australia's construction workforce
The construction industry employed a record 1.37 million workers in February 20261, the latest industry estimate before the ABS paused its industry tables until October 2026, and still could not fill 19,900 job vacancies in May 20262. Even after falling 50% from the May 2022 peak, vacancies remain 20% above the 2019 annual average. The workforce has never been larger, and it is still not large enough.
Construction is classified as an industry under heightened shortage pressure. Nationally, 30% of all occupations were in shortage in 2025, down from 36% in 2023, and tradespeople and technicians account for 53% of the 123 occupations in continuous shortage since 20213.
Against that backdrop, 13 of 15 core residential trades remain in shortage across every state and territory.
Section 02 · Trades in shortage
Which construction trades are in shortage in Australia?
Of the 15 core residential building trades tracked nationally, 13 are in shortage across every state and territory. The exceptions are Building Associates, which is affected only in the Northern Territory, and Project Builder, which is affected only in Tasmania and the ACT. The shortage type differs by trade, and that distinction matters for how each gap can be closed.
The trades divide into three shortage types, each requiring a different response.
| Trade group | 2025 status | Jurisdiction breadth | Shortage driver | Employment |
|---|---|---|---|---|
| Carpenters and joiners | Shortage | All 8 jurisdictions | Retention gap | 149,600 |
| Electricians (general) | Shortage | All 8 jurisdictions | Suitability gap | 197,300 |
| Plumbers (general) | Shortage | All 8 jurisdictions | Long training gap | 53,400 |
| Bricklayers and stonemasons | Shortage | All 8 jurisdictions | Suitability gap | 25,464 (unit group) |
| Plasterers and renderers | Shortage | All 8 jurisdictions | Suitability gap | Not specified |
| Wall and floor tilers | Shortage | All 8 jurisdictions | Suitability gap | Not specified |
| Painters | Shortage | All 8 jurisdictions | Retention gap | Not specified |
| Roof tilers | Shortage | All 8 jurisdictions | Not separately identified | 9,400 |
| Construction project managers | Shortage | All 8 jurisdictions | Suitability gap | 134,300 |
| Building associates | Not short | NT only | Not specified | Not specified |
Source · Jobs and Skills Australia 2025 Occupation Shortage List (six-digit download); JSA 2025 Occupation Shortage Drivers tables; JSA occupation profiles.
Carpenters and joiners
With 149,600 employed nationally and median weekly earnings of $1,539, carpenters and joiners are one of the largest shortage groups in the country. The shortage is classified as a retention gap. The problem is not just that too few people enter the trade, but that too many leave it. NSW accounts for 32.3% of the workforce, Victoria 29.9%, and Queensland 19.2%.
Electricians
Electricians are both the largest and highest-paid of the shortage trades, with 197,300 employed on median weekly earnings of $2,000. The shortage is classified as a suitability gap. There are applicants, but employers report that candidates frequently lack the specific experience, site readiness, or capability that roles require.
Plumbers
Plumbing is a long training gap shortage. The category applies where there are too few qualified applicants and the qualification pathway is long, typically a Certificate III or above, taking three to four years. This means even a significant lift in apprenticeship starts today will not relieve the shortage quickly. The broader plumber unit group employs 103,675 workers across all plumbing subcategories.
Bricklayers and stonemasons
Bricklaying employs around 25,464 workers nationally, smaller than carpentry or electrical, but critical to the sequence of a build. Without completed brickwork, trades that follow cannot begin work. This is classified as a suitability gap shortage, which is in shortage nationally and across all jurisdictions.
Plasterers, tilers, painters, and roofers
All finishing trades are in shortage across every state and territory. Plasterers, renderers, and wall and floor tilers are suitability gap shortages, and painters are a retention gap. Roof tilers employ around 9,400 workers nationally. That is a small enough workforce that even a modest lift in demand can create a bottleneck at the final stages of a build.
Construction managers and site supervisors
The management layer is also under pressure. Construction project managers are in shortage nationally and in all jurisdictions, with 134,300 employed and median weekly earnings of $2,928. The broader construction managers unit group is classified as a suitability gap shortage. The building associate category is not nationally short, though it is in shortage in the Northern Territory.
The three causes behind construction trade shortages
Construction labour shortages have three distinct causes, and each requires a different response. A long training gap means too few people are moving through the qualification pipeline. A suitability gap means candidates exist but lack the job-readiness employers need. A retention gap means workers are leaving faster than they can be replaced.
Long training gap: plumbers
Too few qualified applicants per vacancy, and the qualification pathway takes years. Even large increases in apprenticeship starts cannot close this gap quickly. The pipeline needs to grow and keep flowing.
Suitability gap: electricians, construction managers, plasterers, bricklayers, tilers
There may be enough nominally qualified people, but employers cannot fill roles because candidates lack the specific experience, site readiness, or job-readiness required. More supply alone does not solve a suitability gap. The match between training outcomes and employer expectations needs to improve.
Retention gap: carpenters and joiners, painters
People are entering these trades but not staying. Retention shortages are linked to working conditions, pay, culture, and access barriers. Attracting more entrants does not fix a retention problem if the conditions that drove the previous cohort out remain unchanged.
Housing construction also competes with a large public infrastructure pipeline for the same workers. Infrastructure Australia forecasts $1.14 trillion of construction activity nationally over the five years to 2028-29, including a $242 billion five-year public infrastructure pipeline4. Housing and infrastructure are drawing from the same constrained workforce through to at least 2029.
Section 03 · State breakdown
Construction trade shortages: a state-by-state breakdown
The Northern Territory has the broadest shortage profile, with 19 of 19 tracked trades affected, followed by Western Australia at 18 of 19. NSW, Victoria, and Queensland each recorded 17 of 19 in shortage, with Tasmania and the ACT at 16 of 19.
The practical workforce gap is largest in NSW, Victoria, and Queensland, which account for 81.4% of all carpenters and joiners and 80.3% of all construction project managers nationally. The shortage is widest in NT and WA by count, but the scale of unmet demand is greatest where most new housing needs to be built.
| Occupation shortage status by state and territory, 2025 | |||||||||
|---|---|---|---|---|---|---|---|---|---|
| Trade | NSW | VIC | QLD | SA | WA | TAS | ACT | NT | National |
| Carpenter and Joiner | S | S | S | S | S | S | S | S | S |
| Carpenter | S | S | S | S | S | S | S | S | S |
| Joiner | S | S | S | S | S | S | S | S | S |
| Bricklayer | S | S | S | S | S | S | S | S | S |
| Stonemason | S | S | S | S | S | S | S | S | S |
| Painter | S | S | S | S | S | S | S | S | S |
| Plasterer | S | S | S | S | S | S | S | S | S |
| Renderer | S | S | S | S | S | S | S | S | S |
| Roof Tiler | S | S | S | S | S | S | S | S | S |
| Wall and Floor Tiler | S | S | S | S | S | S | S | S | S |
| Plumber (General) | S | S | S | S | S | S | S | S | S |
| Electrician (General) | S | S | S | S | S | S | S | S | S |
| Construction Project Manager | S | S | S | S | S | S | S | S | S |
| Project Builder | NS | NS | NS | NS | NS | S | S | NS | NS |
| Building Associate | NS | NS | NS | NS | NS | NS | NS | S | NS |
Source · Jobs and Skills Australia 2025 Occupation Shortage List, six-digit download. Project Builder (shortage in TAS and ACT only) and Building Associate (shortage in NT only) are the two occupations in this selection that are not nationally short.
Section 04 · Build times
How labour shortages affect building times
When qualified tradespeople are hard to find, projects stall between stages, waiting for a framer, a plumber, an electrician, or a tiler to become available. Those delays compound across the build sequence.
Average house build times have eased to 3.07 quarters in 2024-25, down from the pandemic peak of 3.47 in 2023-245, but still about one full quarter longer than before the pandemic. Apartment build times moved in the opposite direction, reaching a record 9.58 quarters in 2024-25.
Section 05 · Building costs
How labour shortages affect building costs
House construction input costs are 42% above their 2019 level, with the input price index at 167.8 in June 20266. Annual cost growth has eased sharply from a peak of 17.3% in mid-2022, although it picked up to 3.8% by June 2026 on higher material, freight and fuel costs, and the industry is operating on a structurally higher cost base than before the pandemic.
The worst of the cost surge has clearly passed. Annual growth in input prices peaked at 17.3% in June quarter 2022 and had eased to 2.5% by March 2026, before edging back up to 3.8% in June 2026 as material, freight and fuel costs rose. With the index at 167.8, input costs are now 42% above their 2019 level.
Labour shortages were one contributor to this increase, alongside materials costs, supply chain disruption, energy costs, and elevated demand. A persistent inability to staff projects at scale added to the pressure during the peak period.
Section 06 · Housing targets
Labour demand from the 1.2 million homes target
Australia commenced 45,342 dwellings in March quarter 20267, equal to 75.6% of the 60,000-per-quarter pace required to hit the 1.2 million homes target by June 2029.
At the current rate, the five-year total would reach roughly 900,000 homes, about 300,000 short of the target. Building approvals of 17,687 in July 20268 suggest the pipeline is not yet accelerating fast enough to close that gap.
To meet combined housing and infrastructure demand, the construction labour force needs to grow by around 300,000 workers over five years, roughly 60,000 a year. At current commencement rates, that growth is not happening.
Section 07 · Apprenticeships
Construction apprenticeships: growth, gaps, and the pipeline ahead
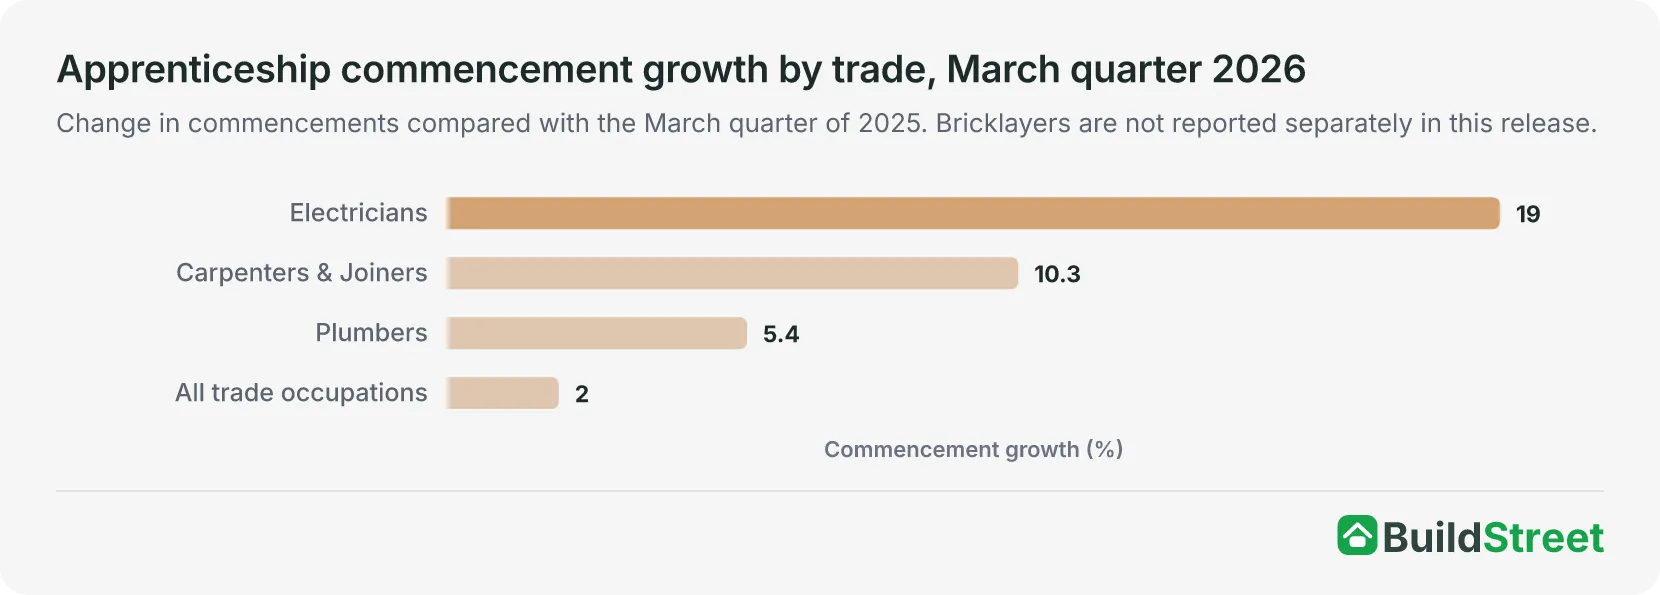
Apprenticeship numbers are still shrinking overall, with 289,090 active apprentices and trainees recorded at 31 March 2026, down 9.0% on a year earlier9, but trade commencements have begun to turn up. Growth in the March quarter 2026 was led by electrician starts, up 19.0%, and carpenter and joiner starts, up 10.3%, on the same quarter of 2025. But completions lag starts by three to four years, meaning today's new entrants will not ease today's shortage until 2029-30 at the earliest.
In the 12 months to March 2026, trade commencements fell 1.1% to 77,550, the fourth consecutive annual decline, while trade completions rose 9.9% to a record 55,570. The March quarter 2026 brought growth in several of the trades under the most acute pressure, compared with the same quarter of 2025:
- +19.0% Electrician commencements, a record high for the quarter
- +10.3% Carpenter and joiner commencements
- +5.4% Plumber commencements
- +2.0% Trade commencements overall
These are modest but real increases after several years of decline. Completions are what actually relieve the shortage, and completions lag starts by three to four years.
Section 08 · Migration
Skilled migration in filling construction trade gaps
Employer-sponsored visa pathways give construction businesses a route to recruit experienced workers from overseas when domestic candidates are unavailable.
In 2024-25, 5,510 primary visa grants were made to construction industry sponsors, a 30.9% increase from 4,210 in 2023-24.
Migration is helping at the margin, particularly for experienced and specialised roles, but the scale is modest against a workforce of 1.37 million1 and a required growth of 300,000 over five years.
Key trades, including Carpenter, Carpenter and Joiner, Electrician (General), and Plumber (General) are on the skilled occupation list for employer-sponsored pathways, including the 482 and 186 visas. Migration is most effective at filling specific gaps where domestic pipelines are slowest to respond. It supplements domestic training and retention efforts; it cannot replace either at current volumes.
Section 09 · Solutions
What can help reduce construction labour shortages?
No single policy closes the gap across the whole sector because the shortage has three main causes. Effective responses differ by trade type, with plumbing needing more completions, electrical and management roles needing better training-to-work pathways, and carpentry and painting needing improved working conditions.
For long-training-gap trades: lift completions, not just starts
For plumbing specifically, more apprenticeship commencements are necessary but not sufficient. What relieves the shortage is qualified workers completing their training and staying in the industry. Employer capacity to supervise and train, apprentice support programs, and training-to-employment transitions are the key levers.
For suitability-gap trades: improve experience pathways
For electricians, construction managers, plasterers, bricklayers, and tilers, the gap between training outcomes and what employers actually need is the problem. That requires stronger training-to-work transitions, more structured site experience, better pre-qualification assessment, and clearer alignment between what training delivers and what the industry requires.
For retention-gap trades: make the work sustainable
For carpenters and painters, attracting more entrants will not fix the problem if the conditions that drove previous workers out remain unchanged. Retention shortages are linked to pay, working conditions, culture, and access barriers. More stable pipelines of work, safer and better-managed sites, and more consistent employment are the relevant remedies.
Better coordination between housing and infrastructure pipelines would reduce direct competition for the same workers. Reform of the National Construction Code and greater use of modern construction methods would reduce pressure on scarce trades more broadly. Housing and major public infrastructure are in direct competition for the same workers through to at least 2029.
Section 10 · Buyer impacts
What construction labour shortages mean for homebuyers
With input costs still 42% above 2019 levels and average house build times more than 40% longer than before the pandemic, labour shortages now have direct practical effects for anyone building or buying a new home, from longer wait times and higher costs to greater contract and financing risk.
See what it costs to build a house in Australia and how long it takes for current data on what buyers are actually experiencing.
Builds may take longer
When trades are hard to schedule, projects stall between stages. Average house times are still about one full quarter longer than before the pandemic.
Labour costs are elevated
Input costs are 42% above their 2019 level. Quotes may carry higher labour and subcontractor rates than a few years ago, particularly for electrical, plumbing, and finishing trades.
Fixed-price contracts carry more risk
In a tight labour market, builders may have less flexibility to absorb cost overruns in fixed-price contracts. Some have included rise-and-fall clauses or price review mechanisms.
Delays affect loan timing and planning
Construction loans often have staged drawdown schedules tied to build milestones. Delays can affect interest periods, rental overlap costs, and moving plans if the handover timeline shifts significantly.
Apartments are affected differently
Apartment build times hit 9.58 quarters in 2024-25, a record, and have not yet started to ease. Buyers in the off-the-plan market face more timeline uncertainty than buyers of detached houses.
Builder selection matters more
A builder's relationships with subcontractors can affect scheduling reliability. A builder with strong trade relationships is more likely to maintain consistent site access and build pace.
References
- ABS Labour Force, Australia, Detailed, Table 04, February 2026 · Australian Bureau of Statistics ↑ b c
- ABS Job Vacancies, Australia, Table 4, May 2026 · Australian Bureau of Statistics ↑
- 2025 Occupation Shortage List — Key Findings Report · jobsandskills.gov.au ↑
- Infrastructure Australia 2025 Market Capacity Report · infrastructureaustralia.gov.au ↑
- ABS Building Activity, Australia — Average dwelling completion times (jun-2025) · Australian Bureau of Statistics ↑
- ABS Producer Price Indexes, Australia (Cat. 6427.0) — latest release · Australian Bureau of Statistics ↑
- ABS Building Activity, Australia, March 2026 — Table 33. Number of Dwelling Unit Commencements by Sector, Australia · Australian Bureau of Statistics ↑
- ABS Building Approvals, Australia (latest release, Cat. 8731.0) · Australian Bureau of Statistics ↑
- NCVER Apprentices and trainees 2026: March quarter · ncver.edu.au ↑
- ABS Job Vacancies, Australia, Table 4, February 2026 · Australian Bureau of Statistics
- Jobs and Skills Australia 2025 Occupation Shortage List · jobsandskills.gov.au
- ABS, Building Activity, Australia (latest release, Cat. 8752.0) · Australian Bureau of Statistics
- NCVER Apprentices and Trainees, September quarter 2024 · ncver.edu.au
- Department of Home Affairs: Temporary Resident (Skilled) Report, 30 June 2025 · immi.homeaffairs.gov.au
- NHSAC Quarterly Report, March 2026 · nhsac.gov.au
