

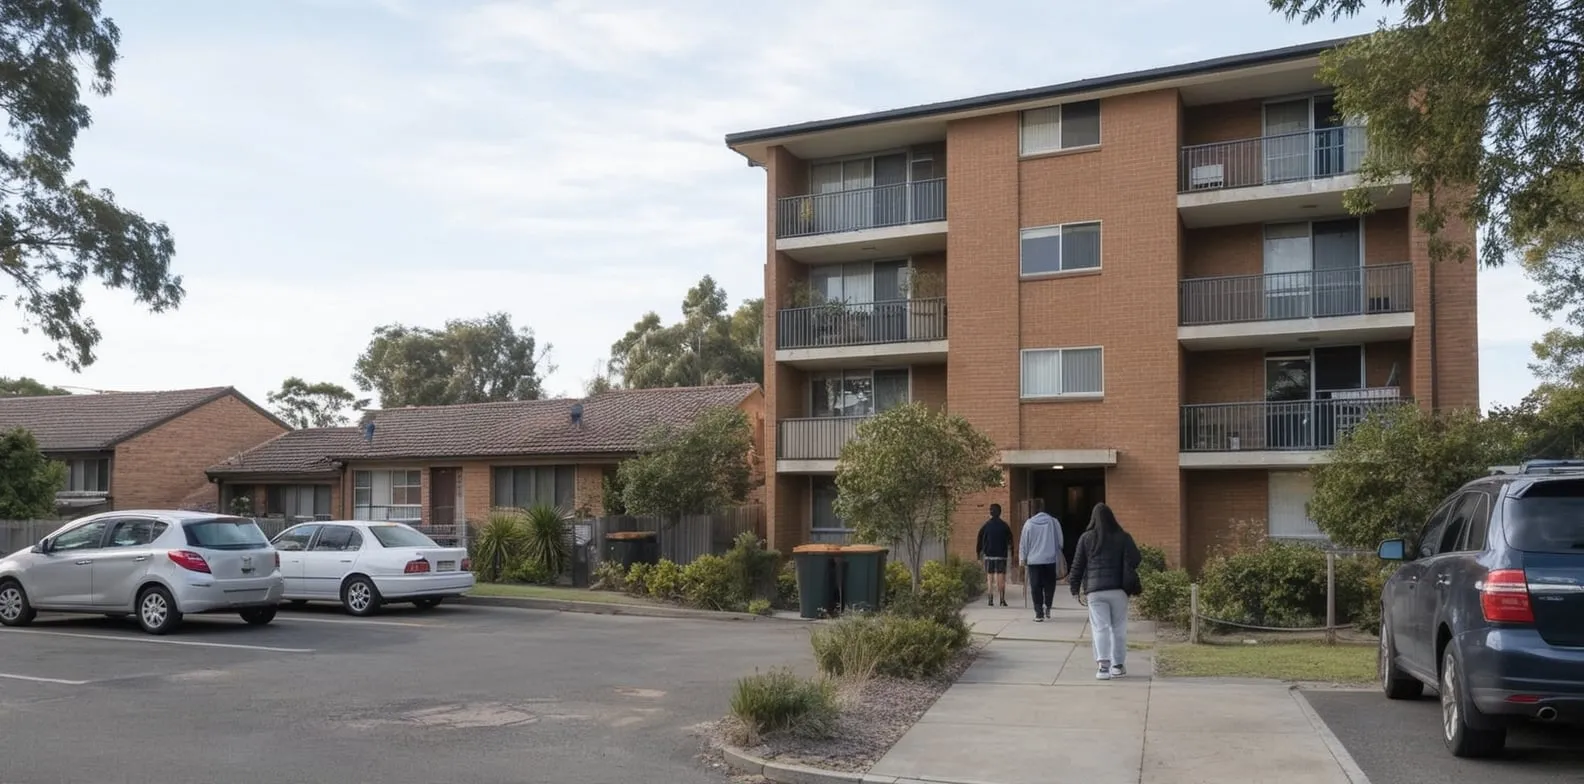
Published 24 June 2026
Australia's public housing waitlist reached 189,536 households at 30 June 2025, the highest level in the comparable series since 2014 and up 20,984 households, or 12.4%, from June 2024. Of those, 77,425 (40.8%) were classified as greatest need, meaning they were experiencing homelessness, were at risk of harm, or were living in housing that affected their health or safety. In 2024-25, 16,016 households were newly allocated public housing nationally.
No single national figure covers all social housing waitlists. Community housing waitlist data exist within state systems but are not published as a national aggregate. The public housing waitlist is the primary comparable national measure used throughout this article, with the SOMIH waitlist covered separately below.
 How many social and affordable homes are built in Australia each year?Australia had 450,607 social housing dwellings at 30 June 2025, spanning all four programme types: public housing, community housing, state-owned and managed Indigenous housing (SOMIH) and Indigenous…
 Social housing overcrowding in Australia: households and underutilised dwellingsPublic housing had an overcrowding rate of 4.3% at June 2025, while state-owned and managed Indigenous housing (SOMIH) had a rate of 22.9% and community housing had a rate of 3.5%. Indigenous communit…
Section 01 · Definition
What is a social housing waitlist in Australia?
A social housing waitlist is the register of applicants who have been assessed as eligible for housing assistance but have not yet been allocated a dwelling. At June 2025, the national public housing waitlist stood at 189,536 households. State and territory housing authorities manage these lists and assess applicants against local eligibility rules, covering income thresholds and housing need.
All jurisdictions use integrated waitlists, so a single application can cover both public and community housing. Because waitlist data are collected separately by programme, a household registered for more than one may appear in more than one count. This is why the figures are not published as a single combined national total. Consistent national data for public housing are available back to 2014.
What does "greatest need" mean in social housing?
Within the waitlist, a household is classified as greatest need if it meets one or more priority criteria. Priority access is given to these households, so they are generally allocated ahead of other applicants rather than solely according to time spent waiting.
- Homelessness: the household has no fixed accommodation or is living in accommodation not intended for long-term habitation.
- Life or safety at risk: the household's current accommodation places members at risk of harm from other people, including through domestic violence or other threats.
- Health condition aggravated by housing: a household member has a medical condition worsened by the current dwelling, such as severe damp, overcrowding, or lack of accessibility features.
- Inappropriate housing: the current accommodation is structurally inadequate, severely overcrowded, or otherwise unsuitable for the household's circumstances.
- Very high rental housing costs: the household is paying rental costs that are extremely high relative to income. From 2024-25, NSW, Victoria, and WA began applying this criterion more consistently after previously not collecting rental cost information from all applicants.
Are community housing waitlists included in the national figure?
At June 2025, community housing served 110,326 households nationally, but this figure counts households already housed, not households waiting for community housing.
Community housing waitlists exist, but they are not published as a single national total. In most states and territories, applicants register through an integrated system covering both public and community housing, so the two counts cannot simply be added together without risk of double-counting.
Section 02 · National total
How many households are on the public housing waitlist in Australia?
At 30 June 2025, 189,536 households were on the national public housing waitlist, a 12.4% increase from June 2024 and the highest total in the comparable series since 2014.
- Households on waitlist
- 189,536
- highest since 2014
- Greatest need households
- 77,425
- 40.8% of total
- Increase from June 2024
- +20,984
- New allocations in 2024-25
- 16,016
- waitlist is nearly 12x larger
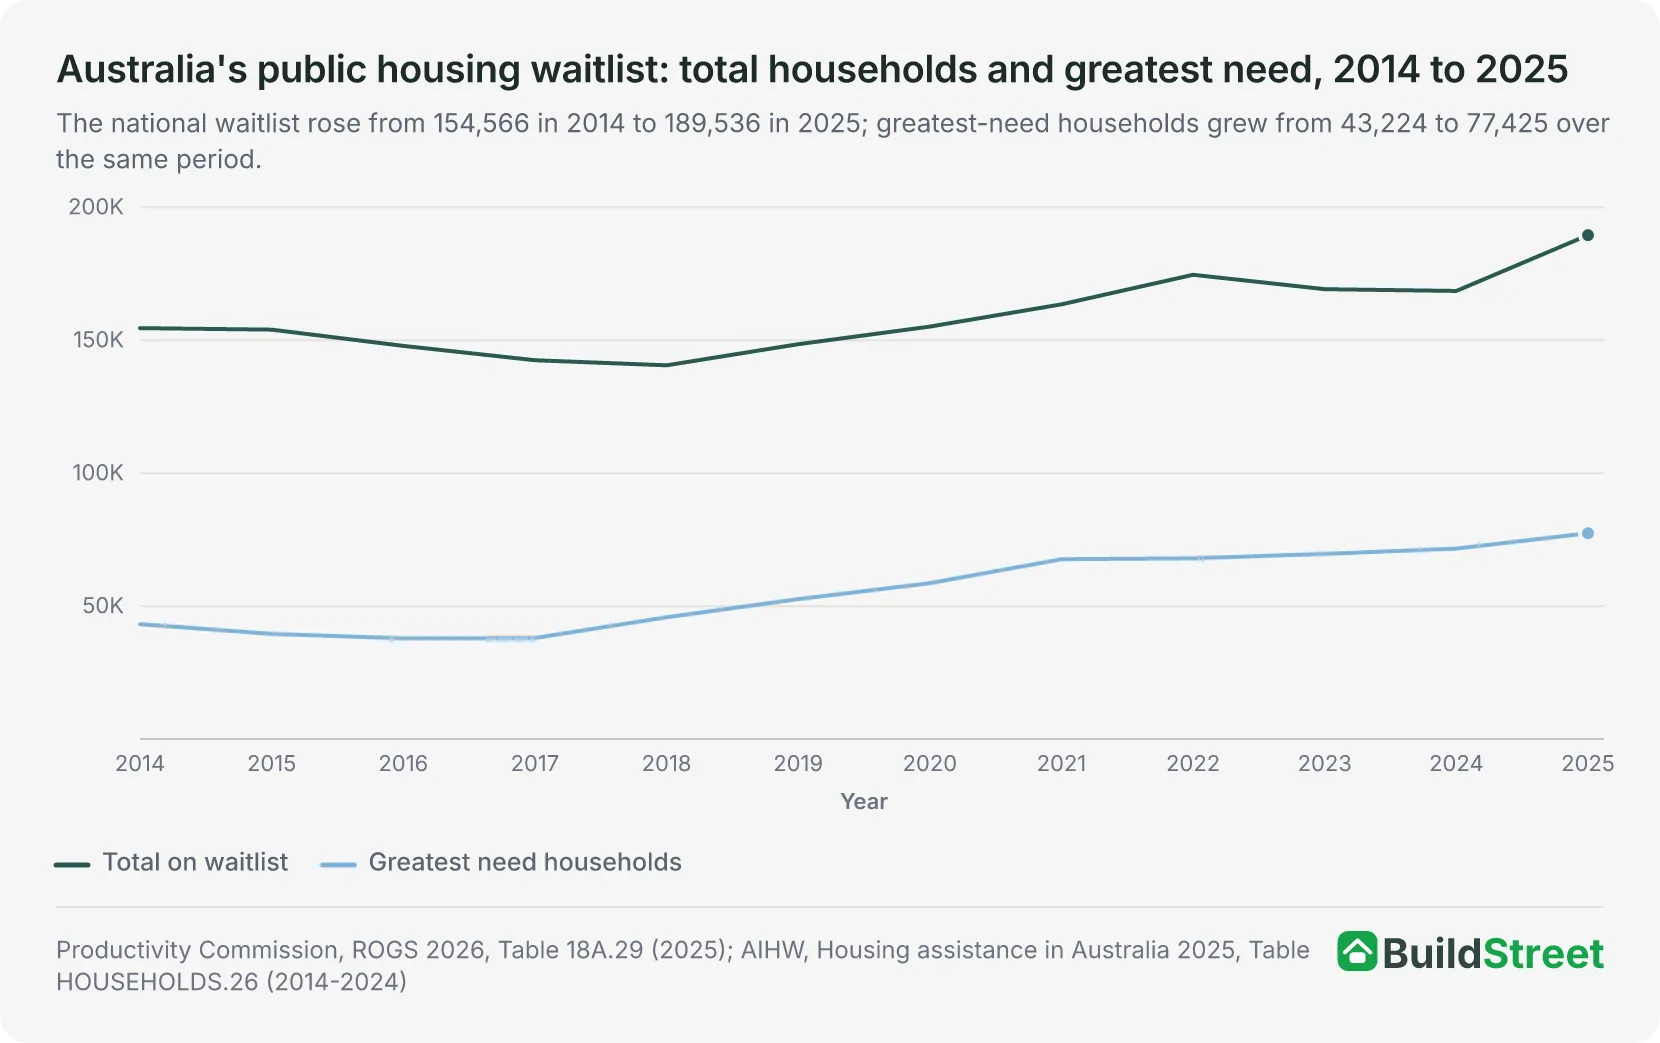
The 12.4% increase in 2024-25 is the largest single-year rise in the comparable series since 2014. The three largest state increases were New South Wales (+8,351), Queensland (+5,294), and Victoria (+4,850). Queensland's growth was almost entirely in the greatest-need category (+5,371); in NSW and Victoria, most of the total growth was among non-greatest-need applicants.
The greatest-need figures for NSW, Victoria, and WA are not directly comparable with earlier years. From 2024-25, those states began applying the very high rental housing costs criterion more consistently after previously not collecting rental cost information from all applicants. NSW greatest-need households increased by 1,845 and WA increased by 1,700, which may partly reflect the definitional change. Victoria's greatest-need count fell by 2,944 despite total waitlist growth of 4,850, a pattern the available data does not fully explain.
Looking further back, the national waitlist has grown steadily. It rose from 140,578 in 2018 to 189,536 in 2025, an increase of 48,958 households over seven years.
Waitlist versus annual allocations
| Measure | Figure | What it means |
|---|---|---|
| Public housing waitlist | 189,536 | Households waiting at 30 June 2025 |
| Greatest-need waitlist | 77,425 | Priority households waiting at 30 June 2025 |
| New allocations (2024-25) | 16,016 | Households newly housed in public housing |
| Greatest-need allocations (2024-25) | 13,471 | Priority households newly housed |
| Waitlist-to-allocation ratio | approx. 11.8x | Waitlist is nearly 12 times the annual allocation count |
Source · ROGS 2026, Table 18A.29.
State-owned and managed Indigenous housing waitlist
A separate waitlist exists for state-owned and managed Indigenous housing (SOMIH). At 30 June 2025, 17,478 households were on the SOMIH waitlist nationally, of which 9,178 (52.5%) were classified as greatest need. The SOMIH programme does not operate in Victoria, WA, or the ACT. Queensland accounts for 7,375 of the national total (42.2%), and New South Wales for 4,601 (26.3%).
The SOMIH greatest-need count has grown from 3,827 in 2014 to 9,178 in 2025, an increase of 139.8% since 2014. SOMIH and public housing waitlists are reported separately; applicants may appear on both lists, and the programmes have different eligibility criteria.
Section 03 · Greatest need
How many public housing households are classified as greatest need?
A total of 77,425 households were classified as greatest need at June 2025, representing 40.8% of the 189,536 households on the public housing waitlist. The greatest-need proportion has fluctuated between 25 and 43% since 2014. It peaked at 42.5% in 2024 before falling to 40.8% in 2025, as the non-greatest-need waitlist grew faster than the greatest-need component that year.
Greatest-need reason data covers newly allocated households only, not households still on the waitlist. Among the 14,496 public housing allocations classified as greatest need in 2023-24, homelessness was the primary reason in more than half of cases.
Homelessness and social housing demand overlap but are not the same thing. Some people experiencing homelessness are not on a waitlist; some waitlisted households are in stable, if unsuitable, housing. Homelessness service data and public housing waitlist figures count different populations and cannot be combined.
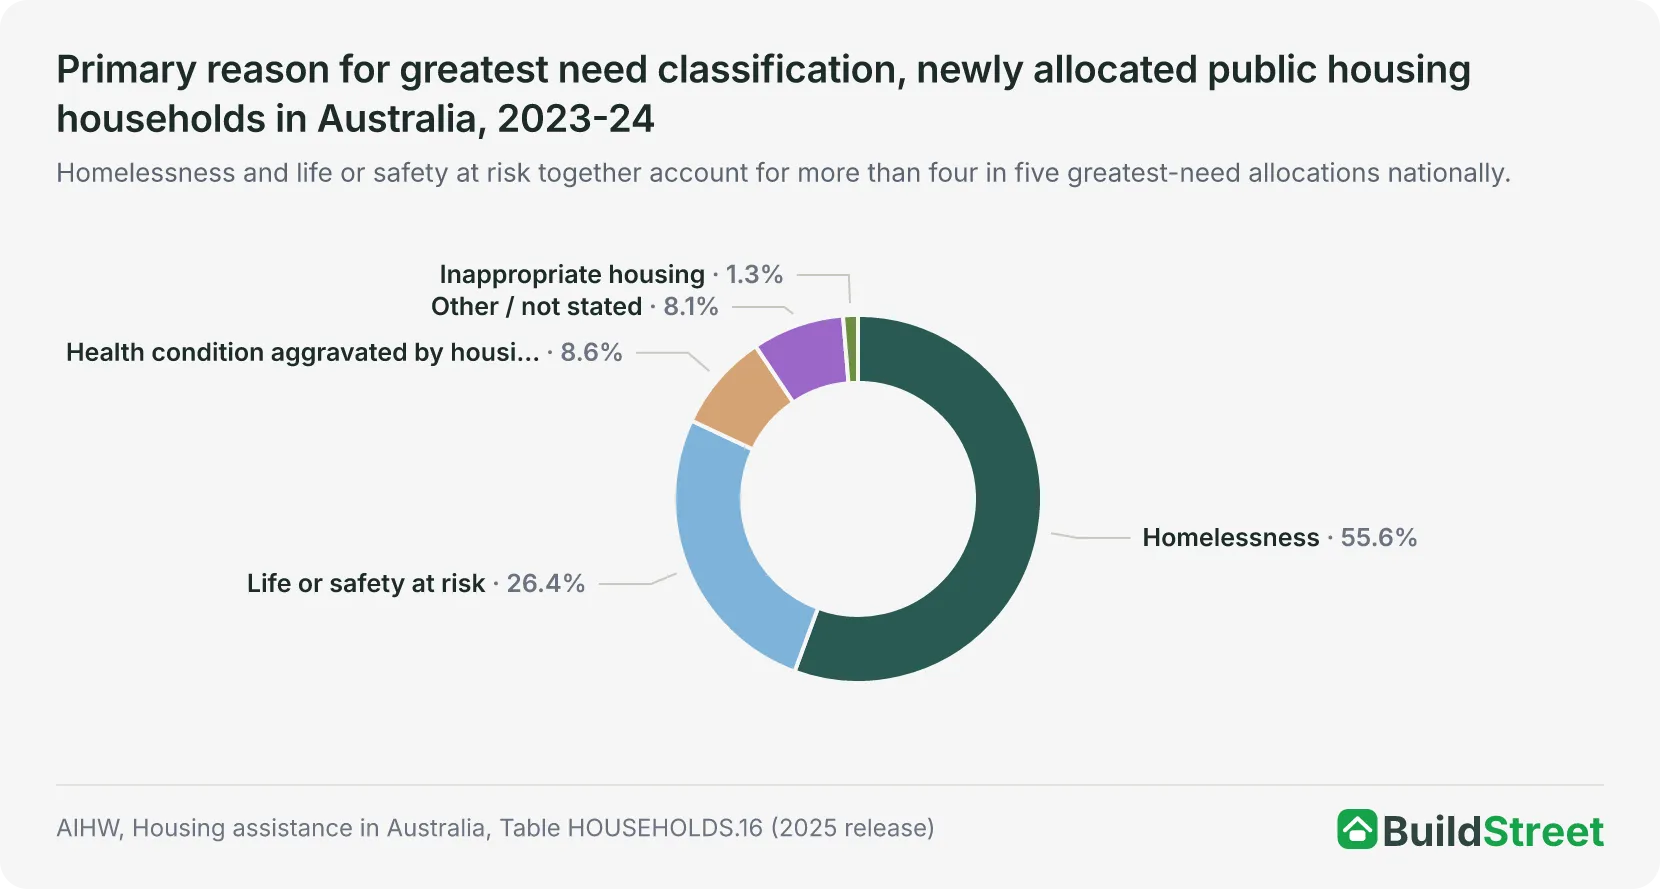
Homelessness accounted for 55.6% of greatest-need allocations in 2023-24 (8,064 households). Life or safety at risk, including domestic violence, accounted for a further 26.4% (3,820 households). Together, these two categories represent more than four in five greatest-need allocations. Health conditions aggravated by housing accounted for 8.6% (1,246 households) and inappropriate housing for 1.3% (195 households).
Of all newly allocated public housing households in 2023-24, 87% were classified as greatest need. In 2024-25, 13,471 newly allocated public housing households were classified as greatest need, representing 84.1% of all new public housing allocations that year.
Section 04 · State comparison
Public housing waitlist by state and territory
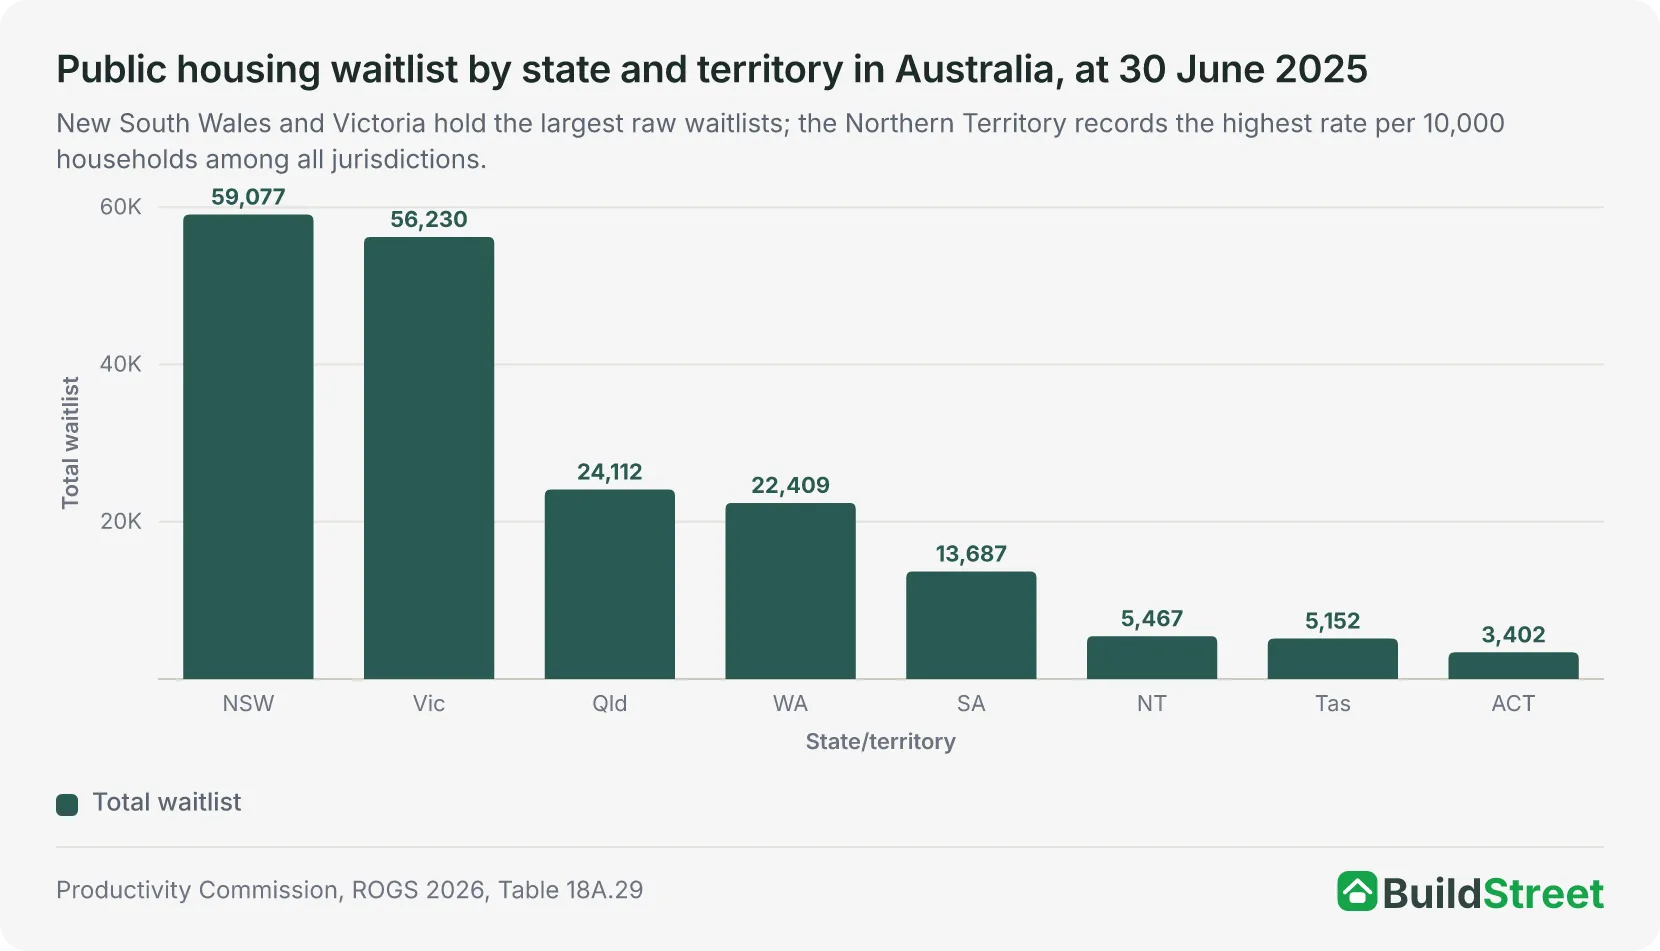
New South Wales has the largest public housing waitlist at 59,077 households (June 2025), followed by Victoria at 56,230 and Queensland at 24,112. Raw totals are generally higher in more populous states. The table below includes a waitlist rate per 10,000 households, based on June 2024 household estimates, to make comparisons across states and territories clearer.
| State / territory | Total waitlist | Greatest need | GN % | Per 10,000 households | Change from June 2024 | GN change |
|---|---|---|---|---|---|---|
| New South Wales | 59,077 | 9,906 | 16.8% | 181 | +8,351 | +1,845 |
| Victoria | 56,230 | 24,803 | 44.1% | 210 | +4,850 | −2,944 † |
| Queensland ‡ | 24,112 | 24,024 | 99.6% | 113 | +5,294 | +5,371 |
| Western Australia | 22,409 | 7,382 | 32.9% | 203 | +2,115 | +1,700 |
| South Australia | 13,687 | 3,021 | 22.1% | 178 | −356 | −440 |
| Northern Territory | 5,467 | 2,240 | 41.0% | 655 | +44 | −42 |
| Tasmania | 5,152 | 4,124 | 80.0% | 213 | +443 | +387 |
| ACT | 3,402 | 1,925 | 56.6% | 187 | +243 | −104 |
| Australia | 189,536 | 77,425 | 40.8% | 181 | +20,984 | +5,773 |
Source · ROGS 2026, Table 18A.29; AIHW Table HOUSEHOLDS.27; AIHW Table SOCIALSHARE.1.
Which state or territory has the highest public housing waitlist rate?
Adjusted for population, the Northern Territory has the highest public housing waitlist rate at 655 per 10,000 households. The NT also has the highest share of households in social housing, at 14.4%, compared with 4.1% nationally.
Among the states, Tasmania (213 per 10,000) and Victoria (210 per 10,000) have the highest waitlist rates, followed by WA (203 per 10,000). New South Wales, the state with the largest raw waitlist, sits at 181 per 10,000, in line with the national rate. Queensland's rate is lower than the national rate, in part because its total waitlist counts only greatest-need applicants under a broader definition.
South Australia is the only jurisdiction where the total waitlist fell year-on-year, declining by 356 households to 13,687. Queensland recorded the largest greatest-need increase nationally (+5,371), exceeding the combined greatest-need growth of NSW (+1,845) and WA (+1,700).
Section 05 · Time waited
How long do households wait before being allocated public housing?
The national median wait for greatest-need households was 8 months in 2024-25, compared with 18 months for non-greatest-need applicants. These figures cover only households that received an allocation. Households still waiting are excluded, and those with specialist or complex needs may be underrepresented in the data.
There is also an important caveat for greatest-need households. Their wait time is recorded from when they gained greatest need status, not from when they first applied. A household may have spent years on the general waitlist before that point, so the recorded wait can understate total time in the system.
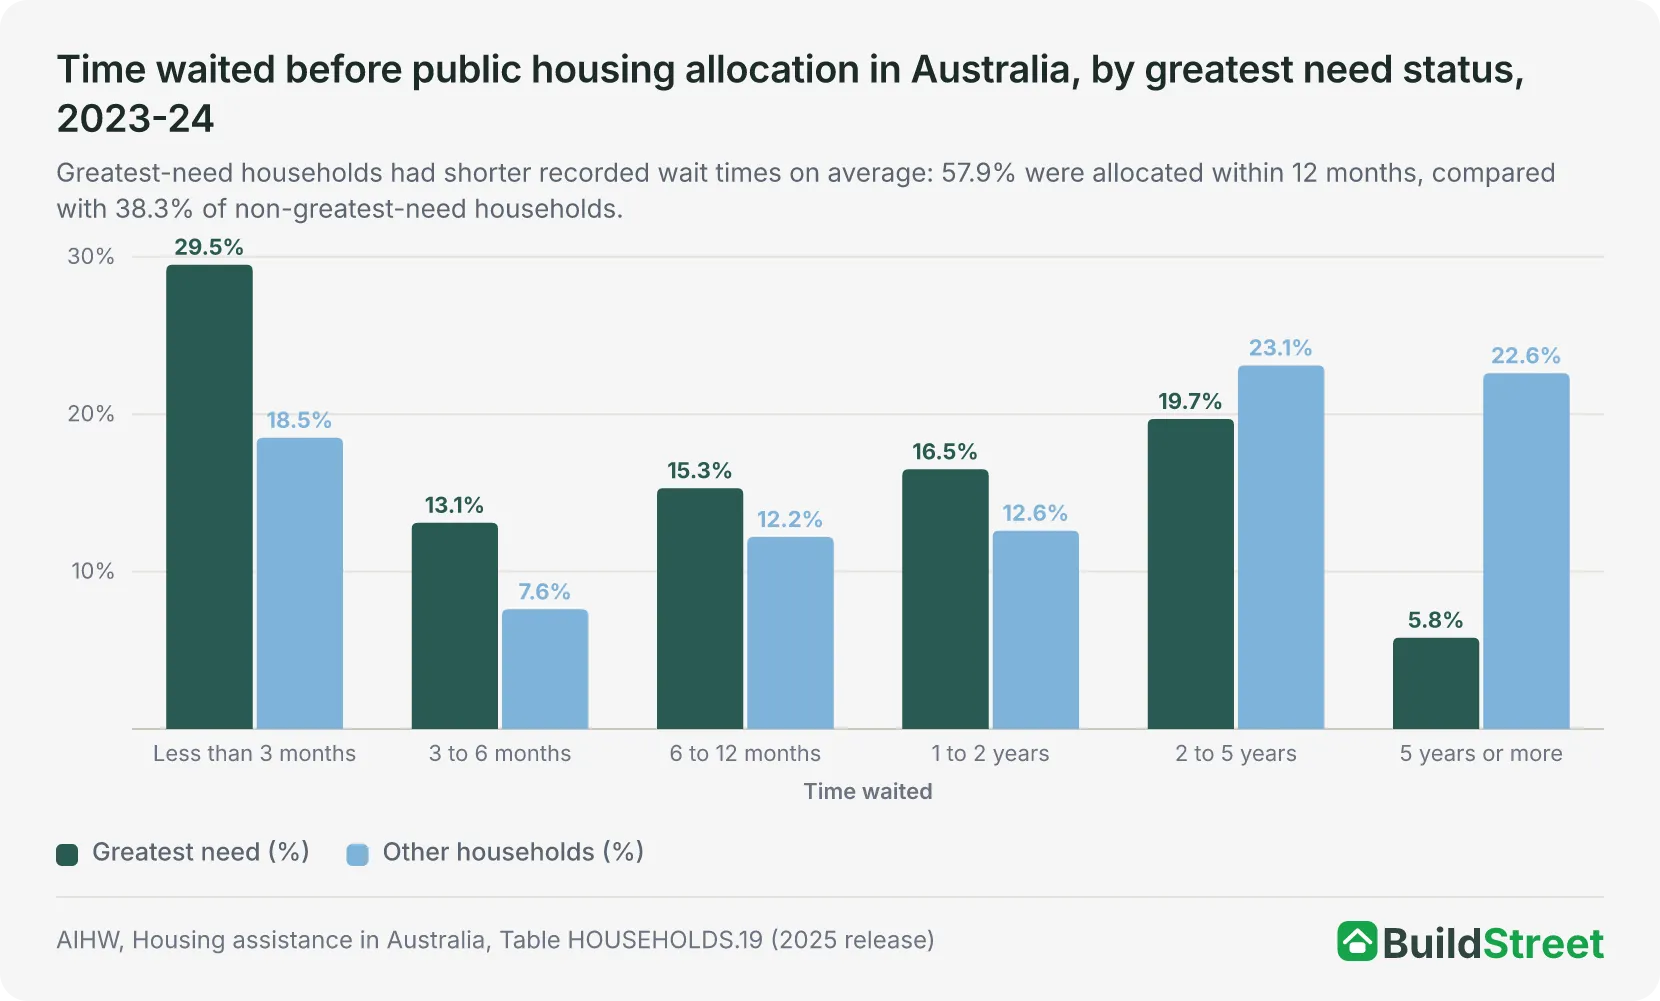
The distribution differs markedly between the two groups. Among greatest-need allocations in 2023-24:
- 29.5% waited less than 3 months, and 57.9% were housed within 12 months.
- Only 5.8% waited 5 or more years.
Among non-greatest-need households, recorded wait times were longer. A total of 22.6% waited 5 years or more, and 38.3% were housed within 12 months. This reflects the allocation data for households that received public housing in 2023-24; it does not include households still waiting.
Median wait times by state, 2024-25
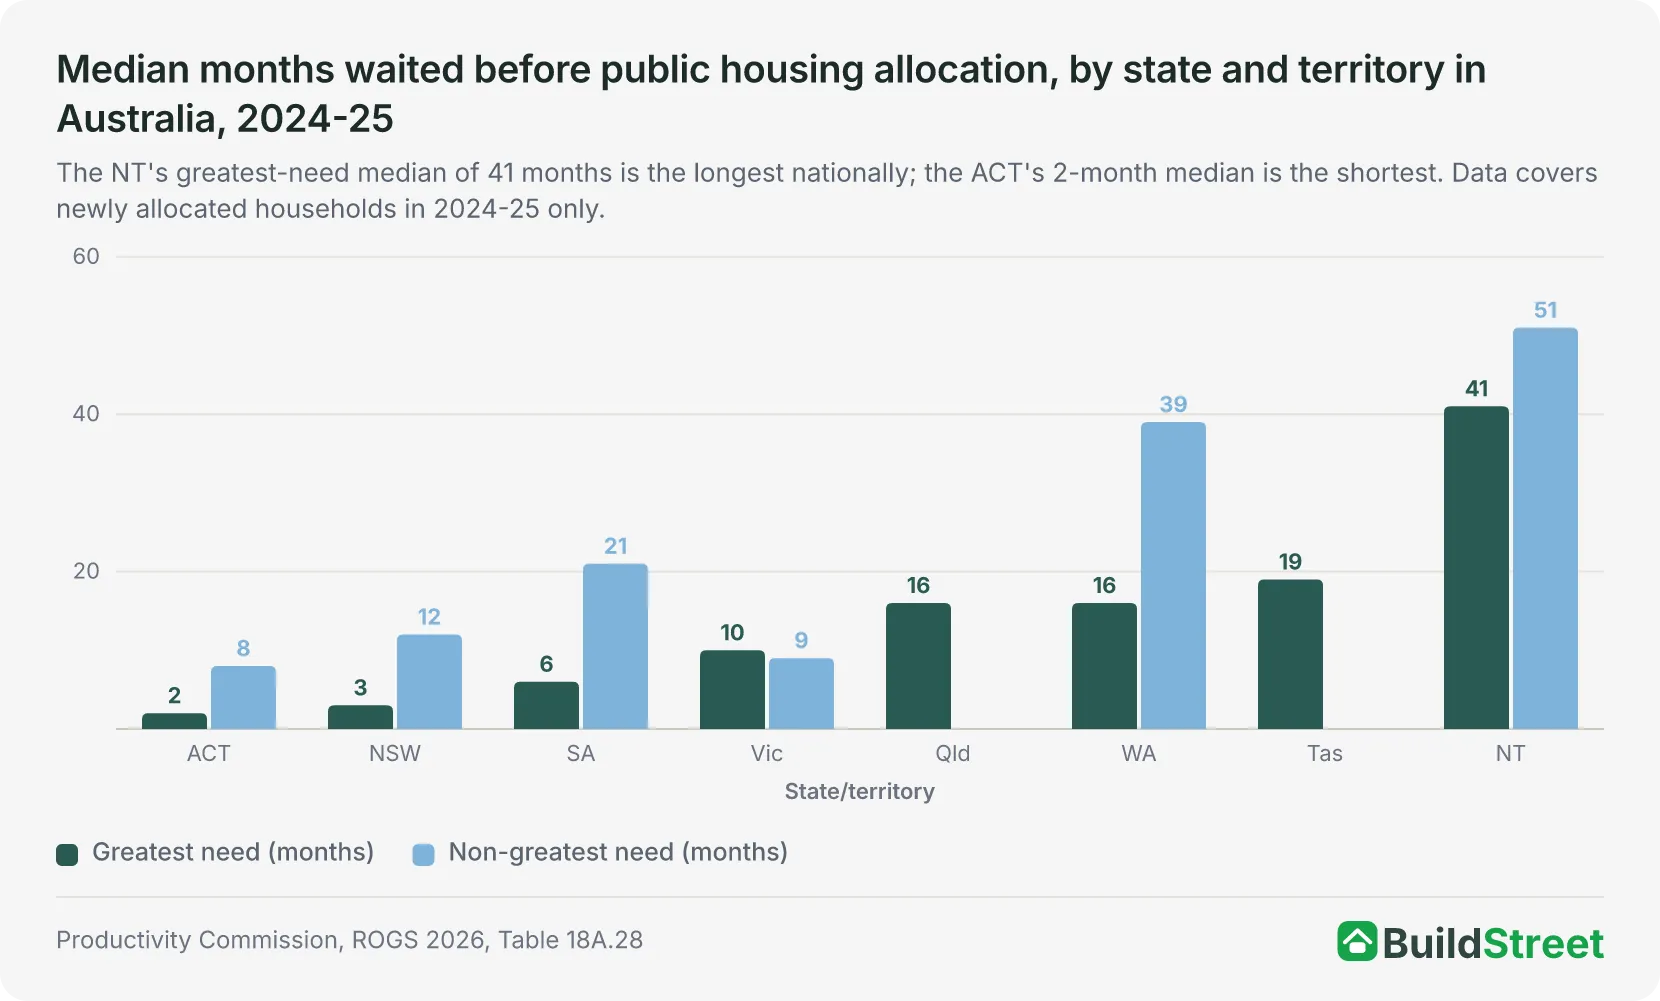
The Northern Territory's greatest-need median of 41 months (3.4 years) is more than 20 times longer than the ACT's 2-month median. The NT's non-greatest-need median of 51 months is the longest across both categories. These long waits may be associated with limited available properties relative to demand, particularly in remote communities.
Victoria shows a different pattern: its greatest-need median (10 months) is slightly longer than its non-greatest-need median (9 months). This may reflect the composition of greatest need applicants in Victoria, where many are seeking accessible or modified dwellings that are in shorter supply.
Western Australia's non-greatest-need median of 39 months is the second longest in the country, after the Northern Territory.
Section 06 · Why it keeps growing
Why is the public housing waitlist growing?
The 12.4% increase in 2024-25 occurred alongside several overlapping pressures. The waitlist grows when new applications outpace the number of households housed or removed from the register, and this has been the case for most years since 2019.
Public housing stock has fallen
Public housing dwellings fell from 323,803 in 2014 to 296,541 in 2025, a reduction of 27,262 (8.4%). A smaller stock base means fewer dwellings turn over each year.
Most allocations come from turnover, not new supply
Most allocations occur when an existing tenant vacates. In 2024-25, 16,016 households were newly allocated. New construction has added relatively little to the annual public housing allocation pool compared with turnover in existing stock.
Private rental pressure
Private rental conditions may affect demand for social housing, although waitlist growth also reflects eligibility rules, application processing and allocation policies.
Social housing supply has not kept pace with household growth
Social housing's share of all Australian households has fallen over the long term. The number of households has increased over time, while social housing has not grown at the same rate.
Stock transfers reduce the public housing count
When dwellings are transferred from public housing, including in NSW and SA, they leave the public housing stock but remain social housing. This reduces the public housing allocation base without reducing total social housing supply.
Long-tenure households limit turnover
More than 44% of public housing households have lived in their current property for at least 10 years. Lower turnover means fewer properties become available for allocation each year.
Even if the waitlist stopped growing entirely, clearing 189,536 households at the 2024-25 allocation rate of 16,016 per year would take approximately 12 years, assuming current turnover patterns. This is a simplified illustration only. It does not account for new applications, households leaving the register, changes in eligibility, or future changes in allocation rates.
Programmes such as the Housing Australia Future Fund (HAFF) and the National Housing Accord are intended to increase supply through community housing providers and affordable housing targets. The bulk of that pipeline extends to 2029 and is expected to add community housing stock rather than public housing stock specifically.
Section 07 · Supply gap
Public housing supply and the waitlist gap
The waitlist has grown while the public housing dwelling stock has contracted. At June 2025, there were 296,541 public housing dwellings nationally, down from 323,803 in 2014, a decline of 27,262 dwellings (8.4%). Over the same period, Australia's total number of households grew by around 1.6 million. Public housing's share of all households fell from approximately 3.6% to around 2.7% over the decade.
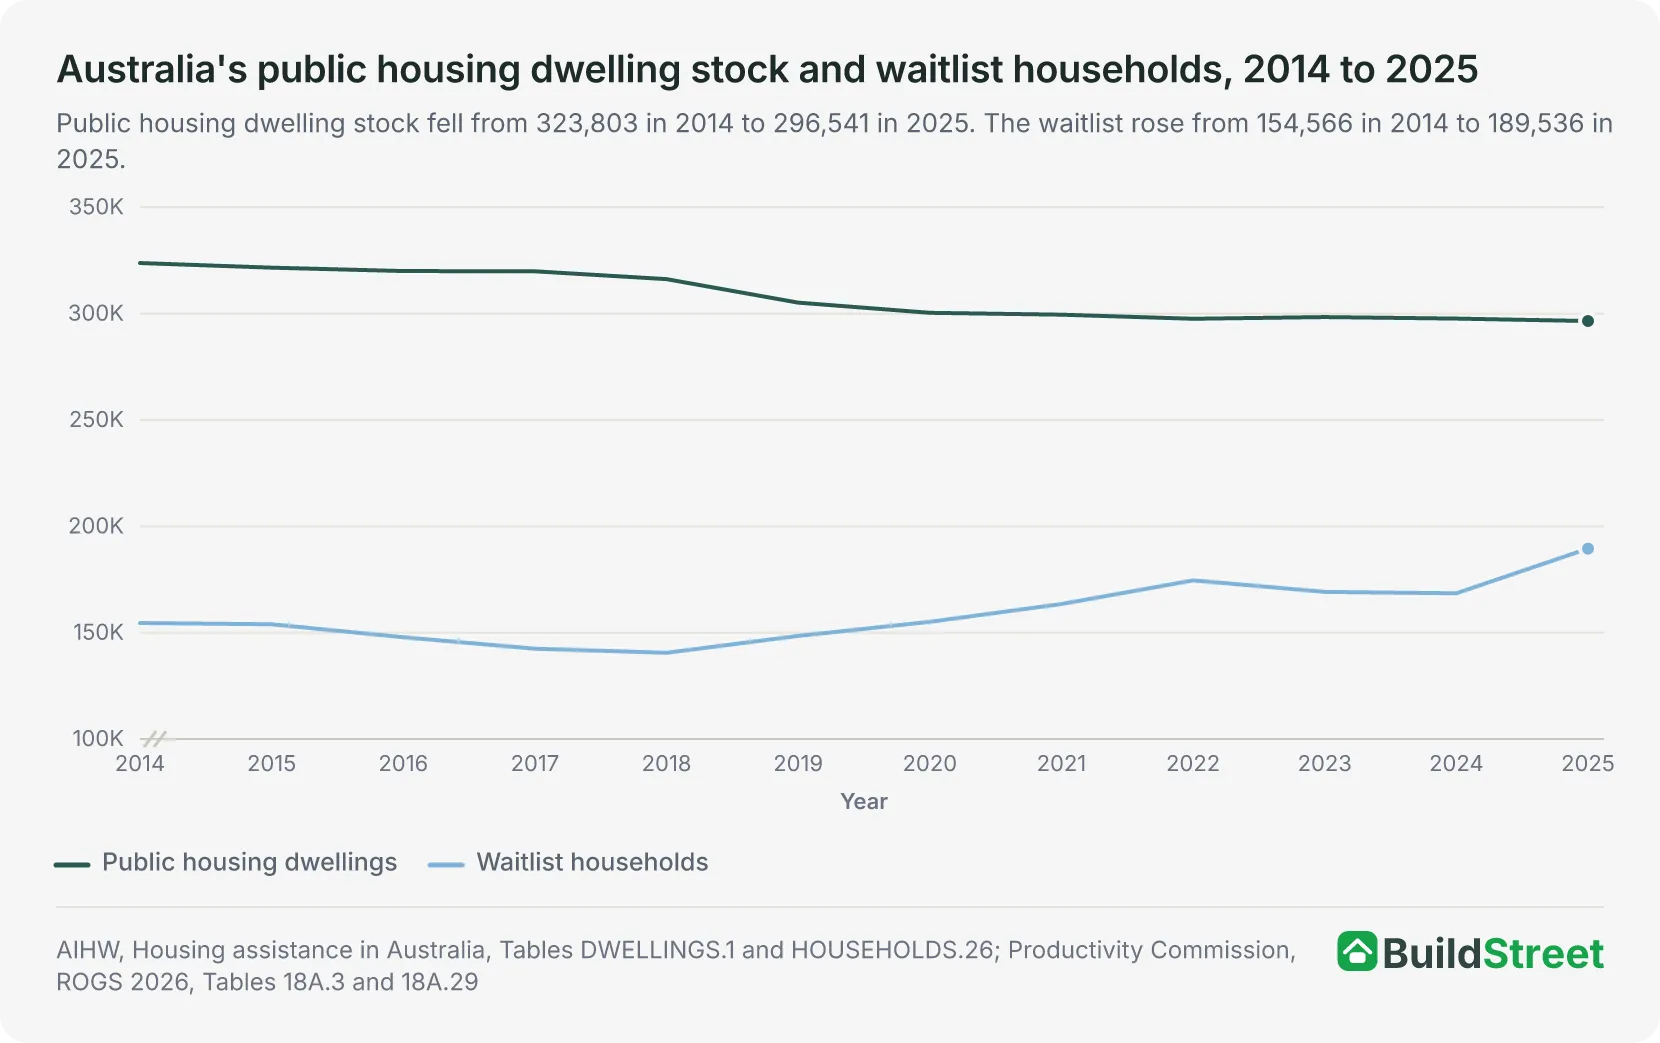
The decline in public housing stock includes several transfer events. South Australia transferred around 3,820 dwellings to community housing in 2017-18; New South Wales transferred stock to community housing in 2018-19 and to SOMIH in 2023-24; and Tasmania transferred approximately 2,000 dwellings to community housing in 2021-22. When a dwelling is transferred, it stays in the social housing system under different management.
In 2024-25, new allocations (16,016) were slightly lower than in 2023-24 (16,660) and 2022-23 (16,510), despite the waitlist growing by more than 20,000 households. Allocations have ranged between approximately 15,000 and 17,000 per year since 2021, with most allocations occurring when existing dwellings become available rather than when new stock enters the system.
Overcrowding and underused public housing dwellings
The supply shortfall is also affected by a mismatch between available dwelling types and household needs. At June 2025, approximately 12,300 public housing households were classified as overcrowded (4.3% of households where bedroom data were recorded). At the same time, approximately 47,600 households (16.7%) were underutilised, meaning they had more bedrooms than the household required.
Larger households needing three or more bedrooms are disproportionately in overcrowded properties, while many smaller dwellings have rooms to spare. The overcrowding rate was 4.3% at June 2025, compared with 4.7% in 2024 and 4.1% in 2023, consistent with a range between approximately 4.1% and 4.7% over recent years.
Social housing accommodated approximately 429,567 households nationally at June 2025, across all programme types. Based on AIHW data for June 2024, the Northern Territory had the highest social housing share at 14.4% of all households; South Australia was the highest mainland state at 5.8%.
Section 08 · Limitations
Why waitlists understate total housing need
The published waitlist figure of 189,536 captures only formally registered eligible households. Research estimates total unmet housing need at more than 640,000 Australian households, far higher than the registered count. The figure understates broader housing need for several structural reasons.
Non-applicants
Eligible households who do not apply are not counted. Eligible households may not apply because the wait appears prohibitively long. Research suggests many low-income households in rental stress have not applied, even though they may qualify. This unregistered demand is not captured in the waitlist data, a limitation acknowledged in official data quality notes.
Transfers excluded
Public housing tenants seeking a different dwelling are not on the waitlist. All waitlist figures exclude households requesting a transfer to a different dwelling within the same programme. A public housing tenant in an overcrowded or unsuitable property who applies to move is not counted in the waitlist, even though their housing circumstances represent a form of unmet need.
Community housing not aggregated nationally
Community housing waitlists exist but are not published as a national total. Community housing providers manage their portion of integrated waitlists, but this data is not published as a national aggregate. Only public housing and SOMIH components are reported in a consistent national format. Adding published figures together would risk double-counting applicants registered across programmes.
Administrative changes move households on and off
Policy changes can alter counts without changing housing circumstances. Changes in eligibility criteria, priority systems, and application processing can move households on and off waitlists without any change in their underlying housing circumstances. Year-on-year movements in waitlist figures may therefore partly reflect administrative adjustments rather than changes in registered demand.
Exits are not tracked by reason
Some households leave the waitlist without being housed. Some households exit the waitlist without receiving housing, for example because they found private rental accommodation, relocated interstate, or did not continue with their application. The volume of such exits is not publicly reported, which means the waitlist gives no clear picture of how many households find housing outside the social housing system.
Research estimates of total unmet housing need consistently exceed the waitlist figures. One study estimated a social housing shortfall of around 435,000 dwellings for the lowest-income quintile of the population, and over 600,000 for the next poorest quintile. A separate national snapshot estimated more than 640,000 Australian households had unmet housing needs at the 2021 Census, including homelessness, overcrowding, and rental stress. By 2041, that figure is projected to exceed 940,000. Both estimates are far larger than the public housing waitlist of around 189,000.
Section 09 · Who is housed
Who is being allocated public housing?
In 2024-25, 16,016 households were newly allocated public housing nationally. Of these, 84.1% were to greatest-need households, down from 87% in 2023-24. Greatest-need households made up the large majority of new public housing allocations in both years.
Detailed demographic data for people currently on the waitlist are not published. The profile of newly allocated households provides a partial view of who receives public housing, though it does not represent the full waitlist population.
Of the 2024-25 allocations:
- Queensland allocated 100% of its 3,161 new households as greatest need, in line with its broad application of the greatest-need definition. The ACT allocated 94.2% as greatest need, the second highest share.
- Homelessness was the leading primary reason for greatest-need classification in 2023-24, accounting for 55.6% of all greatest-need allocations (8,064 households).
- In 2024-25, 64.1% of new public housing tenancies were allocated to households in selected equity groups, including households with a member with disability, younger or older main tenants, and Aboriginal and Torres Strait Islander households.
Households that include a person with disability waited an average of 652 days (around 21.5 months) in 2024-25, compared with 560 days (18.5 months) for households without a person with disability. The 92-day gap may reflect both the volume of disability-related applications and the difficulty of matching accessible or modified dwellings to specific needs.
Non-greatest-need households made up 13% of new public housing allocations in 2023-24. That share rose to 15.9% in 2024-25, as greatest-need allocations fell by more than 1,000 while non-greatest-need allocations increased slightly. Allocated households without greatest-need status had a longer national median wait, at 18 months compared with 8 months for greatest-need households.
Section 10
FAQs about Australia's social housing waitlist
How long does it take to get public housing in Australia?
Wait times vary by state and by whether a household is classified as greatest need. In 2024-25, the national median wait for greatest-need households was 8 months; for non-greatest-need households it was 18 months.
State medians for greatest-need households ranged from 2 months in the ACT to 41 months in the Northern Territory. These figures cover only households that received an allocation. For greatest-need households, wait time is measured from the date of the greatest-need application, not from the original application date, so total time in the system can be longer.
Why doesn't the national waitlist figure include community housing?
Community housing providers manage their component of waitlists within integrated state systems, but this data is not aggregated nationally. Consistent national data are published for public housing and SOMIH waitlists only. Because many applicants are registered for more than one programme through the same application, the figures cannot simply be added together without risk of double-counting.
Why is the public housing waitlist growing?
The waitlist grows when new applications exceed allocations. In 2024-25, 16,016 households were newly allocated public housing, but many more joined the waitlist. Several factors may contribute to this imbalance: public housing dwelling stock has fallen from 323,803 in 2014 to 296,541 in 2025; private rental pressure may have increased demand; most allocations come from existing stock turnover rather than new construction; and social housing's share of all Australian households has declined over the long term.
References
- Australian Institute of Health and Welfare (AIHW), Housing assistance in Australia 2025 · aihw.gov.au
- Productivity Commission, Report on Government Services 2026 — Part G Section 18 Housing data tables (June 2026 release) · pc.gov.au
- AIHW, Australia's Disability Strategy Outcomes Framework — Average time waited for social housing, 2024-25 · aihw.gov.au
- AHURI Final Report No. 452 — Australia's multi-provider social housing system · ahuri.edu.au
- UNSW City Futures Research Centre / CHIA — Quantifying Australia's unmet housing need: a national snapshot · unsw.edu.au
