

Published 30 July 2026 · Updated 22 Sept 2026
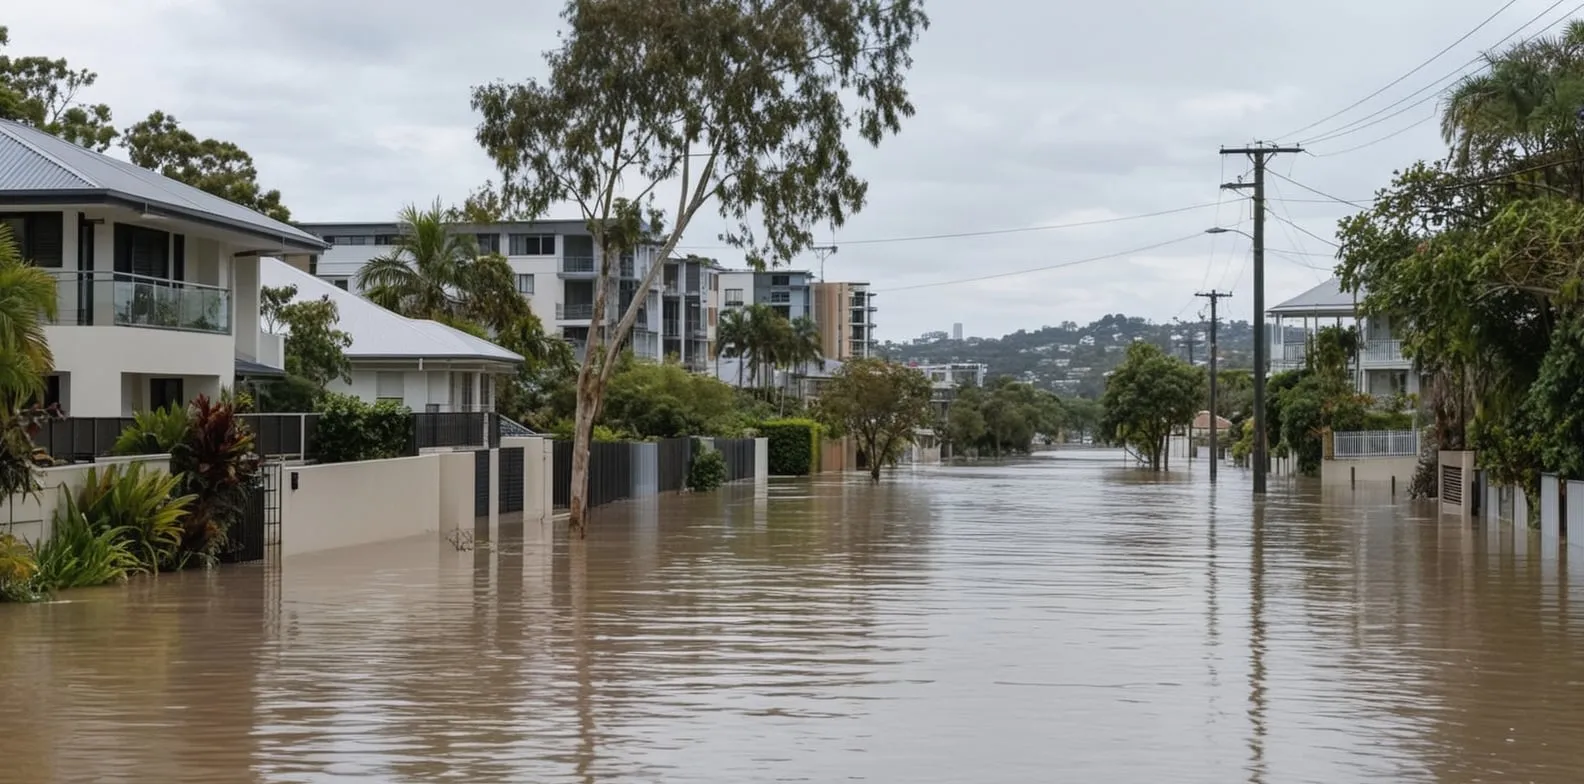
Weather perils, including storm and hail, flood, bushfire and cyclone risk, account for 28% of the average Australian home insurance premium, making them the largest component of the modelled national average. A severe but plausible stress test from the Australian Prudential Regulation Authority (APRA) estimates that the share of Australian households likely to be effectively uninsured could increase from around 15% in 2024 to approximately 25% to 26% by 2050, equivalent to about one million additional households.
The strength of the evidence differs sharply by hazard. Cyclone-prone northern Australia has the clearest data linking regional exposure to actual premiums, including premium changes observed after properties entered the Cyclone Reinsurance Pool. Flood and bushfire risk are well documented in terms of losses and climate trends, but nationally comparable retail premiums by flood depth or Bushfire Attack Level are not publicly available. That gap runs through much of what follows.
 What does a NatHERS energy rating measure?How the 0 to 10 Star Rating and the separate Whole of Home rating are calculated, and how they interact with NCC 2022 compliance across Australia's climate zones.
 Retrofitting older Australian homes for energy efficiencyWhat insulation, glazing and electrification upgrades cost and save for the roughly 70% of Australian homes built before minimum energy standards existed, plus the rebates on offer.
Section 01 · PREMIUM COMPONENTS
How climate risk affects home insurance premiums in Australia
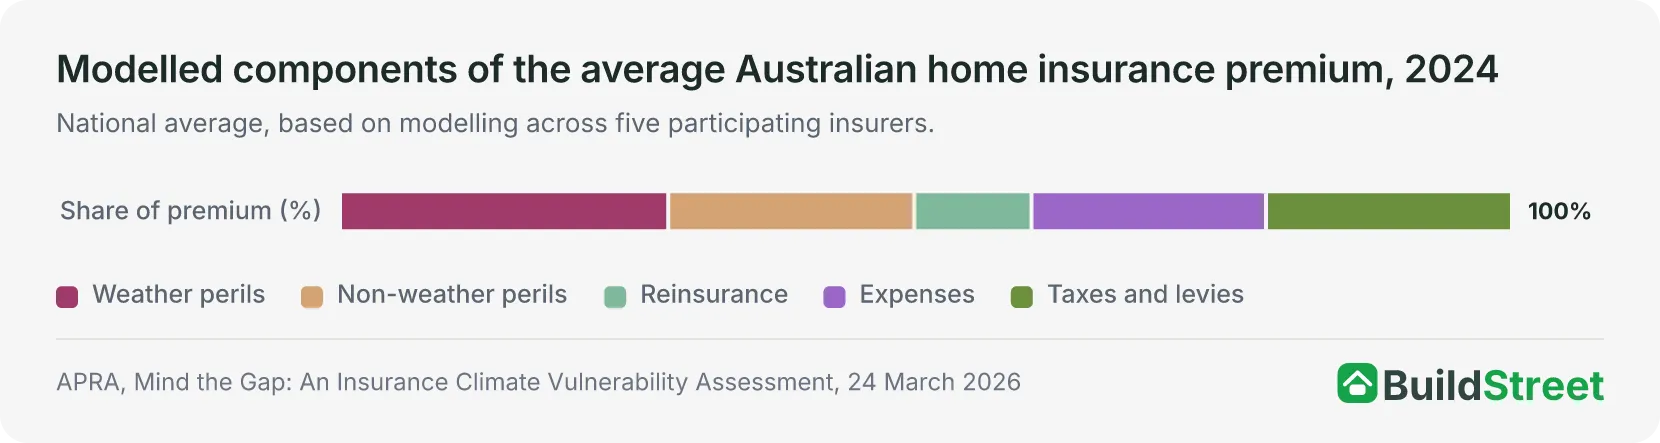
Weather perils account for 28% of the average Australian home insurance premium, more than any other single component. Non-weather perils, such as theft, fire and accidental damage, add a further 21%, so claims-related costs together make up just under half of the average premium. The remaining share splits between reinsurance (10%), operating expenses (20%), and taxes, levies and government charges (21%), the last of which varies by state and territory.
This breakdown is modelled, not an official pricing schedule. Five of Australia’s largest home insurers, together covering around 80% of the private home insurance market by premium volume, took part in the underlying stress test. Because it is a national average rather than an itemised bill, an individual policy can look different once exclusions and insurer-specific pricing are factored in.
Within the weather-peril component, storm and hail, not flood, bushfire or cyclone, is the single biggest contributor by dollar value. Modelled current annual storm and hail losses sit at more than $4 billion nationally, rising to around $6.7 billion under the Delayed Transition Scenario or $7.8 billion under the Current Policies Scenario by 2050. Almost all Australian households face some exposure to storm and hail, though losses are still concentrated: about half occur in roughly a quarter of the country’s regions.
| Weather peril | Current annual losses (2024) | 2050 outcome, higher physical-risk scenario | 2050 outcome, delayed-transition scenario | Geographic concentration |
|---|---|---|---|---|
| Storm and hail | More than $4 billion | To around $7.8 billion | To around $6.7 billion | Half of losses in around a quarter of regions |
| Flood | Not separately published by APRA | Up 240%, an additional $3.9 billion | An additional $1.5 billion | Half of losses in 10% of regions |
| Bushfire | $500 million | To more than $1.4 billion | To more than $1.4 billion | Half of losses in fewer than 10% of regions |
| Cyclone | Nearly $900 million | To more than $1.4 billion | To more than $1.4 billion | Half of losses in fewer than 10% of regions |
| All weather perils, national total | Less than $7 billion | To $16.3 billion (up 140%) | To $12.4 billion (up 84%) | Not applicable |
Source · APRA, Mind the Gap: An Insurance Climate Vulnerability Assessment, 24 March 2026.
Construction cost inflation is a second channel through which climate-related risk reaches a premium, separate from direct weather losses. Rebuilding costs affect the sum insured, and therefore the size of a potential claim, even where a home’s underlying hazard exposure has not changed. Construction costs, rather than increasing hazard exposure, are the main driver of premium growth under one of the two scenarios in APRA’s 2050 stress test.
Section 02 · THE PROTECTION GAP
How many Australian households could be effectively uninsured by 2050?
Around 15% of Australian households, an estimated 1.4 million, faced high insurance affordability pressure and were likely to be effectively uninsured under APRA’s modelled threshold in 2024. That share could reach around 25% to 26% by 2050 under both climate scenarios examined, an increase equivalent to roughly a million more households, over the next 25 years.
A household is classified as likely to be effectively uninsured when its modelled annual premium equals or exceeds four weeks of household income. Testing a three-week or five-week threshold instead of four changes the exact share of affected households, but not the direction or scale of the widening gap. Under a three-week threshold, 21% of households were under pressure in 2024, rising to 33% by 2050 in the higher physical-risk scenario. Under a five-week threshold, the share rises from 11% in 2024 to 20% by 2050.
Australia’s home insurance protection gap: 2024 vs 2050
2024
- Households likely uninsured
Around 15% (about 1.4 million)
- Expected annual weather losses
Less than $7 billion
- Scope
Freestanding houses only
2050 (both scenarios)
- Households likely uninsured
Around 25–26% (+about 1 million)
- Expected annual weather losses
$16.3bn (CPS) / $12.4bn (DTS)
- Scope
Freestanding houses only
Source · APRA, Mind the Gap: An Insurance Climate Vulnerability Assessment, 24 March 2026.CPS refers to APRA’s higher physical-risk Current Policies Scenario; DTS to its Delayed Transition Scenario. Both are severe but plausible stress-test conditions, not predictions.
Why APRA’s two scenarios widen the protection gap
The two scenarios reach a similar headline result through different routes. Climate risk-related factors drive around 80% of the projected increase in the protection gap, with broader, non-climate economic changes accounting for the rest.
Current Policies Scenario: rising losses
In the higher physical-risk scenario, increasing weather-peril losses are the main driver of higher premiums. National expected annual weather losses rise 140% to $16.3 billion by 2050, and households already under affordability pressure experience loss rates that increase faster than in the alternative scenario.
Delayed Transition Scenario: rising costs
Under this scenario, construction cost inflation, not rising hazard exposure, is the dominant driver. Premiums grow faster than household incomes because rebuilding costs keep climbing, so insurance can become less affordable even where a home’s own weather risk has not changed.
Home insurance affordability pressure is higher outside capital cities
Protection gap outcomes are not evenly spread across Australia. Around 11% of households in capital cities were likely to be effectively uninsured in 2024, rising to nearly 20% by 2050. The corresponding share in regional centres rises from around 20% to more than 30%. Rural areas have the highest modelled rates, increasing from around 25% in 2024 to more than 40% by 2050 under both scenarios.
| Area type | Share likely uninsured, 2024 | Share likely uninsured, 2050 (both scenarios) |
|---|---|---|
| Capital cities | Around 11% | Nearly 20% |
| Regional centres | Around 20% | More than 30% |
| Rural areas | Around 25% | More than 40% |
Source · APRA, Mind the Gap: An Insurance Climate Vulnerability Assessment, 24 March 2026.
New South Wales and Queensland account for around 60% of households likely to be effectively uninsured nationally, both in 2024 and under the 2050 scenarios. That partly reflects population: the two states hold more than half of Australia’s housing stock. It also reflects their higher modelled protection-gap rates, which rise from under 20% in 2024 to more than 30% by 2050, compared with a national average that rises from 15% to 25–26%.
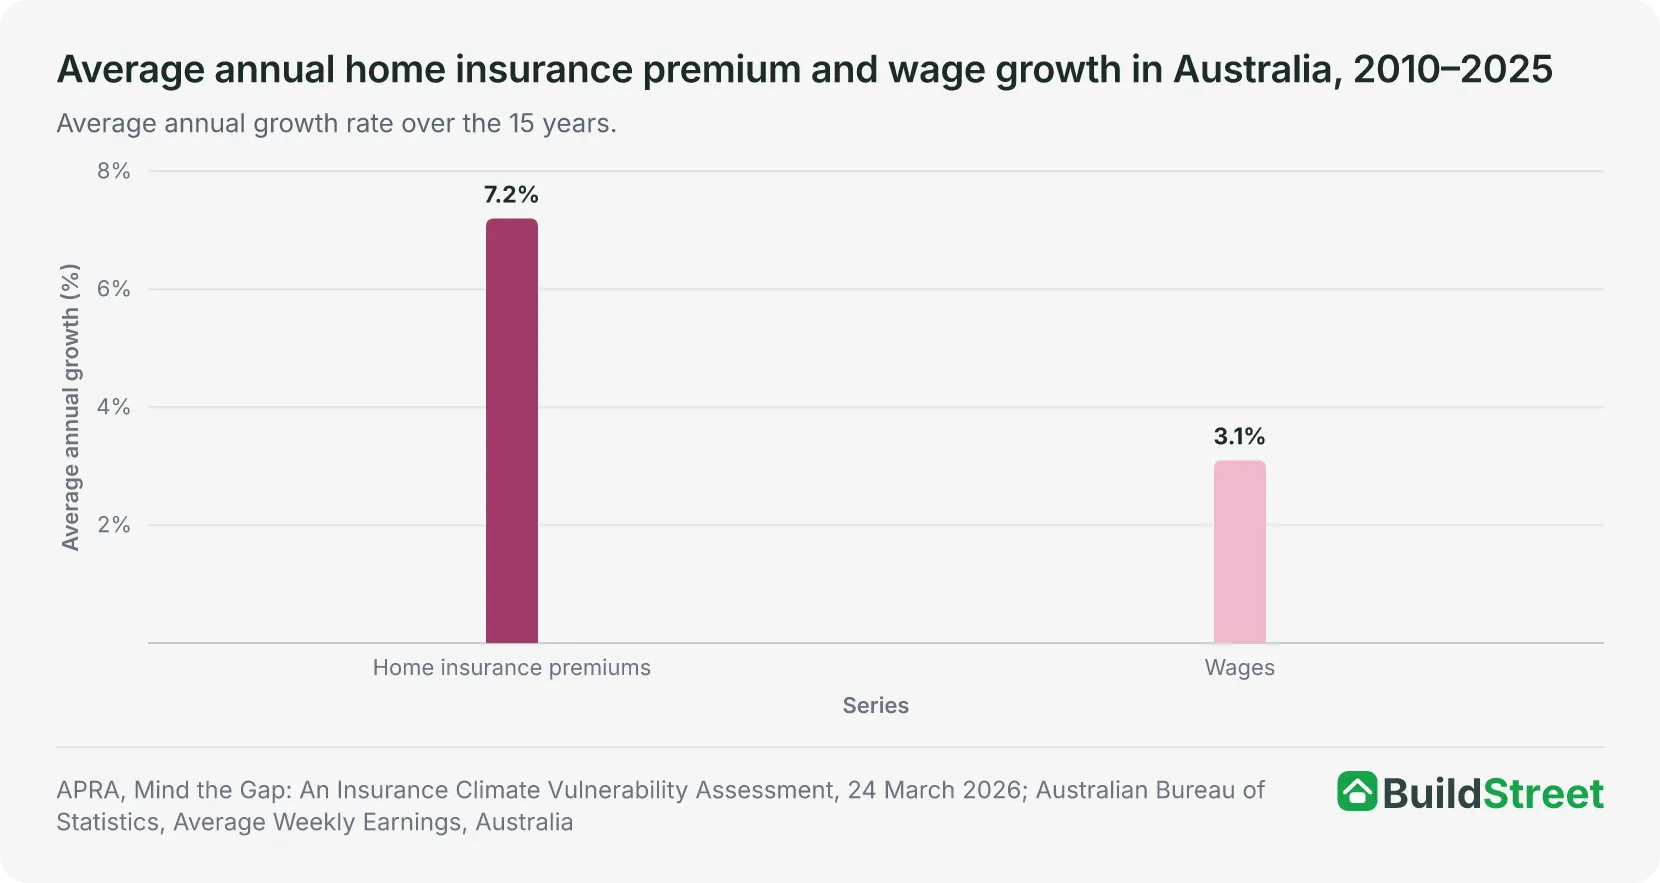
Why the home insurance protection gap affects the financial system
The protection gap is also a financial system issue, not only a household one. Banks rely on home insurance to protect the value of mortgage collateral. If an uninsured home is damaged, the risk of borrower default and a lender loss can increase because the damaged property may no longer cover the outstanding loan. A wider protection gap can also mean greater reliance on government support after weather events, along with pressure for public intervention to improve affordability, both of which carry a cost to public finances.
Section 03 · FLOOD RISK
Flood risk and home insurance costs in Australia
More than half of Australian homes have some degree of modelled flood exposure, and flood losses are projected to grow faster under APRA’s higher physical-risk scenario than losses from any other weather peril. This covers a wide range of exposure levels and does not mean that most Australian homes face severe flood risk.
Under the higher physical-risk scenario, expected annual flood losses are projected to rise by around 240% by 2050, an additional $3.9 billion nationally. Under the delayed-transition scenario, the increase is an additional $1.5 billion. In both cases, losses stay heavily concentrated: half of all projected flood losses occur in just 10% of Australia’s regions.
Flood cover reached 97% of combined policies by 2018–19
Flood coverage in combined home and contents policies has expanded sharply: from around 50% of policies in 2008–09 to 97% in 2018–19. That expansion changes how premiums can be compared over time. Some insurers allow flood cover to be removed from a limited number of very high-risk policies, while at least two require flood cover for some products. A policy without flood cover is therefore not directly comparable with an earlier policy offering broader coverage.
Source: ACCC, Insurance Monitoring Report 2026, section 5.3.2; citing the Northern Australia Insurance Inquiry final report.
Rising rainfall intensity is one of the physical drivers behind this: daily rainfall extremes are likely to intensify by around 8% for each degree of global warming, and hourly extreme rainfall, the kind most closely linked to flash flooding, by around 15% per degree. Heavy rainfall is one of the main contributors to flood risk, alongside how wet catchments already are when a rain event hits.
New South Wales planning guidance illustrates how flood risk is managed on the ground rather than priced. Council flood studies provide the maps and behavioural data that feed into flood-planning areas and levels, with a 1% annual exceedance probability event, plus freeboard, used as the minimum residential flood-planning standard, alongside consideration of lower-probability and more extreme events for some proposals. This is a planning control, not an insurance price band, a distinction that applies just as much to bushfire and cyclone risk.
Section 04 · BUSHFIRE RISK
How bushfire risk affects home insurance costs in Australia
Bushfire losses are modelled nationally at $500 million for 2024 and are projected to exceed $1.4 billion by 2050 under both APRA stress-test scenarios. As with cyclone, bushfire risk is highly concentrated: half of expected losses occur in fewer than 10% of Australia’s regions, both in 2024 and under the 2050 projections.
Dangerous fire-weather days have become more frequent across most Australian regions over the past 75 years. These are days when the Forest Fire Danger Index exceeds its 90th percentile. The increase has been most evident during spring and summer, alongside an earlier start to the southern fire season.
Victoria’s Bushfire Management Overlay is an example of the planning controls available for bushfire-prone land. It applies to land that may be significantly affected by extreme bushfire and requires a planning permit for some development, with a bushfire management plan able to specify a construction standard, setbacks, defendable space, water supply and emergency-services access. These are planning and building controls intended to manage risk on the ground, not a published insurer pricing category.
Section 05 · CYCLONE RISK
Cyclone-prone regions have Australia’s highest home insurance premiums
Cyclone-prone northern Australia has the clearest data connecting regional hazard exposure to actual retail premiums. In 2024–25, the highest mean combined home and contents premiums were in North Western Australia, at nearly $5,000, followed by the Northern Territory ($3,546) and North Queensland ($3,117). The rest of Australia averaged $2,310, less than half the north Western Australian figure.
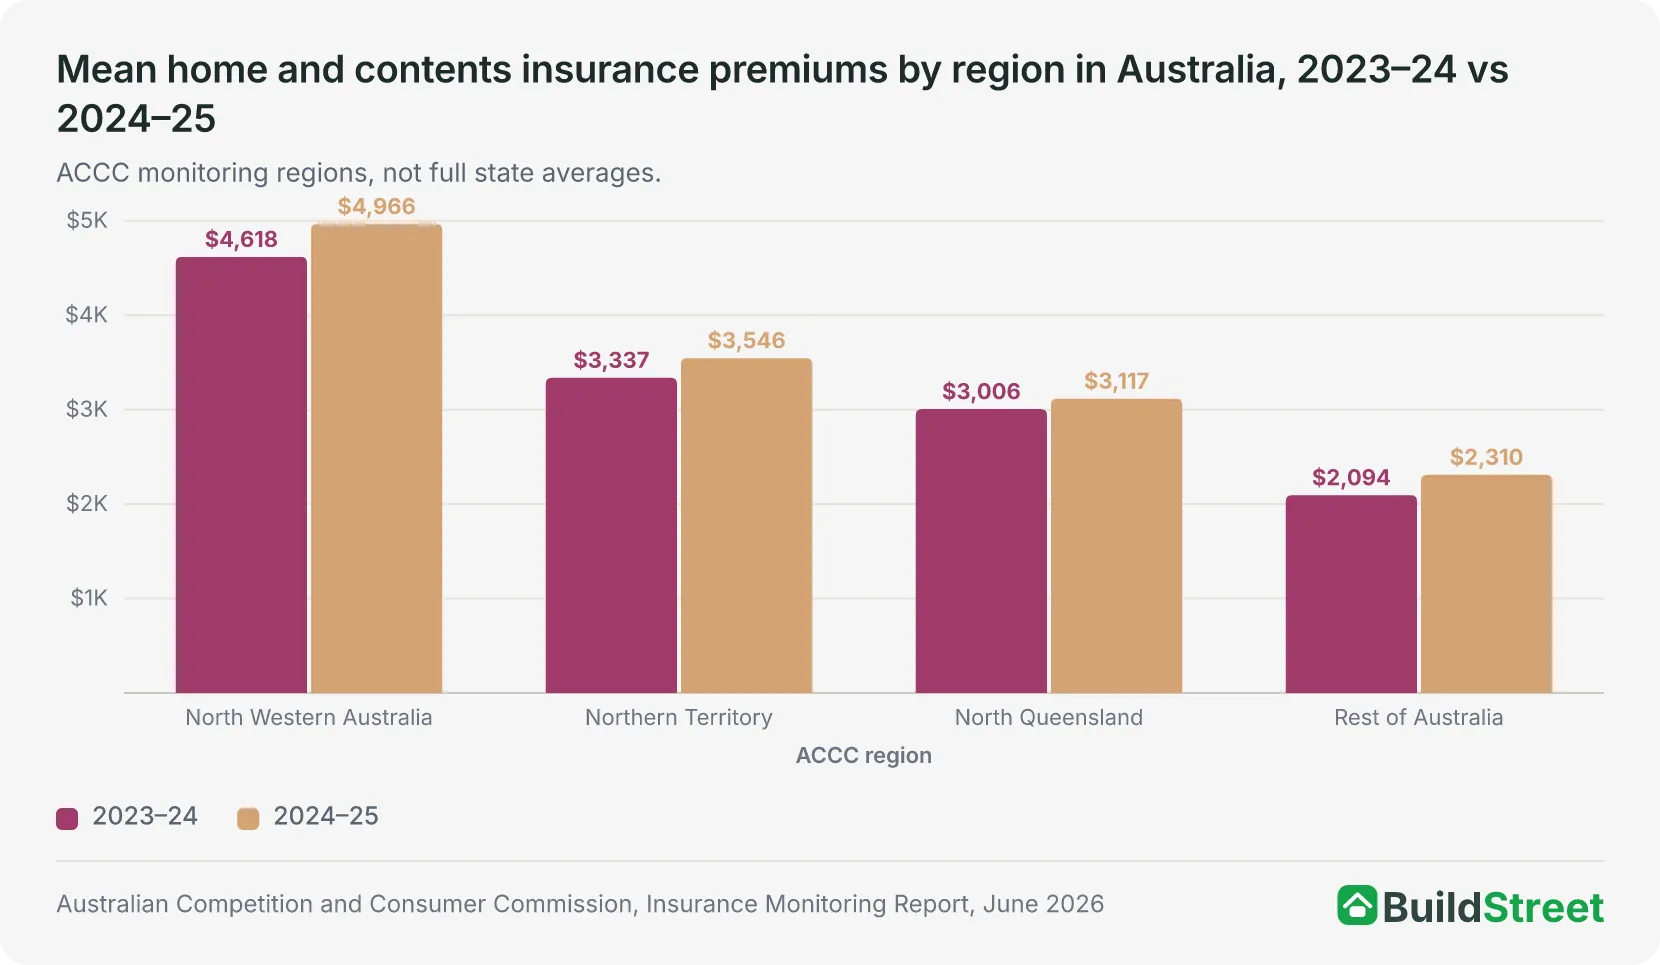
The regional premium data runs from 2007–08 to 2024–25 and shows northern premiums rising much faster than the rest of Australia over the long run. The percentage gap has narrowed more recently because premiums in the rest of Australia have grown faster. Since 2021–22, premiums rose by 49% in the rest of Australia, 38% in the Northern Territory, 17% in North Western Australia and 14% in North Queensland.
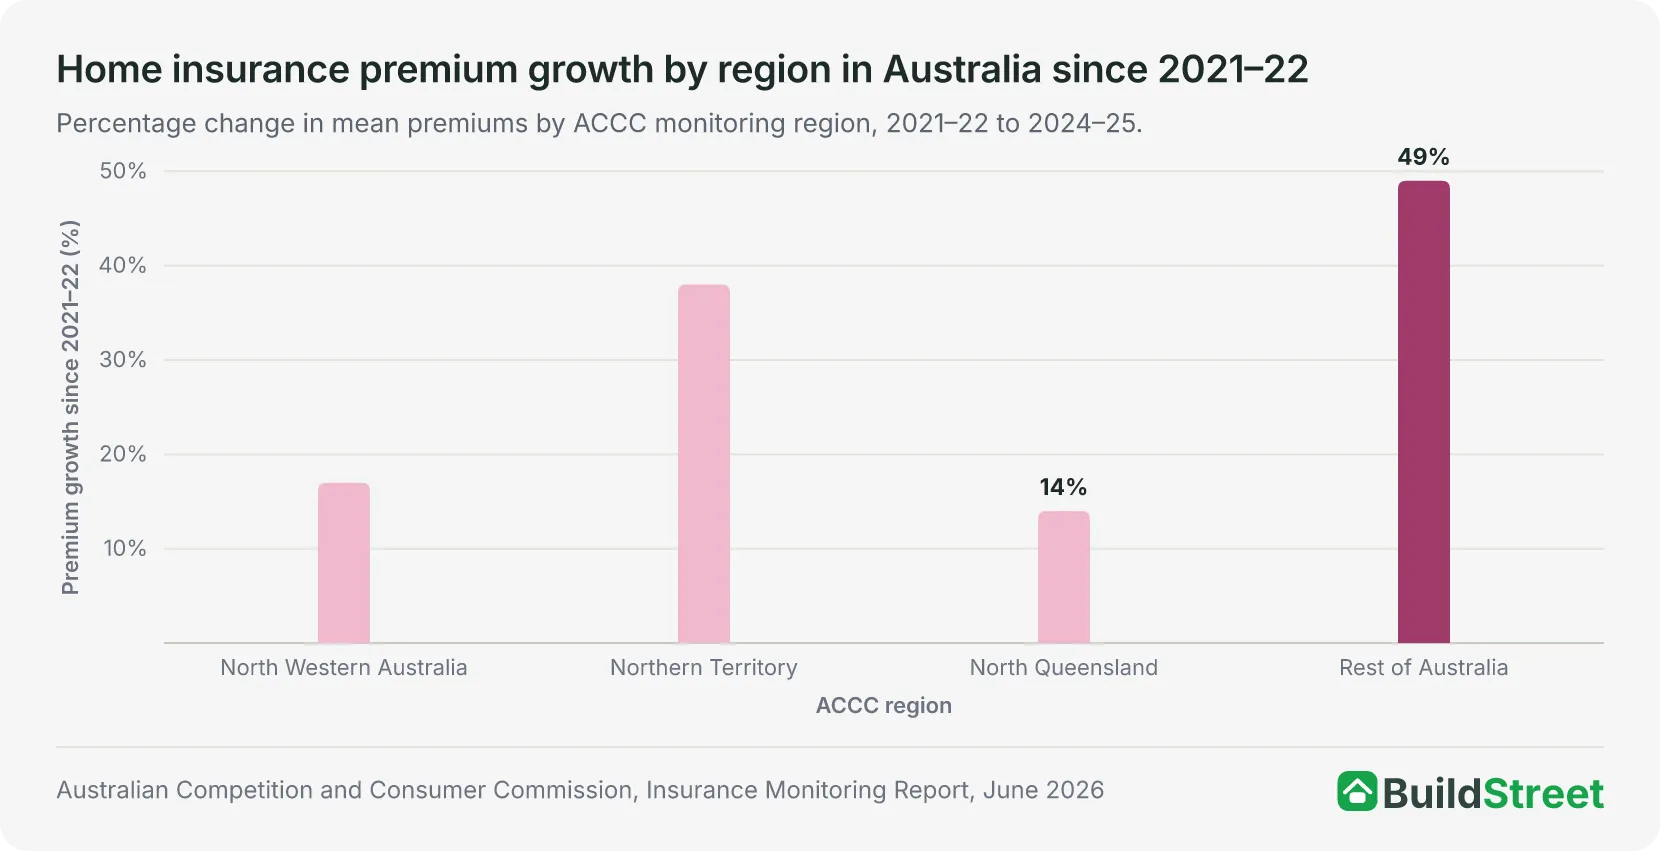
Higher sums insured contribute to the regional premium gap. Rebuilding costs in northern Australia can be affected by remoteness and stricter construction standards in cyclone-prone areas.
| Mean home and contents insurance premiums in cyclone-prone Australian regions, 2021–22 to 2024–25 | |||||
|---|---|---|---|---|---|
| Region | Mean premium, 2023–24 | Mean premium, 2024–25 | Change, 2023–24 to 2024–25 | Growth since 2021–22 | Per $100,000 sum insured, 2024–25 |
| North Western Australia | $4,618 | Nearly $5,000 | Up 8% | Up 17% | $729 |
| Northern Territory | $3,337 | $3,546 | Up 6% | Up 38% | $442 |
| North Queensland | $3,006 | $3,117 | Up 4% | Up 14% | $490 |
| Rest of Australia | $2,094 | $2,310 | Up 10% | Up 49% | $295 |
Source · Australian Competition and Consumer Commission, Insurance Monitoring Report, June 2026.
Premiums fell for higher-risk properties after Cyclone Reinsurance Pool entry
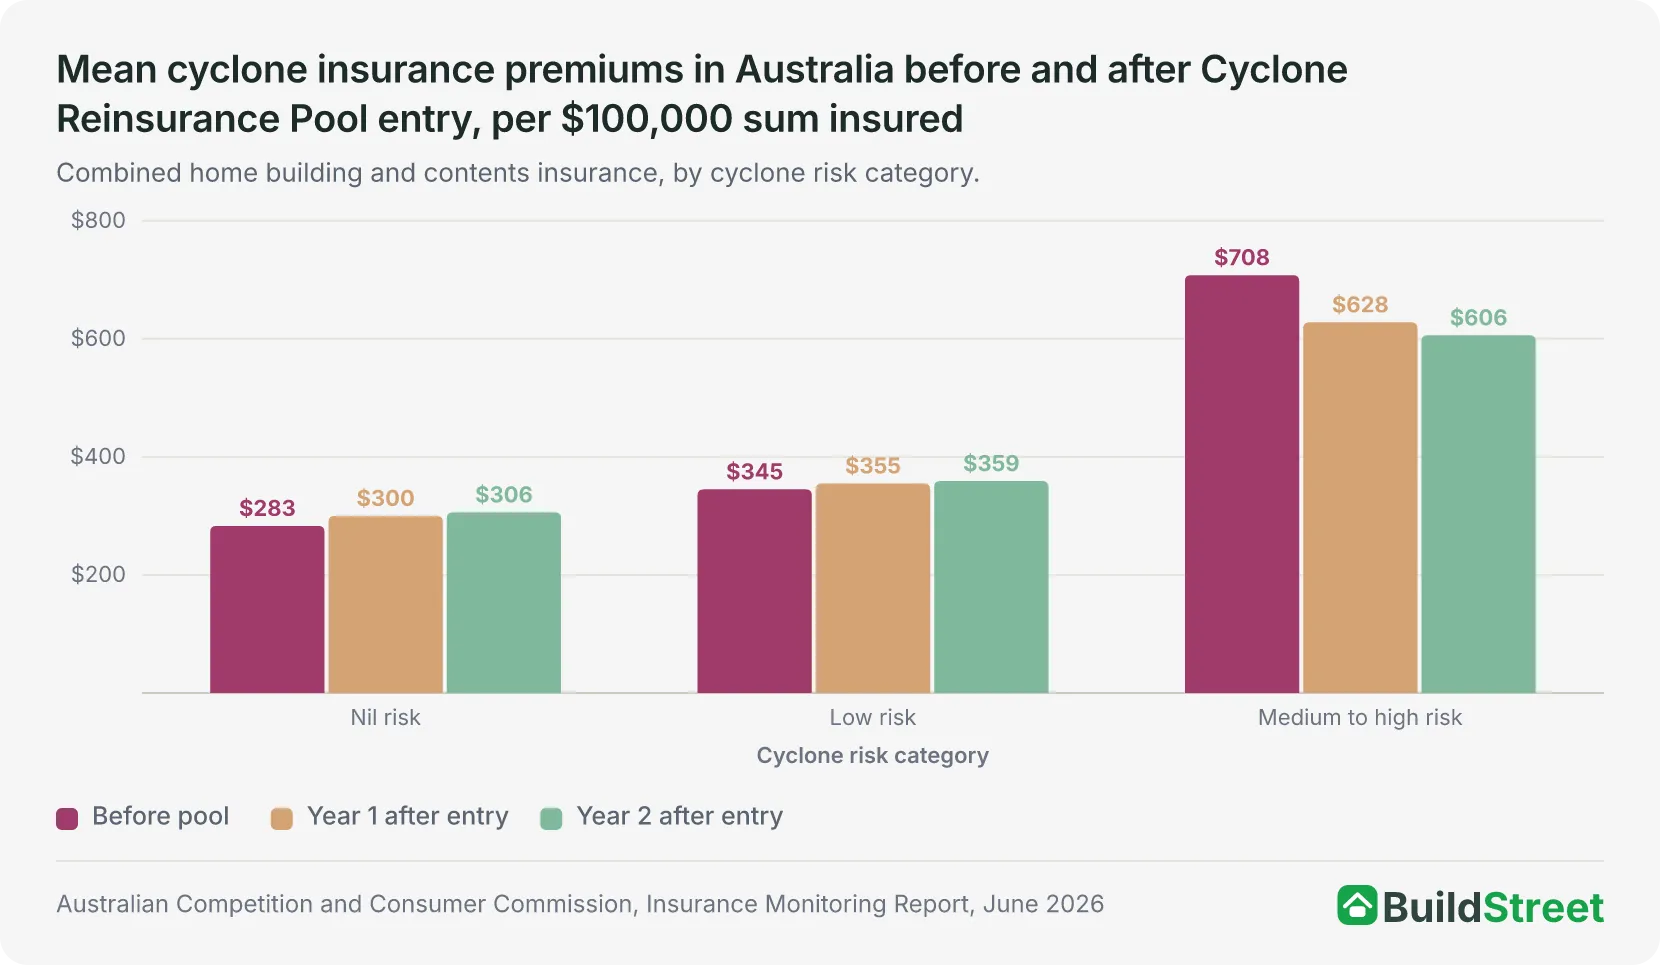
The Cyclone Reinsurance Pool, established by the government in 2022 and administered by the Australian Reinsurance Pool Corporation, was designed to lower the cost of reinsurance, and therefore insurance, for the roughly 2% of policies nationally with medium-to-high cyclone risk. On a per-$100,000 sum-insured basis for combined home building and contents cover, the mean premium for medium-to-high-risk properties fell 11% in the first year after pool entry and was 14% lower after two years.
Premium reductions were not recorded across every risk category. Mean premiums for nil-risk properties increased by around 6% in the first year after pool entry and 8% after two years, while low-risk properties rose by around 3% in the first year and 4% after two years. The observed reductions were therefore concentrated among properties with higher modelled cyclone risk.
Rising sea levels add a further, slower-moving risk to coastal Australia, distinct from cyclone-driven storm surge. More frequent extreme high sea levels along the Australian coastline increase the risk of inundation to coastal infrastructure and communities, independent of any single cyclone event.
Queensland uses planning and building guidance to manage cyclone and storm-tide risk. The Queensland Reconstruction Authority’s cyclone and storm tide resilient building guidance applies to homes within 50 kilometres of the coastline north of Bundaberg, and it sets construction and resilience expectations rather than insurance premium bands. The guidance points to a concrete reason those standards matter: homes built to the correct wind classification generally performed well in severe tropical cyclones Larry (2006), Yasi (2011) and Debbie (2017), while homes built before the mid-1980s, ahead of current wind-classification standards, generally sustained more damage.
Section 06 · MAPS, OVERLAYS AND PRICING
Risk maps and planning overlays do not set home insurance premiums
Government hazard maps and planning overlays can inform risk assessments and building requirements, but they do not set home insurance premiums. The Australian Flood Risk Information Portal alone contains more than 1,500 references to flood studies and maps, while each state applies its own planning and building systems. A government hazard map, a planning overlay and an insurer’s pricing model each serve a different purpose. Only the insurer’s pricing model contributes directly to the quoted premium.
| How Australian risk information systems relate to home insurance premiums | ||
|---|---|---|
| Information system | Primary purpose | Relationship to a retail premium |
| Government hazard map or study | Represents modelled hazard, such as flood extent, depth or fire exposure | Can inform risk assessment but does not set a premium |
| Planning overlay or flood-planning area | Applies development controls and assessment requirements | Does not directly determine a premium |
| Building assessment, including Bushfire Attack Level | Specifies construction response to site conditions | May affect vulnerability and rebuilding cost, but is not a published premium band |
| Insurer pricing model | Estimates expected claims and portfolio exposure using insurer-selected data | Contributes directly to underwriting and the quoted price |
Source · Australian Competition and Consumer Commission, Insurance Monitoring Report, June 2026; state planning authorities cited below.
Planning tools in three Australian states do not set insurance premiums
1New South Wales · Flood planning
- Tool
Council flood studies feeding flood-planning areas and levels
- Standard used
1% annual exceedance probability event, plus freeboard, as the minimum
- Sets a premium?
No, a land-use planning input
2Victoria · Bushfire overlay
- Tool
Bushfire Management Overlay, requiring a planning permit for some development
- Can specify
Construction standard, setbacks, defendable space, water supply, emergency access
- Sets a premium?
No, a planning and building control
3Queensland · Cyclone building guidance
- Tool
Cyclone and storm tide resilient building guidance, Queensland Reconstruction Authority
- Applies to
Homes within 50km of the coast north of Bundaberg
- Sets a premium?
No, a construction resilience guide
Source · NSW Department of Planning, Housing and Infrastructure, Planning Circular PS 26-001, February 2026; Victorian Government, Building in the Bushfire Management Overlay; Queensland Reconstruction Authority, Cyclone and Storm Tide Resilient Building Guidance for Queensland Homes.
The national flood portal covers only studies contributed up to 2018. Uncertainty about ownership also means that the portal sometimes contains study details rather than the complete flood study or map. It therefore cannot be treated as a current, comprehensive national flood map.
Insurers increasingly assess cyclone and flood risk at individual-address level rather than by postcode or broad region. Address-level assessment can result in lower premiums or wider availability for lower-risk properties, while higher-risk properties may face higher premiums or more limited availability. Because insurers use different models, pricing preferences and portfolio strategies, quotes for the same address can differ materially between providers.
Section 07 · MITIGATION
How mitigation can reduce risk, but premium effects are not guaranteed
Risk mitigation can reduce expected losses and improve insurance affordability over time, but it does not guarantee a lower premium for an individual property.
The location of new housing is one mitigation factor quantified in APRA’s preliminary sensitivity analysis. The modelled national protection gap in 2050 falls to around 23–24% if new homes are concentrated in lower-risk areas and rises to around 28–29% if they are concentrated in higher-risk areas, compared with a baseline of 25–26%. The analysis therefore shows that land-use planning can affect the scale of the future protection gap. Other mitigation measures include more resilient buildings, protective infrastructure and retrofitting existing homes.
Three approaches to narrowing the home insurance protection gap
The mitigation options described in the cited sources fall into three broad groups:
- Risk reduction: Community-scale measures such as flood levees, fire breaks and enhanced stormwater drainage, alongside more resilient buildings and avoiding new construction in higher-risk areas. These measures address hazard exposure or building vulnerability, but do not guarantee a lower premium for an individual property.
- Insurance innovation: This can include more targeted cover as a lower-cost alternative to comprehensive policies, alongside alternative risk-transfer mechanisms and technology-driven efficiencies intended to reduce insurers’ operating costs. Any affordability benefit depends partly on whether those savings are reflected in retail premiums.
- Public policy intervention: government-led measures such as the Cyclone Reinsurance Pool, which lowers reinsurance costs specifically for properties with higher cyclone risk. Its scope is narrower than broader risk-reduction measures because it targets cyclone-related reinsurance rather than every component of a home insurance premium.
Section 08 · DATA COMPARABILITY
Why climate risk insurance data is hard to compare nationally
National climate-risk insurance data is difficult to compare because official sources measure different hazards, insurance products, geographic areas and stages of the risk chain. A property can be exposed to a hazard without suffering a loss. An insured loss does not capture uninsured damage. A planning control does not reveal the price an insurer will quote. Treating any one of these as a stand-in for another produces a misleading picture.
The ACCC’s regional premium series provided one of Australia’s most consistent official records of premiums in cyclone-prone northern regions. The series ended on 30 June 2026, when the ACCC’s monitoring role concluded. It had tracked premiums in northern Australia from 2007–08, but no successor series had been announced as at July 2026.
| Main limitations when comparing climate-risk and home insurance data in Australia | |
|---|---|
| Comparability problem | Why it matters |
| Different units | Sources count properties, dwellings, households, policies, insured buildings or geographic regions, and these are not interchangeable. |
| Different products | Building, contents, combined home and contents, landlord and strata insurance are separate products and cannot be summed or substituted for one another. |
| Different statistics | A mean premium, a premium per $100,000 sum insured, and a peril’s share of the premium answer different questions. The cited sources do not publish a national median home insurance premium. |
| Different map purposes | Flood studies, planning overlays, Bushfire Attack Level assessments and insurer models use different assumptions, thresholds and update cycles. |
| Different time concepts | Observed climate trends, current expected losses and 2050 stress-test scenarios cannot be placed on a single historical timeline. |
| Proprietary pricing | Insurer models, underwriting tolerances and portfolio choices are not published as a common, address-level dataset. |
| Incomplete national coverage | The APRA insurance-affordability stress test excludes strata properties, and the national flood study catalogue only covers studies contributed up to 2018. |
Source · APRA, ACCC and Geoscience Australia publications cited above.
A National Insurance Dataset, under development through the Hazards Insurance Partnership, would eventually link hazard exposure with actual premiums at address level. As at July 2026, progress and further analysis were reported as underway, but a public, national, address-level dataset connecting flood, bushfire and cyclone exposure to actual retail premiums had not been released.
References
- APRA, Mind the Gap: An Insurance Climate Vulnerability Assessment, March 2026 · apra.gov.au
- ACCC, Insurance Monitoring Report, June 2026 · accc.gov.au
- ACCC, Northern Australia Insurance Inquiry: Final Report, December 2020 · accc.gov.au
- Bureau of Meteorology and CSIRO, State of the Climate 2024 · csiro.au
- ASIC Moneysmart, Storm, Flood and Fire Insurance · moneysmart.gov.au
- Geoscience Australia, Australian Flood Risk Information Portal (AFRIP) · ga.gov.au
- NEMA, Hazards Insurance Partnership · nema.gov.au
- ARPC, Cyclone Reinsurance Pool Statistics, as at 31 December 2025 · arpc.gov.au
- Victorian Government, Building in the Bushfire Management Overlay · planning.vic.gov.au
- NSW DPHI, Planning Circular PS 26-001: Flooding and Land Use Planning, February 2026 · planning.nsw.gov.au
- QRA, Cyclone and Storm Tide Resilient Building Guidance for Queensland Homes · qra.qld.gov.au
- ABS, Average Weekly Earnings, Australia, Nov 2025 · Australian Bureau of Statistics
