

Published 27 May 2026 · Updated 23 Sept 2026
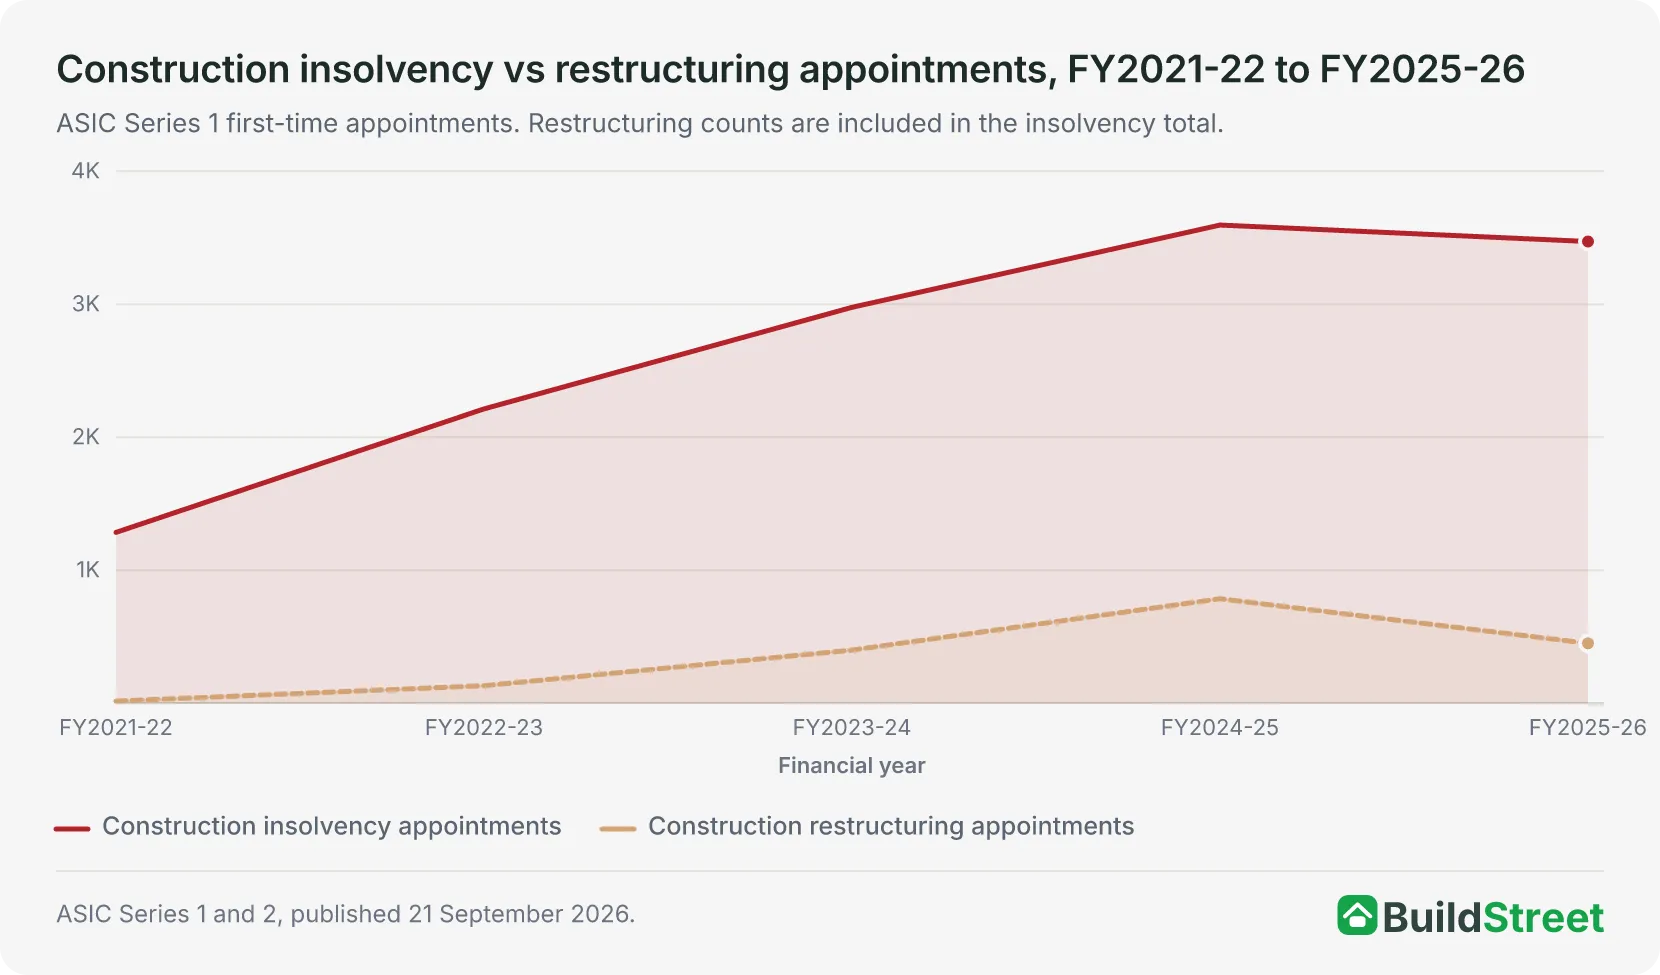
Construction company failures rose from 1,284 in 2021-22 to 3,596 in 2024-25, a 180% increase in three years, before easing to 3,472 in 2025-261. Construction remained the single largest industry for insolvency appointments and accounted for 24.5% of all appointments in 2025-26.
The surge was not a simple post-pandemic catch-up. It was the result of a chain reaction: a demand boom, a materials cost shock, fixed-price contracts that locked in prices before costs rose, and a cash-flow squeeze that took years to force companies into formal administration.
The chain reaction that drove failures
HomeBuilder stimulus and ultra-low interest rates increased demand for residential builders in 2020, just as global supply chains began to break down. Timber prices rose sharply, followed by steel. Builders locked into fixed-price contracts then faced higher input costs without the ability to fully pass them on. Margins narrowed, cash buffers weakened, and the financial pressure built before many companies entered formal insolvency.
Why insolvencies kept rising
Material cost pressures began easing from 2023, but builder insolvencies continued to rise. Labour costs remained elevated, the ATO resumed stronger enforcement of deferred tax debts from January 2024, and finance costs increased as the RBA raised interest rates. As larger builders adjusted or exited earlier, financial stress increasingly shifted toward subcontractors and property developers.
 What happens when a home builder becomes insolvent in Australia?When a residential builder becomes insolvent mid-build, the amount a homeowner may recover depends on the state or territory, the contract date, the certificate and the way the builder failed. Austral…
 Public liability and construction insurance requirements for Australian buildersTasmania expressly makes public liability and contract works insurance a condition of holding specified builder licences, with a minimum public liability indemnity of $5 million for any one claim. Vic…
Section 01 · The scale of the rise
Construction insolvencies rose faster than industry growth
The clearest way to understand the post-2020 increase in insolvencies is to compare company failures with the size of the industry itself. The ABS counted 463,048 actively trading construction businesses at 30 June 2025, up just 2.2% year-on-year.2 Over the same period, Australian Securities and Investments Commission (ASIC) first-time external administrations in construction rose far more quickly, meaning failures significantly outpaced industry growth.
Across all industries, administrations increased from 4,912 in 2021–22 to 14,722 in 2024–251. ASIC reported the overall share of companies entering administration reached 0.41% in 2024–25, up from 0.33% the year before. Construction accounted for much of that increase, and it still made up 24.5% of all appointments in 2025–26, when the all-industry total eased to 14,153.
Between 2021–22 and 2024–25, construction services insolvencies rose 197%, residential building construction insolvencies increased 157%, and insolvencies across the full construction division rose 180%. The increase extended well beyond large builders and moved through the broader subcontracting chain.
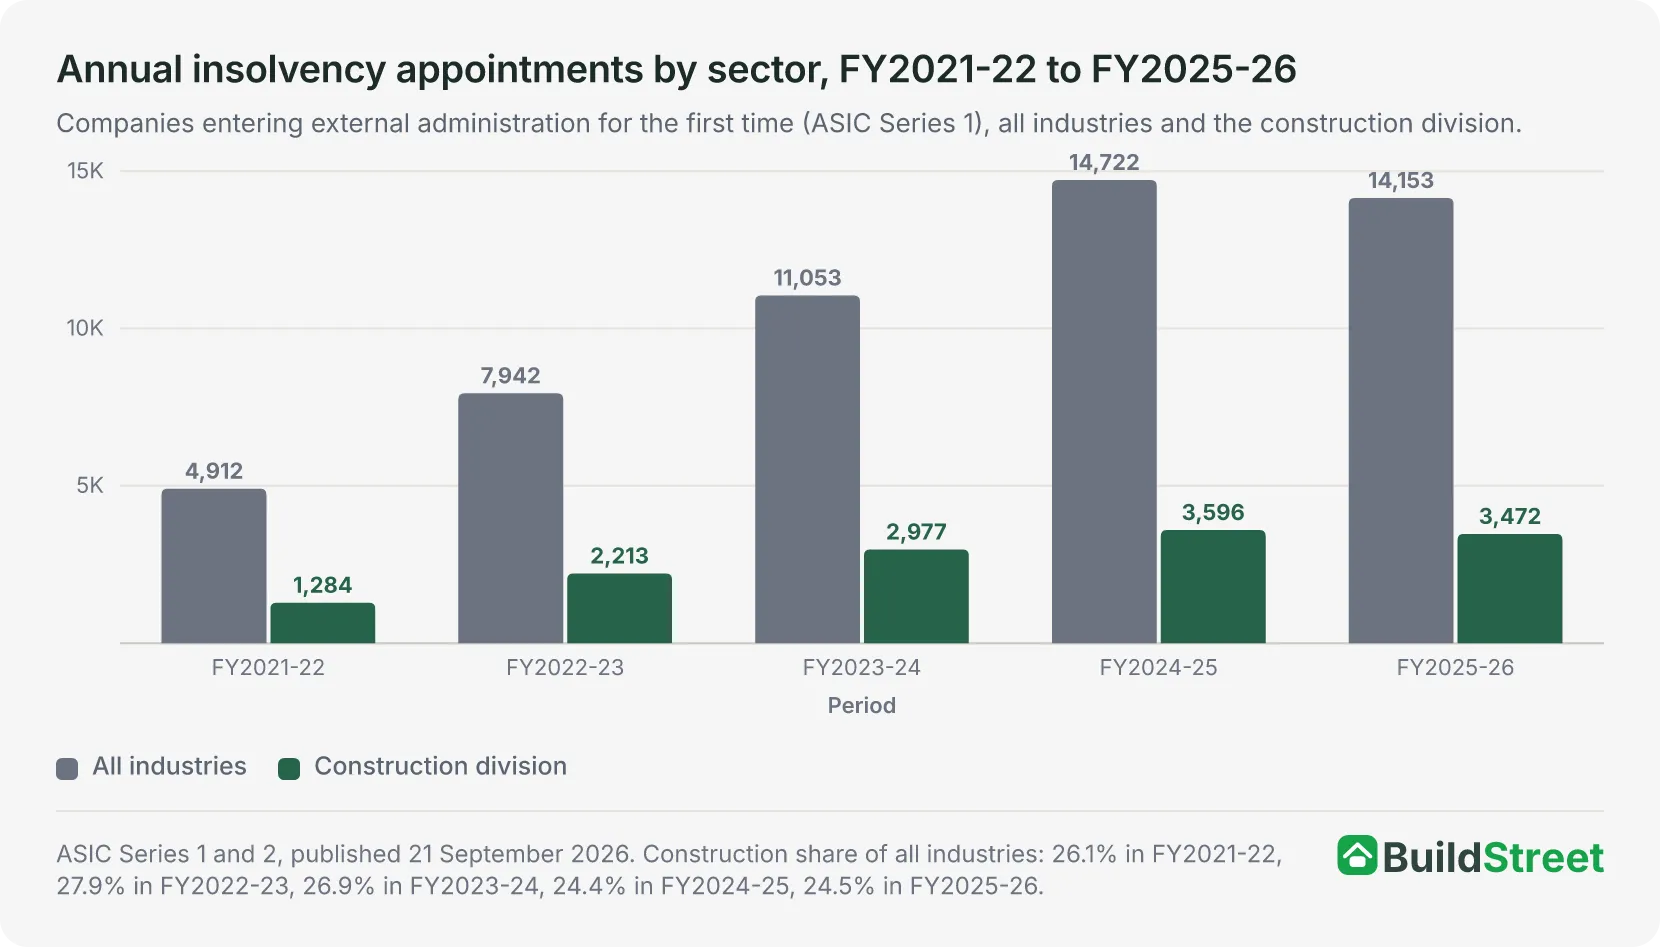
| Period | All industries | Construction division | Residential building | Construction services |
|---|---|---|---|---|
| FY2021-22 | 4,912 | 1,284 | 319 | 848 |
| FY2022-23 | 7,942 | 2,213 | 567 | 1,409 |
| FY2023-24 | 11,053 | 2,977 | 712 | 2,010 |
| FY2024-25 | 14,722 | 3,596 | 819 | 2,521 |
| FY2025-26 | 14,153 | 3,472 | 712 | 2,487 |
Source · ASIC Series 1 and 2, published 21 September 2026. Construction services includes subcontract trades.
| Month | All industries | Construction | Residential building |
|---|---|---|---|
| January 2026 | 634 | 152 | 29 |
| February 2026 | 1,260 | 307 | 55 |
| March 2026 | 1,306 | 319 | 65 |
| April 2026 | 1,102 | 308 | 65 |
| May 2026 | 1,104 | 255 | 45 |
| June 2026 | 1,334 | 339 | 61 |
Source · ASIC Series 1 and 2, published 21 September 2026.
Between 2021-22 and 2024-25, construction services failures rose 197%, residential building construction rose 157%, and the full construction division rose 180%. The insolvency wave moved through the entire subcontracting chain, not just large builders.
Section 02 · The demand boom
HomeBuilder and low interest rates drove a demand boom
The rise in insolvencies followed an earlier increase in residential construction demand. The federal government introduced the HomeBuilder grant during the pandemic, while interest rates were at historic lows and more households were seeking detached homes. Together, these factors helped drive a sharp increase in new house approvals, which peaked in March 2021.
That surge quickly filled builders' order books. Build queues lengthened, labour demand tightened, and builders became exposed when costs rose on projects already priced.
Demand softened through 2022 as government incentives wound down, interest rates rose, affordability weakened, and build times lengthened.
How HomeBuilder concentrated risk
The HomeBuilder grant was $25,000 for eligible new builds. Approximately 120,000 applications were received. That pipeline of funded projects entered the construction queue at roughly the same time, meaning a cost shock arriving after contract signing would affect a very large number of projects simultaneously with no ability to reprice.
The rate-hiking context
The RBA lifted the cash rate by 425 basis points between May 2022 and November 2023, from 0.10% to 4.35%. For builders and developers carrying debt during construction, this represented a sharp increase in holding costs at the same time as material costs were already elevated. Both pressures operated on the same balance sheet simultaneously.
Section 03 · Fixed-price contracts
Fixed-price contracts and how rising costs became losses
The most important structural pressure in residential construction was the use of fixed-price contracts. Builders usually agree to a price up front, and that price cannot easily be renegotiated if costs rise during construction.
In normal conditions, this is manageable. But when material costs rose sharply from early 2021, thousands of projects were already underway at earlier prices. Longer build times also increased the gap between progress payments, reducing cash flow while costs continued to build.
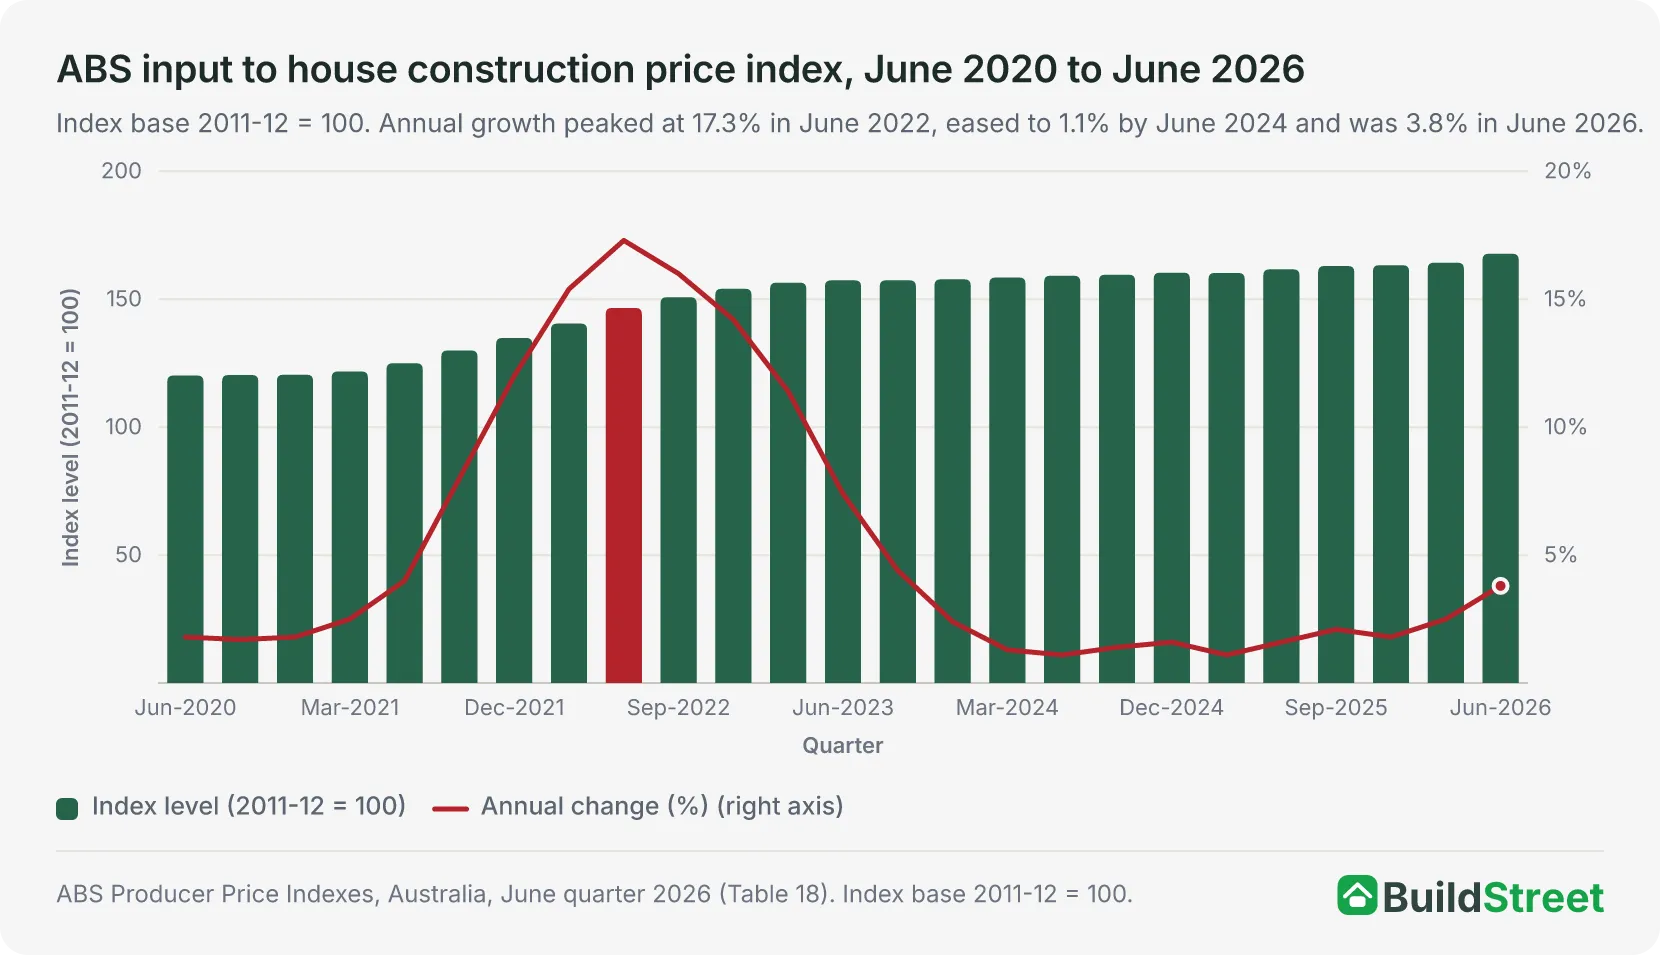
Key events in the cost-and-insolvency cycle
June 2020
2020Pandemic onset. HomeBuilder launched.
Input price index at 120.2. Ultra-low interest rates and stimulus grants flood residential builders with demand just as global supply chains begin breaking down.
Late 2021
2021Early supply shock, running at 8 to 12% p.a.
Global shipping constraints and material shortages push input costs sharply above pre-pandemic norms. Timber prices doubled within months. Steel followed.
June 2022
PEAKAnnual growth peaks at 17.3% p.a.
Timber and steel hit records simultaneously. Labour locked into multi-state backlogs. Builders on fixed-price contracts absorb losses with no recourse. Index reaches 146.6.
May 2022 onwards
2022RBA begins rate-hiking cycle.
Cash rate rises 425 basis points to 4.35%. Finance costs for builders and developers surge in parallel with materials pressure.
2022-23
2023Insolvencies reach 2,213, up 72% on the prior year.
Even as the rate of cost growth decelerates, formal collapses accelerate. Businesses that became effectively insolvent in 2021-22 are now entering administration.
January 2024
ATOATO enforcement resumes.
Debt referrals to external collectors begin. Total collectable ATO debt grew 5.2% in 2023-24. Businesses that deferred PAYG, superannuation and GST obligations face a new and immediate catalyst for formal administration.
June 2026
2026Index: 167.8, up 3.8% p.a.
Input growth is far below its 2022 peak, though it picked up in the June quarter, and the index is 39.6% above its June 2020 level. The new cost baseline is permanently higher. Insolvency appointments in the first half of 2026 ran below the same months of 2025, and 2025-26 was the first full year to fall after three years of increases.
Source · ABS PPI (Cat. 6427.0); ASIC Series 1 and 2; RBA Financial Stability Review, October 2022.
Section 04 · Cash-flow pressure
How cash-flow pressure pushed builders into insolvency
Cost increases on fixed-price contracts do not usually appear as insolvencies straight away. They tend to appear first as cash-flow pressure. A builder losing money on a project still has to keep the site running, pay subcontractors, meet payroll and service debt. Losses can build while the company continues trading.
The RBA's 2022 review found that builders typically had liquidity buffers of less than three months of turnover. This was roughly 25% lower than comparably sized businesses in other industries.4 Around 40% of the median builder's liabilities were short-term unsecured trade credit, which was approximately double the share recorded by other businesses.
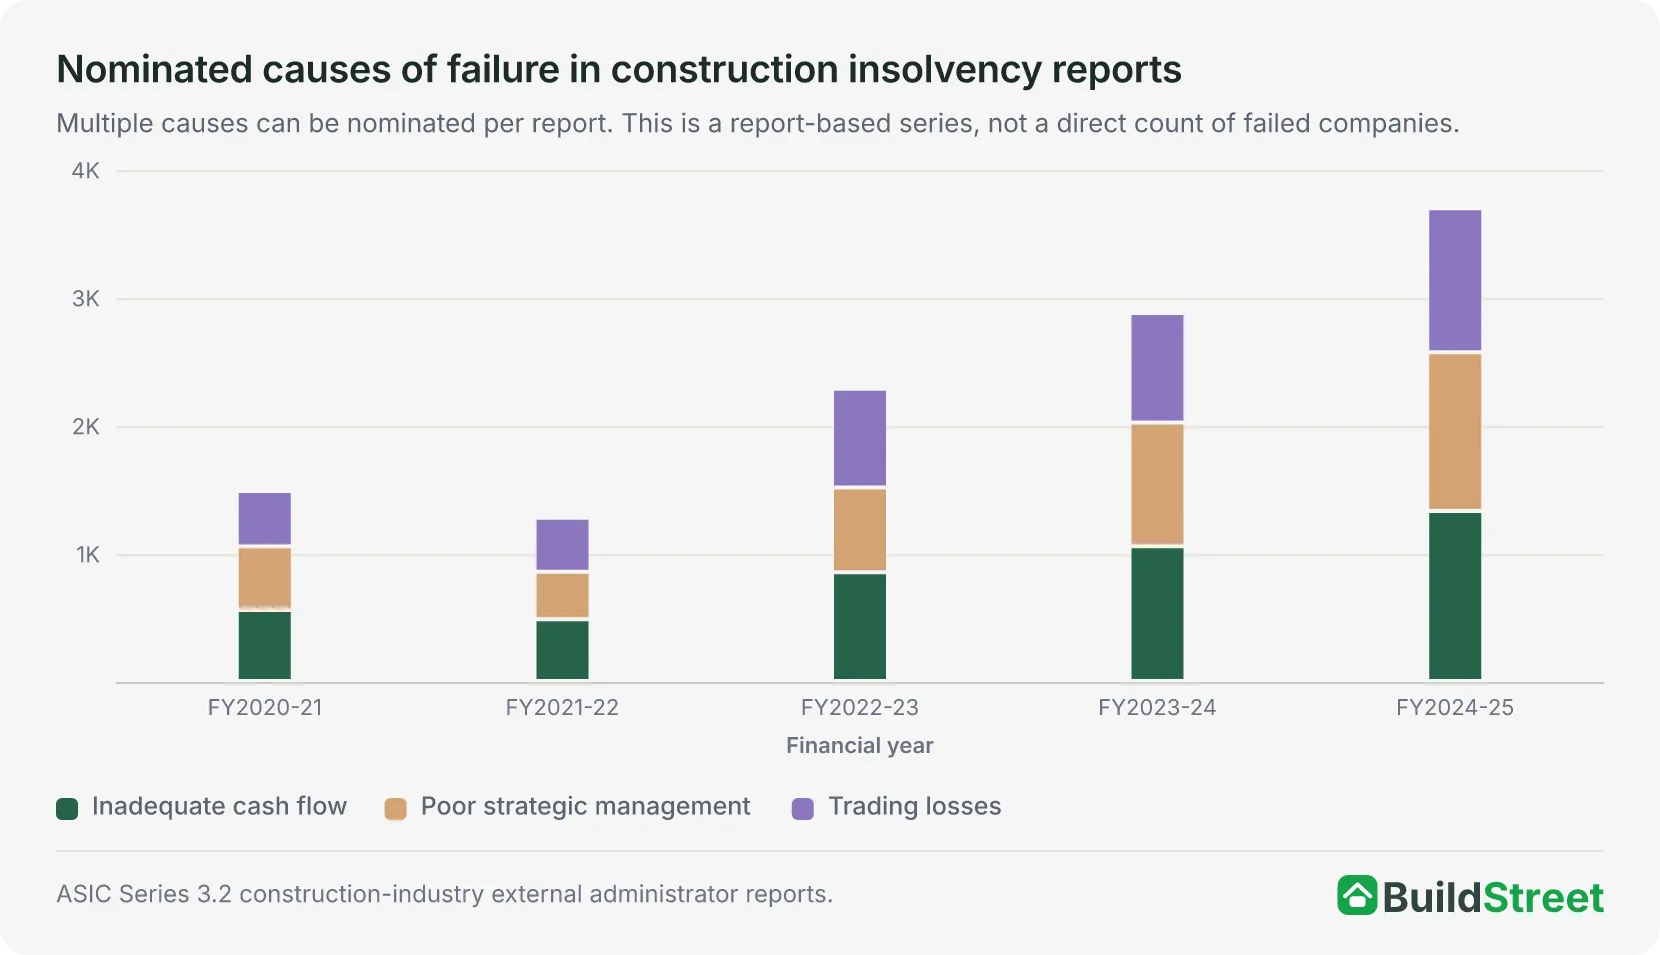
By 2024–25, non-payment of PAYG withholding, superannuation guarantee, and GST appeared as an indicator in 83.2% of construction reports alleging insolvent trading.5 The share of construction insolvency reports where a company was assessed as having become insolvent more than two years before formal appointment also rose from 33.1% in 2020–21 to 55.1% in 2024–25.
| Financial year | Total reports | Inadequate cash flow | Poor strategic mgmt | Trading losses |
|---|---|---|---|---|
| FY2020-21 | 953 | 556 | 499 | 431 |
| FY2021-22 | 919 | 483 | 371 | 422 |
| FY2022-23 | 1,541 | 850 | 663 | 772 |
| FY2023-24 | 1,952 | 1,055 | 967 | 856 |
| FY2024-25 | 2,361 | 1,330 | 1,241 | 1,124 |
Source · ASIC Series 3.2.
Section 05 · Beyond materials
Why construction insolvencies remained elevated after material costs peaked
Construction insolvency appointments continued rising into 2024–25 even after material inflation slowed. By then, financial pressure had broadened beyond material costs to include labour expenses, higher interest rates, weaker trading conditions and renewed tax enforcement activity.
This shows the pressure was no longer just about material costs. By then, several other factors were weighing on the sector, including the end of pandemic support, weaker trading conditions as the economy slowed, and the ATO restarting enforcement on unpaid tax debts. The pressure was felt most strongly by construction firms and property developers. At the same time, failures among larger residential builders were starting to ease.
ATO enforcement resumed in January 2024.
After a pandemic-era pause, the ATO began referring outstanding debts to external collectors. Total collectable ATO debt grew 5.2% in 2023-24 and a further 2.8% in 2024-25. For construction businesses that had deferred PAYG withholding, superannuation and GST obligations through the crisis, this represented a new and immediate catalyst for formal administration on top of existing trading difficulties.
Labour costs stayed high as building prices rose 4.9% p.a.
Building-construction output prices were still rising at 4.9% annually to June 2026, with labour cited as a key ongoing driver by the ABS. Unlike materials, which are globally traded and subject to international price signals, wages in a domestic trade-shortage environment are stickier and less responsive to reduced activity levels.
Finance costs rose approximately 300 basis points.
The rate-hiking cycle from May 2022 lifted borrowing costs sharply for both builders and the developers who commission their work. Development projects financially viable at 2021 borrowing rates became unviable after rates rose. Lenders requiring pre-sales on apartment projects found buyers reluctant to commit, constraining supply and concentrating risk among mid-rise developers.
Section 06 · The restructuring cycle
Small business restructuring became a pressure release
Not every distressed construction company went straight into liquidation. From 2021, ASIC's small business restructuring process gave eligible companies a way to restructure debts while remaining under director control.
- FY2022-23
- 447
- All-industry restructuring appointments, up from 70 in FY2021-22
- FY2023-24
- 1,424
- Up 219% on the prior year
- FY2024-25
- 2,918
- Peak year, up 105% on the prior year
- FY2025-26
- 1,714
- Down 41% on FY2024-25
Of the restructuring plans sent to creditors, 87% were approved.6 Of the plans completed by 30 June 2024, 89.4% of companies remained registered. This means the post-2020 period should be read as both an insolvency cycle and a restructuring cycle, with sector-wide balance-sheet repair taking place alongside company failures.
| Financial year | Construction insolvency appointments | Construction restructuring appointments | Ratio restructuring : insolvency |
|---|---|---|---|
| FY2021-22 | 1,284 | 15 | 1:86 |
| FY2022-23 | 2,213 | 131 | 1:17 |
| FY2023-24 | 2,977 | 399 | 1:7 |
| FY2024-25 | 3,596 | 785 | 1:5 |
| FY2025-26 | 3,472 | 450 | 1:8 |
Source · ASIC Series 1 and 2, published 21 September 2026.
Section 07 · Practical impact
How builder insolvency affects new home projects
With 3,472 construction companies entering external administration in 2025–26, and insolvency rates well above pre-pandemic levels, the risk of a builder failing mid-project has increased compared with five years ago.
Builder financial health
A builder's quote, plans and display homes show the type of work they offer. Their financial position is also relevant because it may affect whether the project can be completed as agreed. With construction insolvencies still well above 2021 levels, checks of the relevant state licensing register and recent trade references are commonly used to assess builder risk before contract signing.
Fixed-price contract risks
A fixed-price contract may limit some cost increases, but the final price can still change. Many contracts include variation clauses, prime-cost items and provisional sums. These can increase the amount paid if selections, site conditions or allowances change.
Deposit and payment protections
Most states limit upfront deposits and require protections for certain residential building contracts. Domestic building insurance can provide a backstop if a builder fails before completion, although eligibility rules, claim timeframes and coverage limits vary by state.
Builder workload and pipeline length
Builders under pressure were often managing large volumes of committed work in a difficult cost environment. Long queues and extended build times can increase project delivery risk, particularly where builders are carrying multiple projects at once.
Section 08 · Methodology
About the data
The ASIC broad construction division includes builders, subcontractors and other construction firms. This article separately compiles the residential building construction group from ASIC's detailed Series 1 dataset, but cause-of-failure tables are only available at the broader construction industry level.
ASIC Series 3.2 is based on initial external administrators' and receivers' reports, not the company-count insolvency series. Multiple causes can be nominated in each report. Those tables are best read as evidence on the character of failures, not as a count of failed companies.
The cleanest builder-specific company-count series in the current ASIC detailed workbook runs from 2021-22 onward. Rebuilding a fully consistent long-run residential-builder series would require additional extraction from older ASIC files.
References
- ASIC, Australian insolvency statistics, Series 1 and 2, published 21 September 2026 · download.asic.gov.au ↑ b
- ABS, Counts of Australian Businesses, including Entries and Exits, July 2022 to June 2026, Data cube 1 (8165DC01.xlsx) · Australian Bureau of Statistics ↑
- ASIC insolvency statistics, Series 1, 2 and 3.2 · asic.gov.au ↑
- RBA Financial Stability Review, October 2022, Box C: Financial stress in residential construction · Reserve Bank of Australia ↑
- Australian Securities and Investments Commission, Insolvency Statistics Series 3.2: selected industries, 2024-25 · download.asic.gov.au ↑
- ASIC Report 810, Small Business Restructuring Review, June 2025 · asic.gov.au ↑
- RBA Financial Stability Review, September 2024, Resilience of Australian Households and Businesses · Reserve Bank of Australia
- ABS Counts of Australian Businesses, Including Entries and Exits, June 2025 · Australian Bureau of Statistics
- ABS Insights: Output of building construction prices · Australian Bureau of Statistics
- ABS Producer Price Indexes, Australia, June 2026 (Cat. 6427.0) · Australian Bureau of Statistics
