

Published 26 June 2026 · Updated 23 Sept 2026
Building a new house in Australia now costs an average of $474,939, up 37.5% since 2019–20. Construction inflation has cooled since the 2022 peak, but build costs have not gone backwards. Homes are still getting more expensive to build, just at a slower pace.
Market conditions are more stable than they were in 2022 and 2023. Quotes are becoming more available, build times have improved, and approvals are rising again. But homebuyers still face three major risks: trade shortages, builder insolvencies and tighter lending conditions. Contract terms also matter, with variations, provisional sums and prime-cost items still able to push final costs above the original quote.
 Australian building material costs: how much prices have increased since 2020Building material costs are still rising, but much more slowly than during the pandemic cost surge.
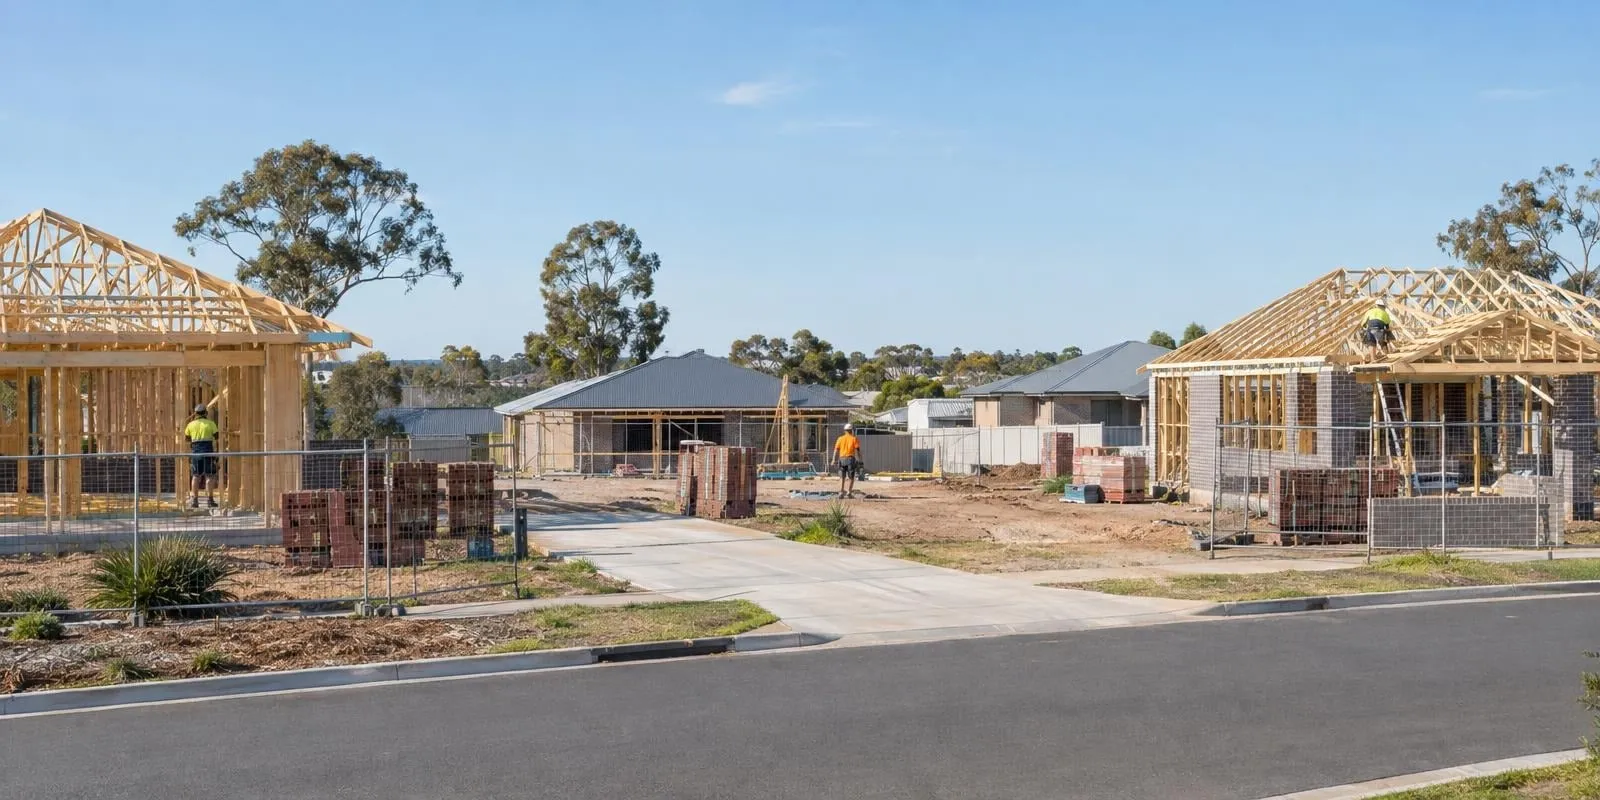 Why builder insolvencies increased after 2020Construction company failures rose from 1,284 in 2021-22 to 3,596 in 2024-25, a 180% increase in three years, before easing to 3,472 in 2025-26. Construction remained the single largest industry for i…
Section 01
Are building costs increasing in 2026?
Building costs rose after 2020, and the increase has not reversed. The government's Producer Price Index shows house construction prices rose 40.8% between September 2020 and June 20241. Annual growth then slowed to 0.3% in the year to June 2025, but it has picked up again since.
By June 2026, house construction prices were up 5.9% year-on-year, the highest annual rise since mid-20232. Input prices, which measure the building materials builders pay for, rose 3.8% over the same period.
There are two useful ways to read the data. The CPI measure tracks what homeowners pay for new dwellings, excluding land, and rose 5.8% in the year to June 20263. The Producer Price Index tracks what builders receive for new house construction, making it a better guide to industry cost pressure. That rose 5.9%. Both measures are still increasing. Neither shows costs falling.
Material inflation has cooled since the pandemic peak, but not every input has moved in the same direction. Some major building materials are still rising, while others have stabilised or returned closer to normal. The split matters because these inputs appear across almost every stage of a home build, from foundations and framing to wiring, plumbing and finishes.
Section 02
Home starts are still running ahead of completions
Australia's housing pipeline is improving, but the increase has not yet flowed through to finished homes. New dwelling approvals reached 18,365 in July 2026, up 11.7% on the same month a year earlier4. This is the ABS trend estimate, which smooths month-to-month volatility; the seasonally adjusted figure for the same month was 17,687, reflecting a 3.6% monthly fall after a strong June.
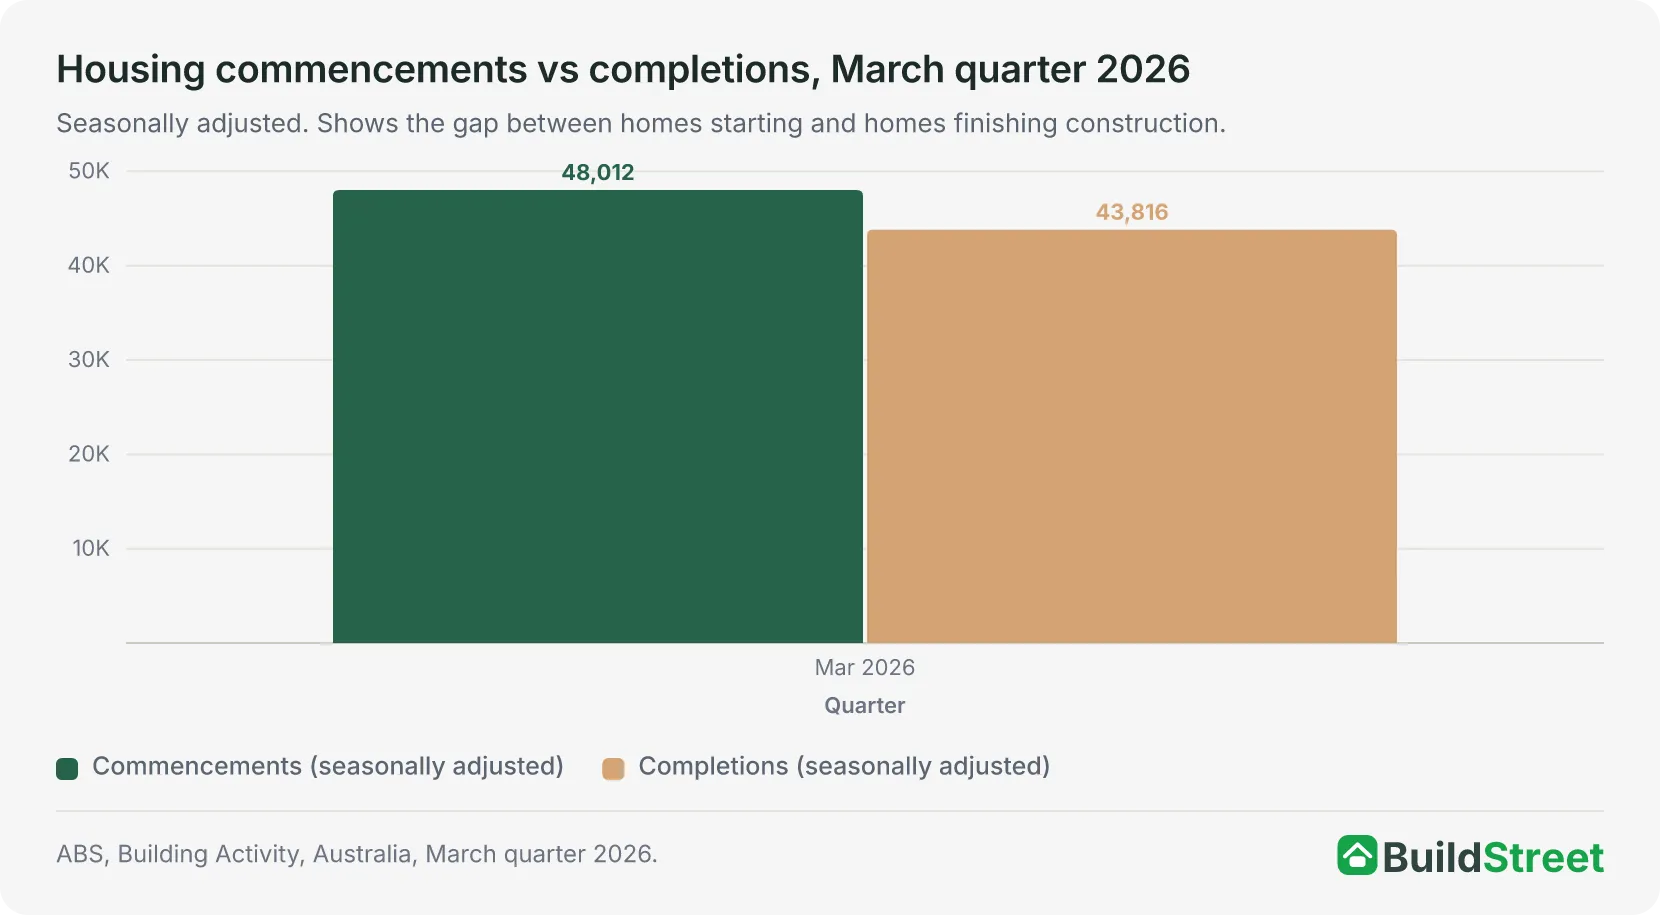
Commencements have been more volatile. 48,012 homes started construction in the March quarter of 2026, down 11.2% after a strong December quarter but 0.2% higher than a year earlier5.
Since the National Housing Accord began in mid-2024, 219,000 new homes have been completed over five quarters, while real building costs have fallen 0.9% compared with the period immediately before the Accord6.
The bottleneck is completions. Only 43,816 homes were finished in the March quarter of 2026, up just 0.8% year-on-year.5 More homes are entering the construction pipeline than leaving it as completed dwellings. Until completions rise, finished housing supply will continue to lag demand.
Section 03
National Housing Accord — when each state is expected to meet its building target
The National Housing Accord aims to deliver 1.2 million new homes by 2029, but progress is uneven across Australia. Current projections suggest some states are broadly on track, while others are facing much larger housing supply shortfalls.
September 2029
Victoria and Western Australia
On track to reach their share of the national target by the original deadline.
September 2030
Queensland and South Australia
Running about one year behind. People are moving to these states faster than homes are being built.
June 2030
Australia (national)
The country as a whole is projected to hit the target about one year late.
After 2034
Northern Territory
More than five years behind schedule. The worst housing supply shortfall of any state or territory.
Source · National Housing Supply and Affordability Council, Quarterly Report, March 2026.
Section 04
Build times are longer than before the pandemic
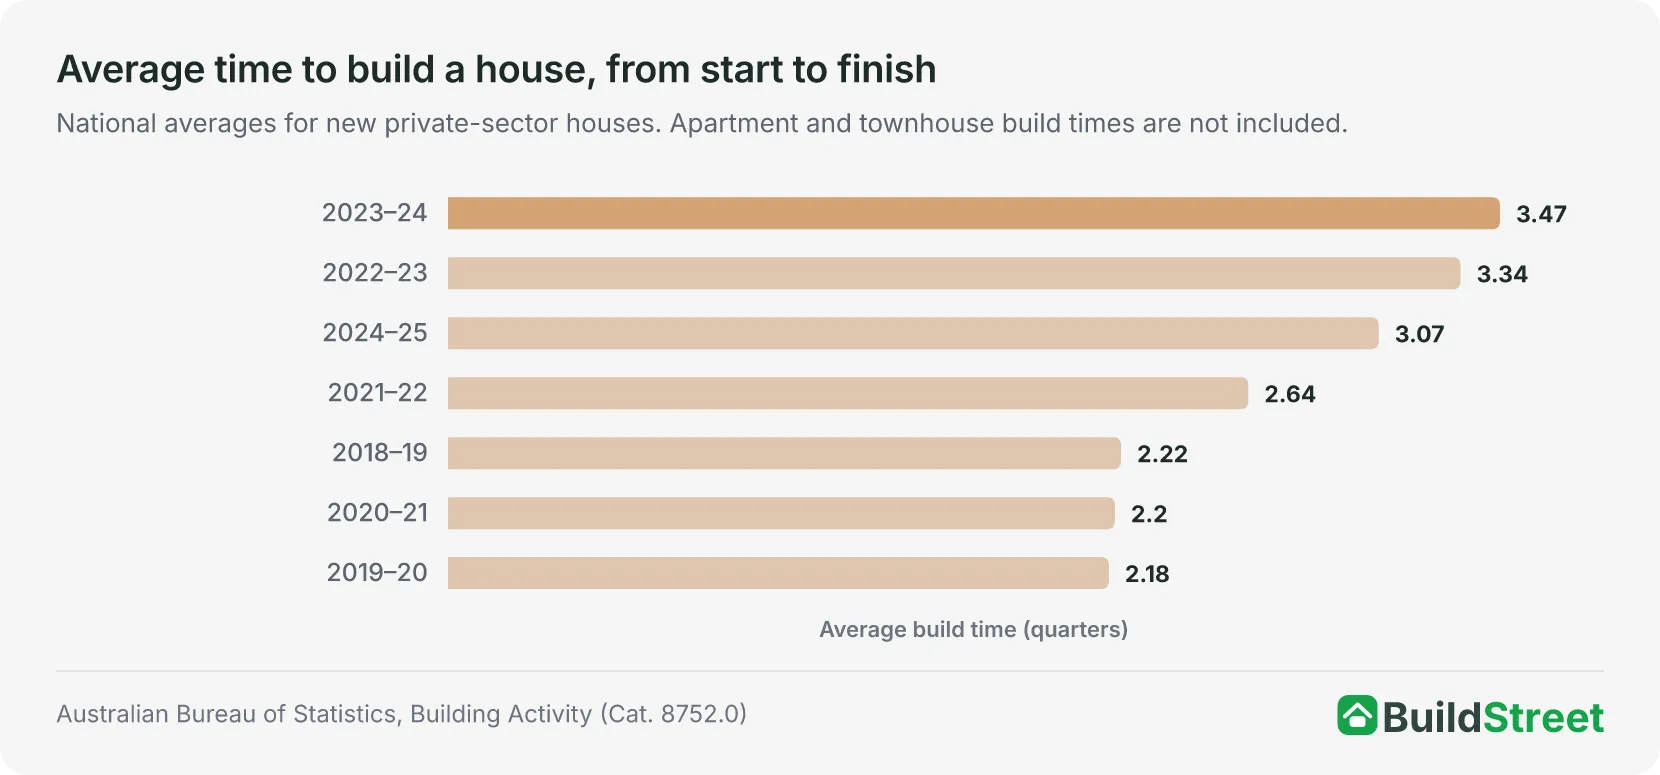
The average new house took about nine-and-a-half months to build in 2024–25, or 3.07 quarters. That is an improvement on the 2023–24 peak of 3.47 quarters, but still 38% longer than the pre-pandemic average of around seven months, or 2.22 quarters.
Every extra month a build runs costs money that does not show up in the original quote. Those costs include:
- rent paid while waiting to move into the new home
- interest charged on the construction loan during the build
- longer exposure to price increases while the project is still running
Construction employment reached 1,371,500 in February 2026, the highest on record. However, labour-market pressure remains elevated, with construction job advertisements still running 25% above the 2019 average. Infrastructure Australia has identified $242 billion worth of major public infrastructure projects planned or underway over the five years to 2028–29, including roads, hospitals, housing and energy projects7. These projects may compete with residential construction for some skilled trades, depending on location and trade type.
Section 05
Fixed-price building contracts can still include extra costs
Fixed-price building contracts can still change because many residential contracts include allowances, provisional sums and variation clauses that allow some costs to be adjusted during construction.
Most residential building contracts are described as "fixed-price". In practice, many contracts do not lock in every possible cost. Some include clauses that allow the builder to pass certain extra costs on to the client. Three common contract items can increase the final build price: prime cost items, provisional sums and statutory variations.
In 2024–25, 2,361 construction businesses filed initial external administrator reports8, which is the first formal step when a business can no longer pay its debts. This was roughly one in four of all such reports filed by businesses in Australia that year, the highest share of any industry.
Build times are also still running 38% longer than before the pandemic. In this environment, building contract terms can have a larger effect on the final cost paid by the client.
Prime cost items
Things not yet chosen when the contract is signed, including taps, tiles, appliances, light fittings. The contract includes a set dollar allowance for each one. If the final selection costs more, the difference is added to the bill.
Allowances are often set too low. Check all against current retail prices before the contract is signed.
Provisional sum items
Work where the exact cost is not known upfront; excavation, rock removal, drainage, connecting services to the block. An estimate is included, but the final charge is based on actual cost.
The most common cause of cost overruns. On sloping or difficult blocks, actual cost may exceed estimate by tens of thousands of dollars.
Statutory variations
Most contracts allow the builder to pass on extra costs if laws change, building standards are updated, or unexpected site conditions are discovered during construction.
These clauses are legal and common. They mean the contract price is not the maximum amount that will be charged.
If a builder goes bust mid-project, the client is left with an unfinished home. Getting a new builder to finish the job typically costs significantly more, and any deposits already paid may be lost. Common pre-contract verification steps include:
- Check the builder's licence is current and valid
- Confirm the builder holds home warranty insurance
- Review recently completed projects
Section 06
Which states have the fastest-rising building costs?
Tasmania recorded the highest building cost increases of any state, at +11.5% in the year to June 2026, followed by Western Australia at +8.8%2. High costs and high demand are not always happening in the same place. Western Australia and Queensland are the exceptions — both have fast-rising costs and strong population growth at the same time.
Western Australia
- Building cost rise
+8.8%
One of two states, along with Queensland, with both high cost increases and high population growth. About 51,000 people moved to WA from overseas or other states in the year to Sep 2025. Avg home price: $1.104 million.
Tasmania
- Building cost rise
+11.5%
Highest building cost increase of any state in the year to Jun 2026. Tasmania has fewer builders and less capacity, so a rise in demand puts upward pressure on prices.
Queensland
- Building cost rise
+8.0%
About 76,000 people moved to Queensland in the year to September 2025. House construction prices rose 8.0% over the year to June 2026, above the national rise of 5.9%. SEQ may still face trade pressure from Olympics-related infrastructure work.
New South Wales
- Building cost rise:
Below national average
More people left NSW than arrived in the year to Sep 2025. Even so, NSW has the highest average home prices in the country at $1.325 million.
Victoria
- Building cost rise:
Below national average
Victoria is on track to meet its housing target by September 2029. New home approvals are still rising. The state recorded below-average building cost growth in the data cited.
Even within Queensland and Western Australia, there are big differences between cities and regional areas.
In Queensland, the Olympics-related building work is mainly in South East Queensland — Brisbane, the Gold Coast and the Sunshine Coast. That is where competition for tradespeople is most intense. In regional Queensland towns such as Townsville and Cairns, the pressure comes from defence and resources projects, and building costs in some of those areas are rising faster than the state average.
In Western Australia, large mining and energy projects in the Pilbara region and the north-west draw workers away from Perth through fly-in, fly-out arrangements. This pulls tradespeople out of the Perth housing market for extended periods, which affects pricing and availability across the whole state.
Section 07
Building vs buying: which is cheaper in 2026?
Using national land, build-cost and established-home price measures, the estimated land-and-build cost has been lower than the established-home price measure each year since 2015. In 2025, the size of the gap depends on the land-price measure used.
The comparison combines a national land-price measure with the ABS average cost to build a new house, then compares that estimate with the ABS mean residential dwelling price. In the March quarter of 2026, the mean price of a residential dwelling in Australia was $1.111 million9. The average cost to build a new house was $474,939 in 2024–25, excluding land. Land costs vary significantly by location, so the final land-and-build total cannot be represented by a single like-for-like national figure.
The gap needs careful reading. New land is often located 30 to 50 kilometres from the city centre, in outer suburban estates. Established homes are spread across inner and middle suburbs, where schools, public transport, shops and services are already in place. Part of the price difference is therefore a location difference, not just a build-cost difference.
Note: the established-home figure is a national mean dwelling price, while the land-and-build estimate uses a national land-price measure combined with an average build cost. These are not directly comparable measures, so the comparison should be read as an indicative national estimate rather than a like-for-like price comparison.
Stamp duty can make building cheaper than buying
Building can have a clear stamp duty advantage when land is purchased separately and the home is built later. In that case, stamp duty is usually charged on the land value rather than the full completed property value. In New South Wales, that difference is roughly $47,000. Stamp duty on a typical Sydney block is about $24,800, compared with about $71,450 on a median established home. First-home buyers may also be eligible for state grants. Queensland offers up to $30,00010, while South Australia offers up to $15,00011, subject to eligibility rules, property price caps and residency requirements.
| Factor | New build | Existing home |
|---|---|---|
| Is the price locked in from the start? | No — costs can change during the build | Yes — the price is agreed at contract |
| How long until move-in? | 12 to 24+ months from signing | 30 to 90 days from exchange |
| Stamp duty (NSW example) | About $24,800 on land only | About $71,450 on the full price |
| Costs while building | Ongoing rent plus loan repayments for 12–18 months | None — move in straight away |
| Energy efficiency | 7-star minimum rating for all new builds | Often 2 to 4 star — higher power bills |
| Location | Usually outer suburbs or new estates | Established areas with existing schools and services |
| Risk if builder fails | Serious — construction leads all industries for failures | None once the purchase settles |
Source · ABS Total Value of Dwellings; Revenue NSW stamp duty calculator.
One cost that rarely appears in comparisons is the cost of continuing to pay rent while waiting for a build to finish.
For example, someone paying $500 per week in rent during a 14-month build would spend roughly $30,000 to $50,000 in extra housing costs before moving in. Actual costs depend on rent amount, loan size and interest rate. In markets where building is only slightly cheaper than buying, such as Tasmania and Darwin, these extra costs can make building the more expensive option overall.
Section 08
Average apartment construction value is up 50% since 2020 in NSW, Victoria and Queensland
Across NSW, Victoria and Queensland, the average construction value per completed apartment rose 50.6% between 2019–20 and 2024–25, reaching $567,947. This is a derived average based on ABS Building Activity construction value and completion data, not a direct apartment price index.
Despite this, the total value of apartment construction completed in 2024–25 was $20.7 billion, which is still below the 2017 peak of $21.2 billion, even though Australia's population has grown since then.
Two factors are contributing to lower apartment construction activity.
Build costs are high. Mid-rise apartments often cost more per dwelling than the average suggests because the build includes shared spaces, lifts, fire safety systems and car parking. A 2025 independent housing feasibility review by the Centre for International Economics and HIA, Taxation's Major Impact on Housing, found that mid-rise apartment development could not achieve a standard profit margin in any Australian capital city at current prices.
Developers also usually need to sell a large share of apartments before a bank will release construction finance. This is known as a pre-sales requirement and is typically set at 60% to 80% of all units. With interest rates high and buyers more cautious about committing to a home that may be 18 months away, many projects are struggling to reach that threshold. When fewer projects meet pre-sales requirements, fewer projects move into construction.
Section 09
How higher interest rates changed building costs
Higher interest rates have made new builds harder to finance. In the March quarter of 2026, the number of new home loans taken out by owner-occupiers fell 6.9% compared with the previous quarter12. The total value of those loans fell 4.3% over the same period. This covers new lending only and does not include refinancing.
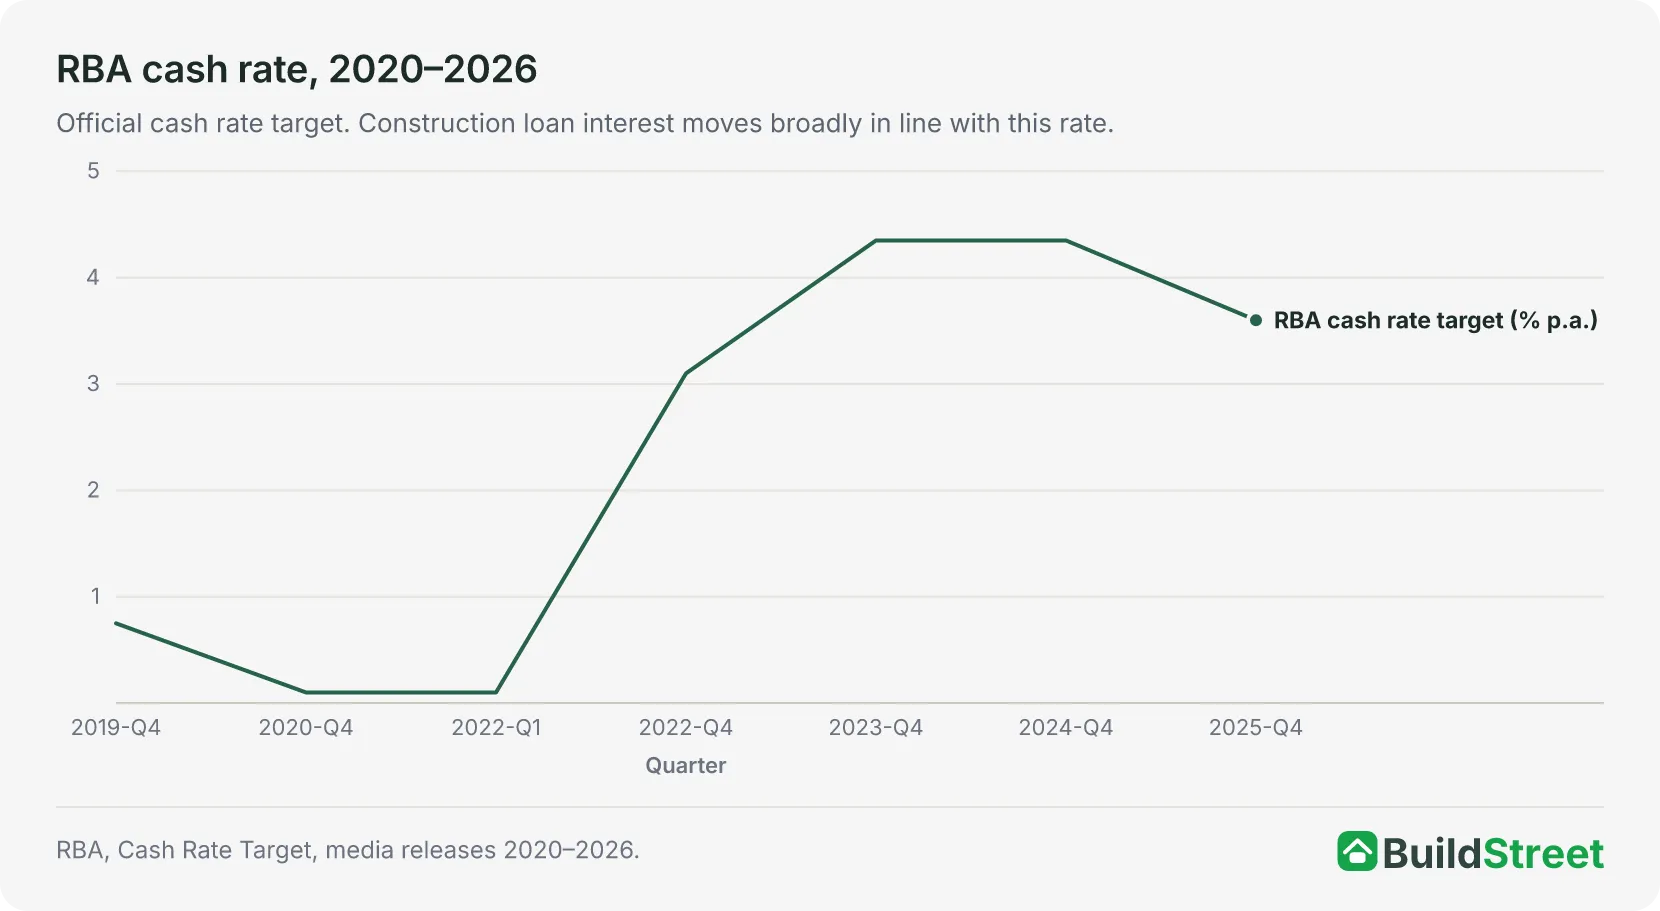
The RBA cut the cash rate to a pandemic low of 0.10% in 2020, then raised it sharply from May 2022, reaching a peak of 4.35% in November 2023. Three cuts followed in 2025, lowering the rate to 3.60% by August. Inflation then picked up materially in the second half of 2025, and the RBA responded with three consecutive hikes in February, March and May 2026, returning the cash rate to 4.35% by May 202613. Most mortgage rates have moved broadly in line with this path.
2020 — what borrowing looked like
- Official interest rate
0.10%
- Typical home loan rate
2.5 - 3.0%
- Monthly repayment ($500k, 25yr)
~$1,975
- Average house build cost
$345,410
- Lending safety margin
+3.0 percentage points
May 2026 — what it looks like now
- Official interest rate
4.35%
- Typical home loan rate
5.7–6.3%
- Monthly repayment ($500k, 25yr)
~$3,200 - $3,400
- Average house build cost
$474,939
- Lending safety margin
+3.0 percentage points
Repayment estimates are based on a principal and interest loan at mid-range variable rates. Actual repayments will vary. The lending safety margin (set by the banking regulator APRA) requires banks to check that borrowers could still afford repayments if the interest rate rose by 3 percentage points above the current rate.
The loan itself also needs to be larger. The average build cost has risen $129,529 since 2019–20. With APRA’s 3 percentage point serviceability buffer, a borrower with a mortgage rate of 6.3% to 7.0% may be assessed at 9.3% to 10.0%. That assessment rate reduces the amount a lender will approve, independent of whether the actual rate seems affordable.
Section 10
What the data shows about building conditions in 2026
New home approvals are up 11.7% on a year earlier, and more homes are still starting construction than finishing, even after starts fell 11.2% in the March quarter of 2026. Build times are slowly improving, and conditions for planning a build are more stable than in 2022 and 2023.
The data cited for 2026 shows building costs were still rising, prices remained above pre-pandemic levels, and borrowing conditions were still tighter than in 2020. The costs most likely to affect project budgets are provisional sum items that exceed estimates, extended build timelines that add months of rent, and the financial exposure that comes with builder insolvency.
References
- ABS Insights into Output of Building Construction Prices · Australian Bureau of Statistics ↑
- ABS Producer Price Indexes, Australia (Cat. 6427.0) — latest release · Australian Bureau of Statistics ↑ b
- ABS Consumer Price Index, Australia (latest release, Cat. 6401.0) · Australian Bureau of Statistics ↑
- ABS Building Approvals, Australia (latest release, Cat. 8731.0) · Australian Bureau of Statistics ↑
- ABS Building Activity, Australia, March 2026 (Cat. 8752.0) · Australian Bureau of Statistics ↑ b
- NHSAC Quarterly Report, March 2026 · nhsac.gov.au ↑
- Infrastructure Australia 2025 Market Capacity Report · infrastructureaustralia.gov.au ↑
- Australian Securities and Investments Commission, Insolvency Statistics Series 3.2: selected industries, 2024-25 · download.asic.gov.au ↑
- ABS Total Value of Dwellings, March Quarter 2026 · Australian Bureau of Statistics ↑
- First Home Owner Grant · qro.qld.gov.au ↑
- RevenueSA — First Home Owner Grant · revenuesa.sa.gov.au ↑
- ABS Lending Indicators, March quarter 2026 · Australian Bureau of Statistics ↑
- RBA Cash Rate Target · Reserve Bank of Australia ↑
- Average dwelling completion times · Australian Bureau of Statistics
- ABS, National, state and territory population (latest release) · Australian Bureau of Statistics
- ABS Total Value of Dwellings, March quarter 2026 · Australian Bureau of Statistics
- Reserve Bank of Australia, Cash Rate Target · Reserve Bank of Australia
- APRA, mortgage serviceability buffer guidance · apra.gov.au
- ASIC, External Administrator Reports, 2024–25 · asic.gov.au
- Jobs and Skills Australia, Internet Vacancy Index, April 2026 · jobsandskills.gov.au
- CIE / HIA, Taxation's Major Impact on Housing (2025 Report) · hia.com.au
