

Published 6 Aug 2026
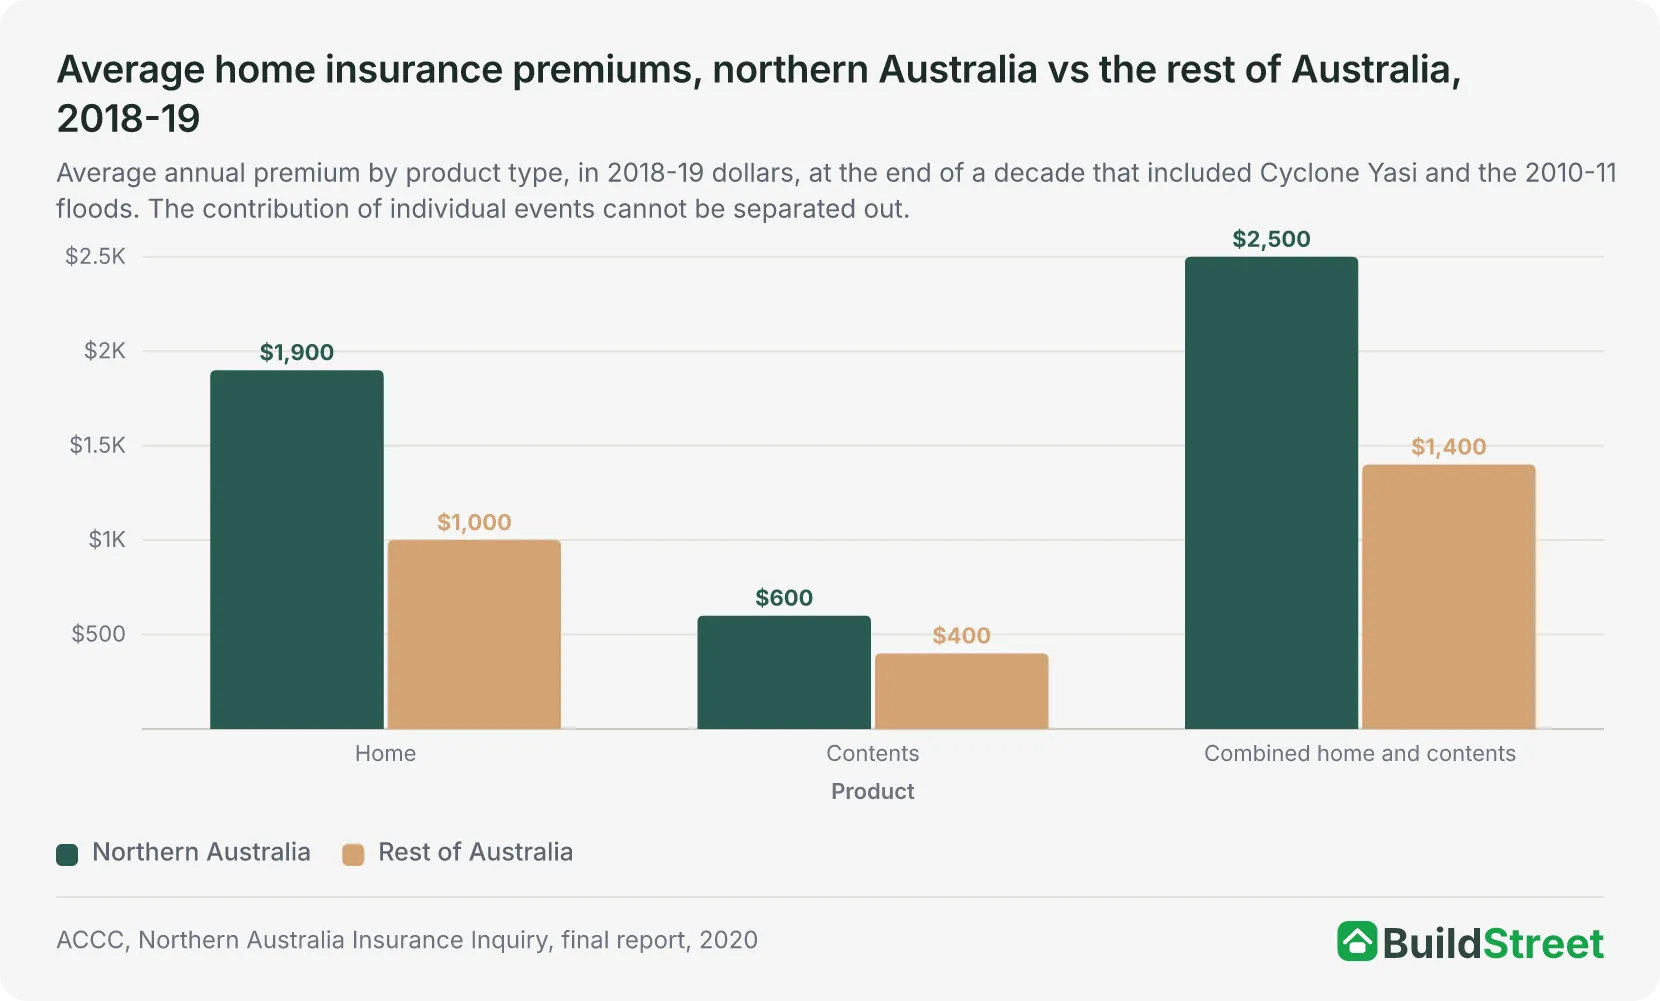
Home insurance premiums in northern Australia rose 178% in real terms between 2007-08 and 2018-19, more than three times the 52% increase recorded across the rest of the country. By 2018-19, the average combined home and contents premium per policy in northern Australia was about $2,500 a year, compared with roughly $1,400 elsewhere.
Nationally, insurance prices then rose 16.4% in the year to March 2024, the largest annual increase since 2001. Growth then slowed, and two capital cities recorded annual declines in insurance prices by February 2026.
The period covered includes major floods, cyclones and increases in reinsurance costs. The available sources do not measure how much each factor contributed to premium growth.
 Climate risk and home insurance in Australia: flood, bushfire and cyclone exposureWeather perils, including storm and hail, flood, bushfire and cyclone risk, account for 28% of the average Australian home insurance premium, making them the largest component of the modelled national…
 Home insurance costs by state in Australia: where premiums are highestHome insurance premiums in Australia vary by location, with homeowners in some regions paying more than double the national average. Using official Australian Competition and Consumer Commission (ACCC…
Section 01 · Measuring the market
How are home insurance premiums measured in Australia?
The average home insurance premium rose 67% in nominal terms over the decade to 2023, from $629 to $1,050 per risk written, based on the most consistent long-term measure available.
This represents an increase of $421 per risk written, in nominal dollars, over a ten-year period.
The figure is a market-wide average derived from APRA industry totals, not a published premium series. No official source tracks home insurance premiums continuously.
Three different measures are used across the article to cover different periods and parts of the market.
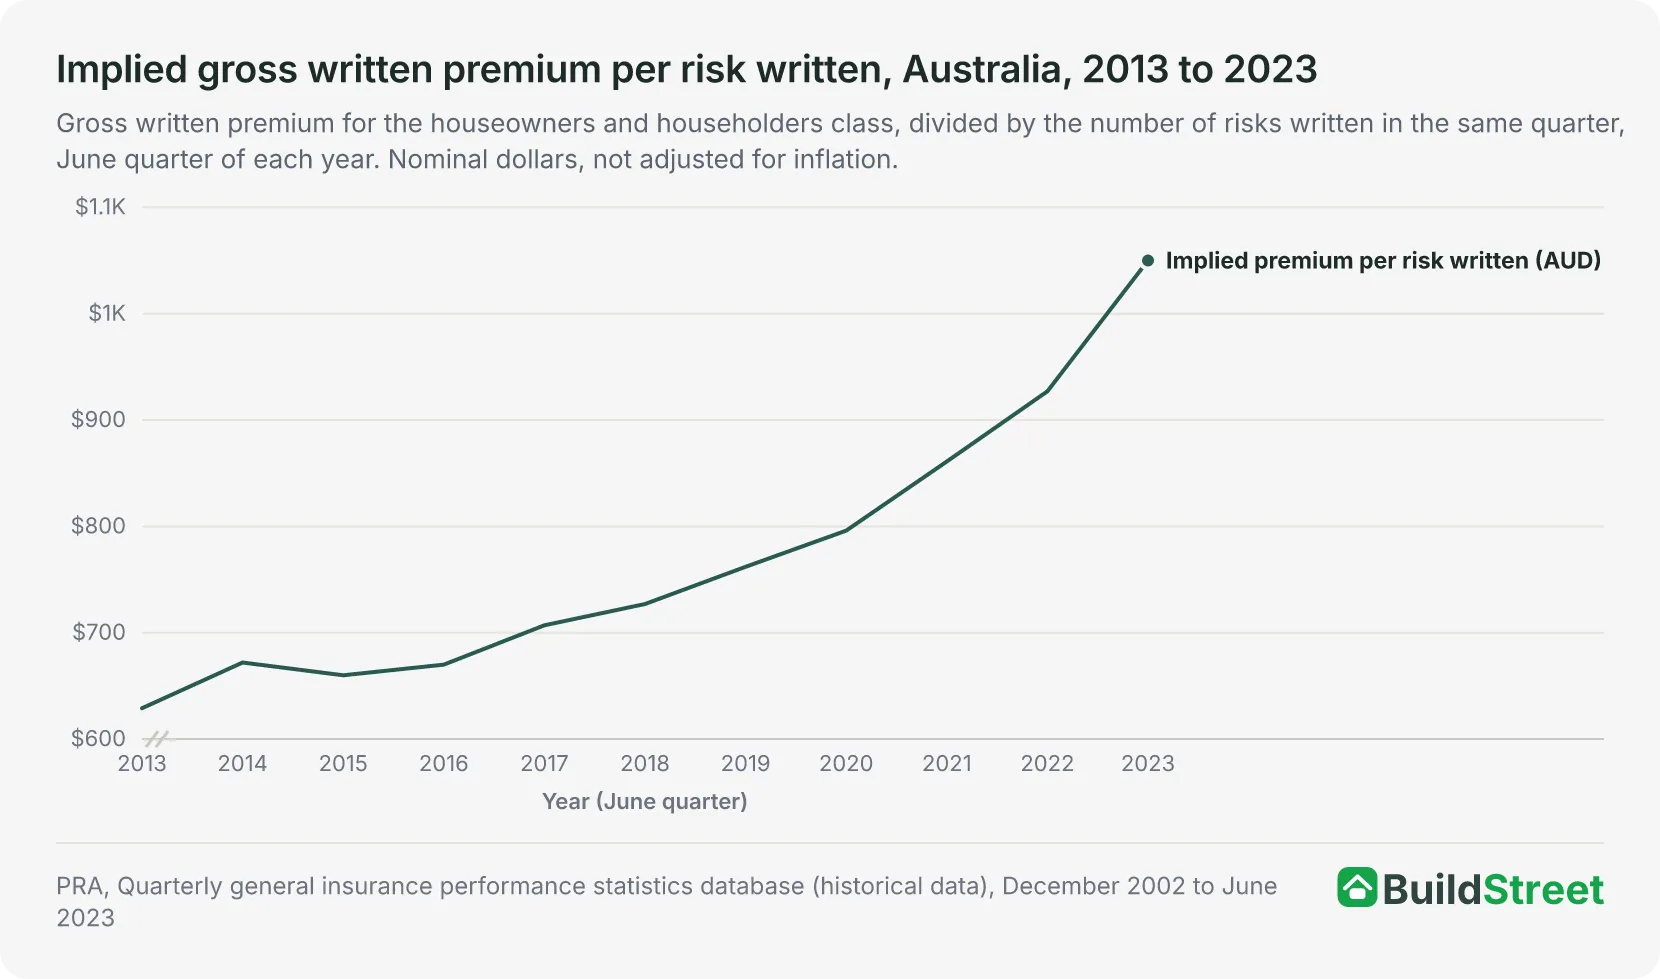
The largest single-year rise came in 2023, when the implied premium increased 13%, from $927 to $1,050.
Growth was not continuous. The figure rose in 2014, fell in 2015, then rose in each year from 2016 to 2023.
| Three measures of home insurance costs in Australia | ||
|---|---|---|
| Measure | What it captures | What it does not show |
| Consumer Price Index (ABS) | How the retail price of house, house contents and motor vehicle insurance, combined into one sub-group, changes over time, by capital city. | Dollar premium amounts, or home insurance isolated from contents and motor vehicle insurance within the same sub-group. |
| Premium data (ACCC) | Annual average premiums paid for home, contents and strata policies in northern Australia and comparison case study areas, for each year from 2007-08 to 2018-19. | Premiums outside the 2007-08 to 2018-19 window, or outside northern Australia and its comparison case study areas. |
| Insurer premium data (APRA) | Total premium dollars written industry-wide each quarter for the home insurance class, and how many risks were written against that premium. | What any individual household, insurer or state actually charges or pays. |
Source · ABS, Consumer Price Index, Australia, February 2026; ACCC, Northern Australia Insurance Inquiry, final report, 2020; APRA, quarterly general insurance performance statistics database.
Section 02 · 2010-11
When were home insurance claims highest in Australia?
Home insurance claims equalled 93.2% of the premium insurers earned in 2021-22, the highest reading in this series.
The ratio was 87% in 2010-11, the year of the Queensland floods and Cyclone Yasi. The lowest reading in the series is 40.4%, in 2013-14, giving a range of 52.8 percentage points.
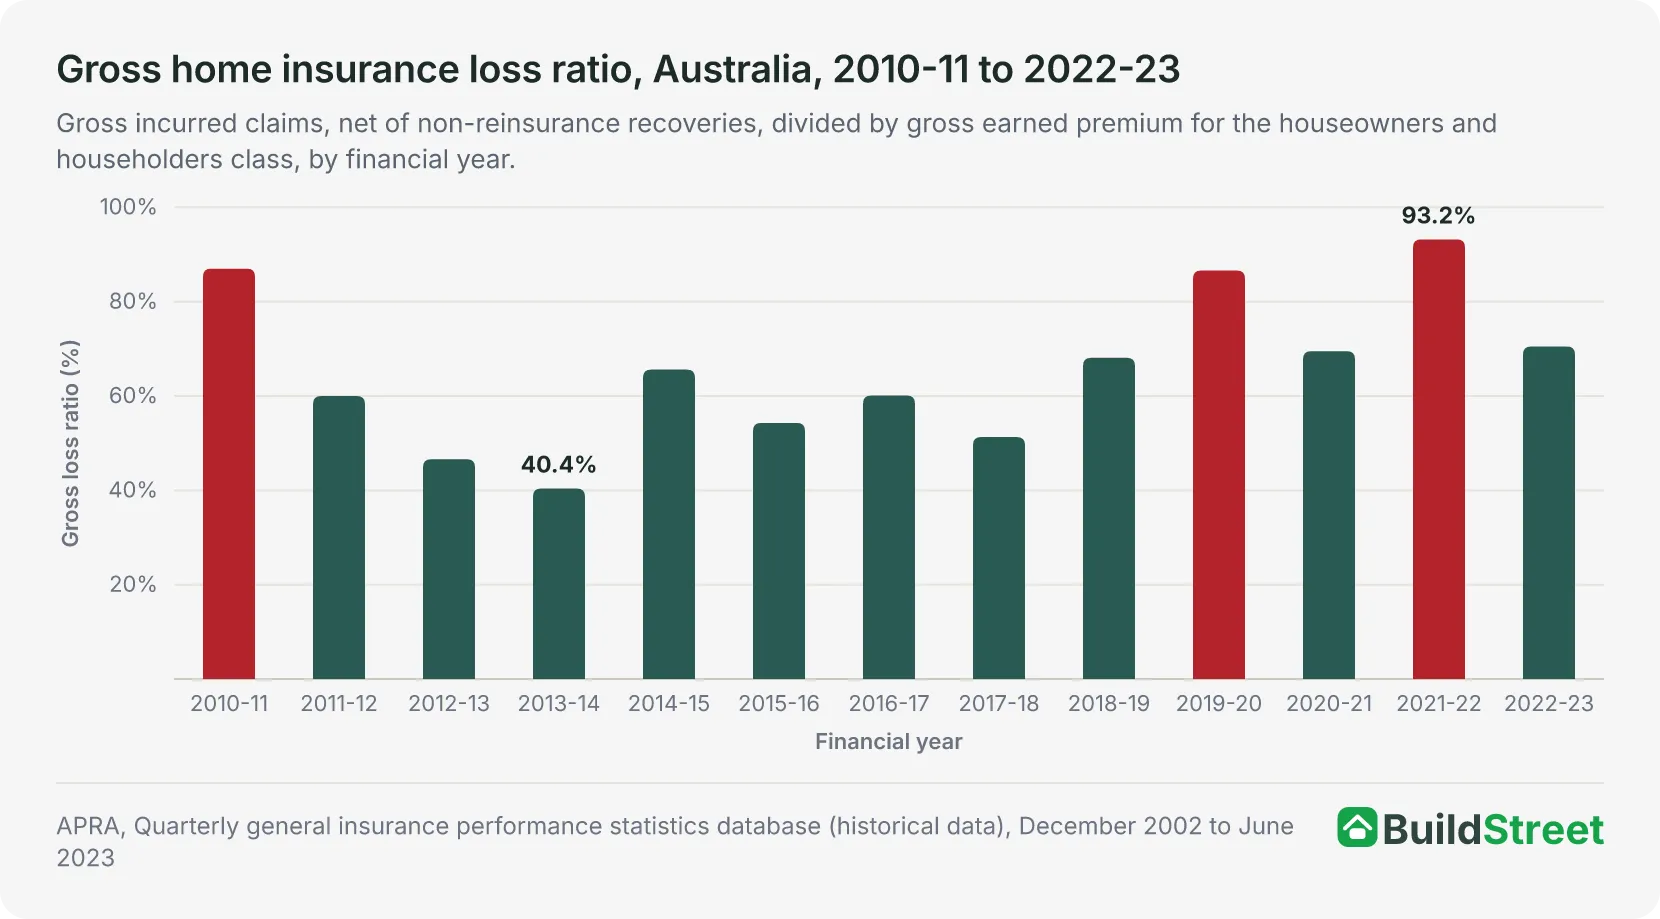
Three of the 13 years recorded a loss ratio above 85%:
- 2021-22: 93.2%, the highest reading in the series
- 2010-11: 87.0%
- 2019-20: 86.6%
The other ten years range from 40.4% to 70.5%.
The 2010-11 reading covers a year of Queensland flooding that included the flooding associated with Severe Tropical Cyclone Yasi. The ratio fell to 60% in 2011-12 and then to 40.4% by 2013-14.
The 2021-22 reading coincided with flooding events across eastern Australia. It fell to 70.5% in 2022-23, above every reading from 2012-13 to 2017-18, which ranged from 40.4% to 65.6%.
Claims may be recorded over more than one reporting period, and reinsurance arrangements affect the share of those costs retained by insurers.
Major floods, insurance changes and premium growth from 2010 to 2020
Real premium growth in northern Australia was fastest in the four years from 2010-11 to 2013-14, according to the ACCC. The timeline below places that period alongside major flooding, changes to flood cover and the ACCC's final inquiry report.
2010-11 wet season
Widespread Queensland flooding and Cyclone Yasi
Gross incurred claims for home insurance reached 87% of gross earned premium nationally that financial year, the second-highest reading in the 2010-11 to 2022-23 series shown above. Major flooding hit multiple Queensland river catchments during the wet season, including the flooding associated with Severe Tropical Cyclone Yasi in early February 2011.
2011-12
Standardised flood cover becomes the industry default
Insurers began moving to a standardised definition of flood cover and making it a default inclusion. Sum insured values in northern Australia and the rest of the country started to diverge from this point, a gap the ACCC linked to households in the north freezing or lowering their cover as premiums rose.
2010-11 to 2013-14
Northern Australia records its fastest real premium growth
The ACCC identified this four-year window as the period of highest real premium growth in northern Australia. One insurer raised building insurance premiums by 70% for policies north of Mackay after commissioning a specialist reassessment of cyclone risk.
December 2020
ACCC releases the Northern Australia Insurance Inquiry final report
The Northern Australia Insurance Inquiry, published on 28 December 2020, set out the scale of the divergence between northern Australia and the rest of the country. It also recommended stamp duty reform in Queensland, Western Australia and the Northern Territory.
Section 03 · Northern Australia
Why home insurance costs more in northern Australia
Real home insurance premiums in northern Australia rose 178% between 2007-08 and 2018-19, compared with 52% across the rest of Australia.
The highest rate of growth occurred in the four years from 2010-11, a period that included Cyclone Yasi and widespread flooding.
By 2018-19, the average combined home and contents premium in northern Australia was about $2,500 a year, 1.8 times the average of about $1,400 elsewhere.
The premium gap widened across the 2007-08 to 2018-19 period.
Contents insurance moved in opposite directions in the two regions: premiums rose 33% in real terms in northern Australia and fell 3% across the rest of the country.
The available data does not isolate Cyclone Yasi's contribution from other cyclones, floods, changes in cover and broader insurance costs over the same period.
Cyclone Yasi crossed the north Queensland coast near Mission Beach as a category 5 system in February 2011. The Bureau of Meteorology recorded flooding across several Queensland river catchments and issued 94 flood warnings, including 30 major warnings.
| Real premium growth by product, northern Australia vs rest of Australia, 2007-08 to 2018-19 | ||
|---|---|---|
| Product | Northern Australia | Rest of Australia |
| Home insurance | +178% | +52% |
| Combined home and contents | +122% | +71% |
| Contents insurance | +33% | −3% |
Source · ACCC, Northern Australia Insurance Inquiry, final report, 2020, Summary p. viii. Cumulative real percentage change over the 2007-08 to 2018-19 period, as reported by the ACCC.
Not all of the increase reflected changes in the price of equivalent cover.
The share of combined home and contents policies in northern Australia that included flood cover rose from 50% in 2008-09 to 97% by 2018-19. Insurers moved to a standardised flood definition and made flood cover the default from 2011-12, meaning that some later policies provided broader cover than earlier policies.
Policies in the region with no flood cover fell from about 30,000 in 2008-09 to about 1,970 a year from 2014-15 onward.
Source: ACCC, Northern Australia Insurance Inquiry, final report, 2020.
Source: ACCC, Northern Australia Insurance Inquiry, final report, 2020.
Non-insurance rates across northern Australia in 2016:
- North Western Australia: 40% of properties, equivalent to about 10,700, the highest rate, up nine percentage points since 2011.
- Northern Territory: 26% of properties, equivalent to about 13,200.
- North Queensland: 17% of properties, equivalent to about 62,100, up seven percentage points since 2011.
More than 95% of uninsured households surveyed for the ACCC's inquiry identified cost as the reason for not holding home insurance.
Cyclone accounted for the largest share of claims costs in the region between 2008-09 and 2017-18, followed by storms, including hail. Water damage and flooding also ranked among the leading causes.
The ACCC also recorded the following for 2018-19:
- Retention rates for combined home and contents insurance were 94% in north Queensland, 87% in the Northern Territory and 83% in north Western Australia.
- Renewing customers paid 7% to 24% more than new customers for the same cover, a gap worth $255 in north Western Australia, $369 in north Queensland and $458 in the Northern Territory.
- Eight insurers supplied most home, contents and strata cover across the region, through around 30 brands and 119 intermediaries.
Section 04 · Bushfire
What bushfire data shows about home insurance costs
Commonwealth disaster relief funding totalled $5.8 billion in 2021-22 and $3.6 billion in 2022-23. These totals include funding provided to state and territory governments.
Queensland received 80% of Australian Government natural disaster funding paid to the states in 2021–22 and 57% in 2022–23.
These figures cover natural disaster relief across multiple hazards. They do not isolate bushfire funding or measure changes in home insurance premiums.
Cyclones accounted for the largest share of home insurance claims costs in the available regional breakdown, which covers northern Australia from 2008–09 to 2017–18. Storms, including hail, ranked second, while water damage and flooding were also among the leading causes.
Bushfires were not among the leading causes shown in this regional breakdown. However, the figures cover northern Australia only and should not be treated as a national ranking of claims costs by hazard.
Section 05 · Reinsurance
How reinsurance costs changed for Australian home insurers
Home insurers passed 36.7% of gross earned home insurance premium to reinsurers in 2021-22, the highest share in the series. This was above the range of about 28% to 33% recorded through most of the previous decade.
The share fell to 32.3% in 2022-23.
Across the thirteen years it ranged from 28.5%, in 2014-15, to 36.7%, a span of 8.2 percentage points. The loss ratio over the same years ranged across 52.8 percentage points.
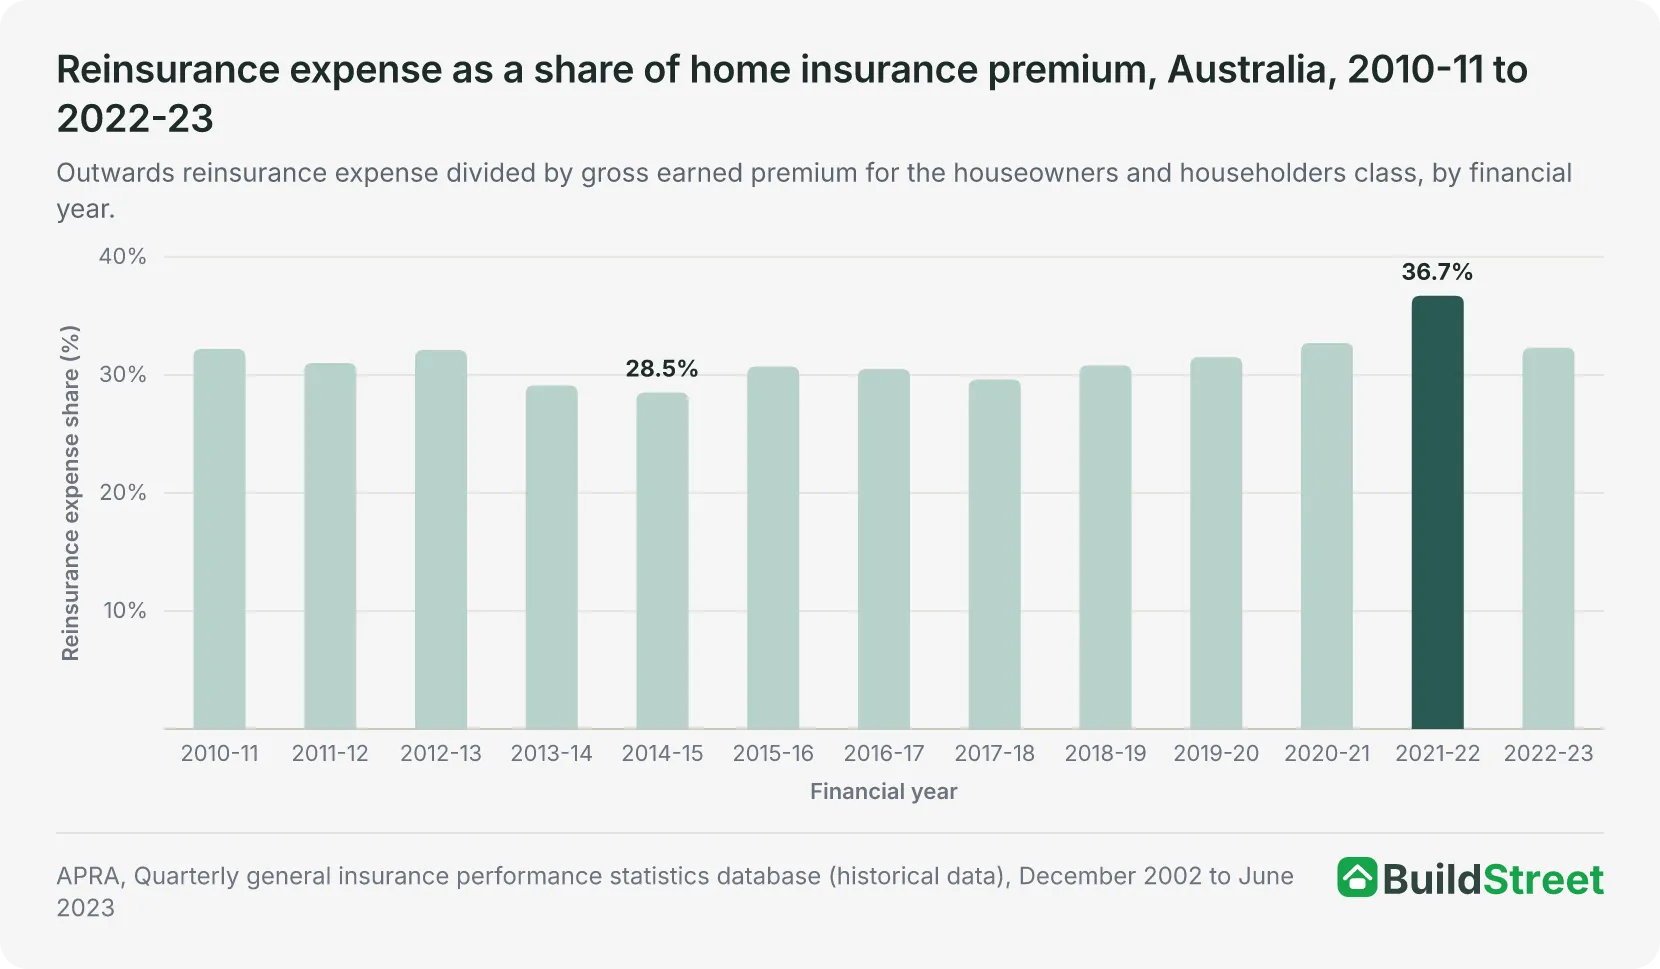
The highest readings in both series occurred in 2021–22: the gross loss ratio reached 93.2%, while reinsurance expense equalled 36.7% of gross earned premium.
Reinsurers may reimburse insurers for covered catastrophe claims. The price and structure of later reinsurance renewals then affect insurers' future costs.
Home insurance premiums reflect both local claims experience and broader reinsurance market conditions, but the available data does not quantify the contribution of each factor.
One insurer raised building insurance premiums by 70% for policies north of Mackay after the catastrophe claims of 2010-11. It made the change once an industry specialist it commissioned had reassessed the technical premium needed to cover cyclone costs in north Queensland.
A July 2024 Productivity Commission submission restated the Productivity Commission's 2023 recommendation to phase out the pool, referred to there as the Northern Australia Reinsurance Pool, over the medium term. The Commission identified two concerns:
- Government-backed reinsurance schemes risk subsidising the movement of people and property into higher-risk areas.
- The schemes expose the Commonwealth to a contingent liability that would not appear in the budget until a cyclone occurs.
Section 06 · Building costs
Building costs and home insurance in Australia from 2021-2026
Building construction prices rose an estimated 37% cumulatively in the five years to March 2026. This figure is calculated from the change in the ABS index and is not an ABS-published five-year total.
Annual growth peaked at 12.8% in September 2022, fell to 2.2% by June 2025 and returned to 4.2% by March 2026.
Annual growth moved from 1.6% in March 2021 to 12.8% in September 2022, a change of 11.2 percentage points across six quarters.
Home insurance is priced against the sum a property is insured for, which is meant to reflect current replacement cost. Construction costs are therefore one factor that may affect premiums, although the data reviewed here does not measure the direct relationship between the two.
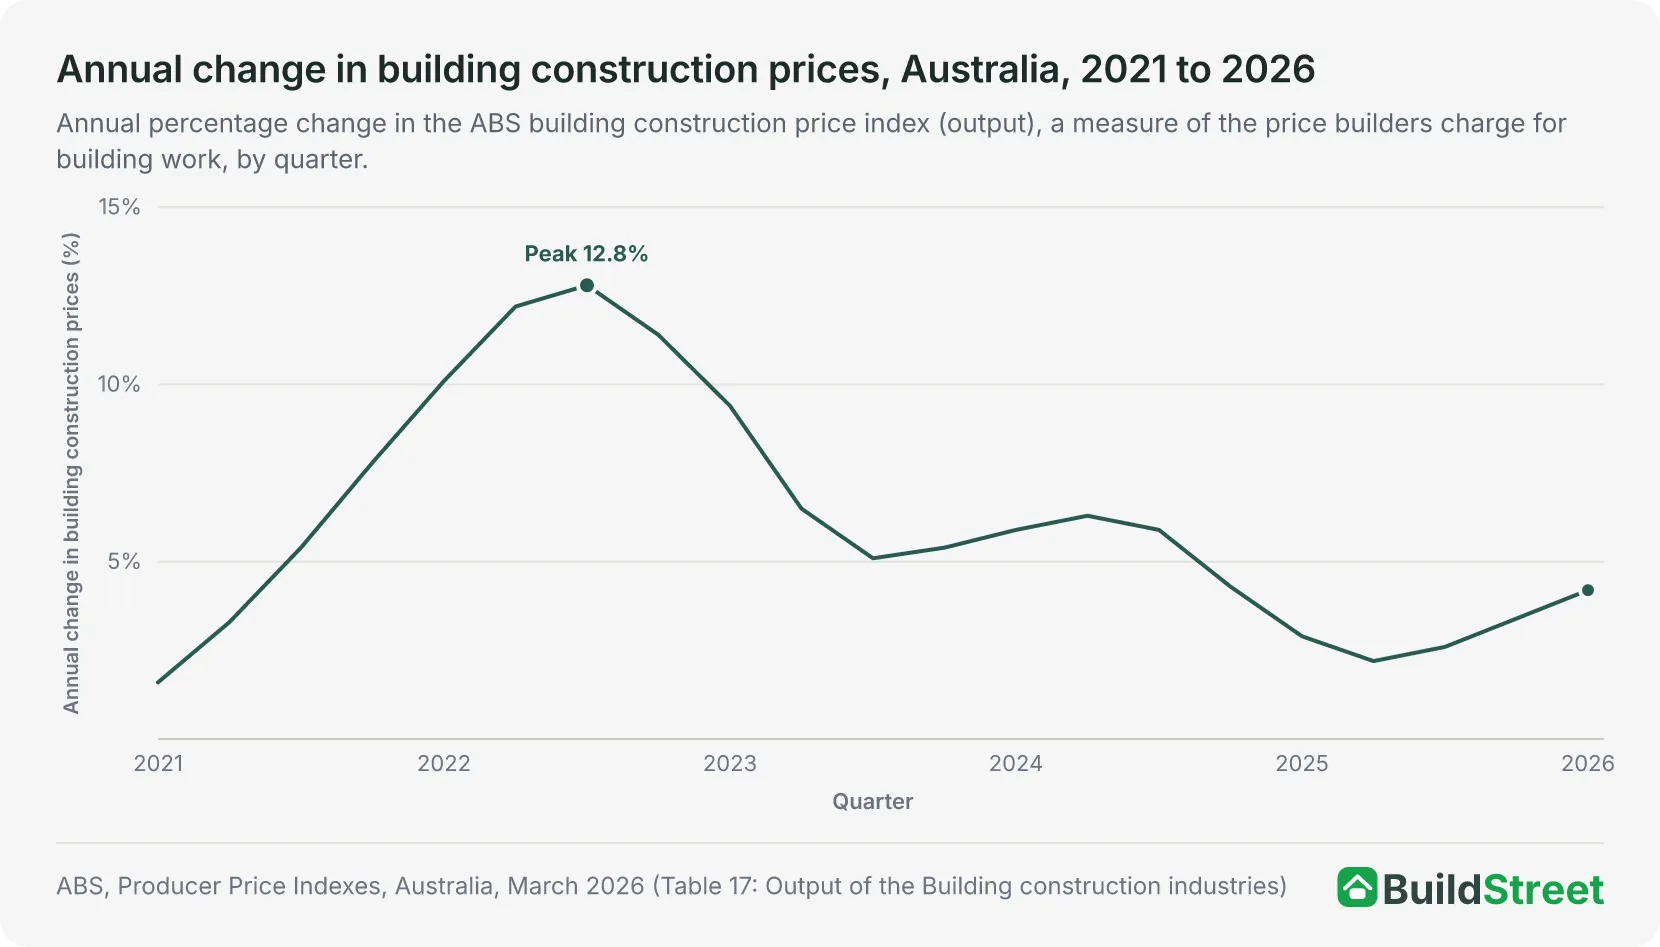
The rise to the September 2022 peak took six quarters. The fall to 2.2% took eleven, with a temporary rebound in late 2023 and early 2024.
Input costs to house construction rose earlier and more sharply than the prices builders charged:
- March 2021: 2.5% annual growth
- June 2022: 17.3%, the peak, one quarter before the output index peaked at 12.8%
- 2024 and 2025: between 1% and 2%
- March 2026: 2.5%
| Annual change in house construction prices by state, March quarter 2026 | |
|---|---|
| State or territory | Annual change |
| Australia | 4.1% |
| Tasmania | 8.8% |
| Western Australia | 6.3% |
| Queensland | 3.9% |
| South Australia | 4.1% |
| Victoria | 3.7% |
| Australian Capital Territory | 3.5% |
| New South Wales | 3.4% |
| Northern Territory | 2.8% |
Source · ABS, Producer Price Indexes, Australia, March 2026 (Table 17: Output of the Building construction industries, House construction class, by state). This is a separate, house-specific series from the broader building construction index charted above, which is why the national reading of 4.1% sits close to, but not identical with, the 4.2% figure for building construction generally.
Tasmania recorded the highest rate of house construction price growth of any state in the March 2026 quarter, at 8.8%, followed by Western Australia at 6.3%. The national rate was 4.1%, and the Northern Territory recorded 2.8%.
Section 07 · Synthesis
Home insurance cost trends and pressures in Australia
National insurance price growth peaked at 16.4% in the year to March 2024, the largest annual rise since 2001. By February 2026, six capital cities recorded growth between 2.6% and 4.4%, while two recorded falls: Perth at −2.2% and Canberra at −0.5%.
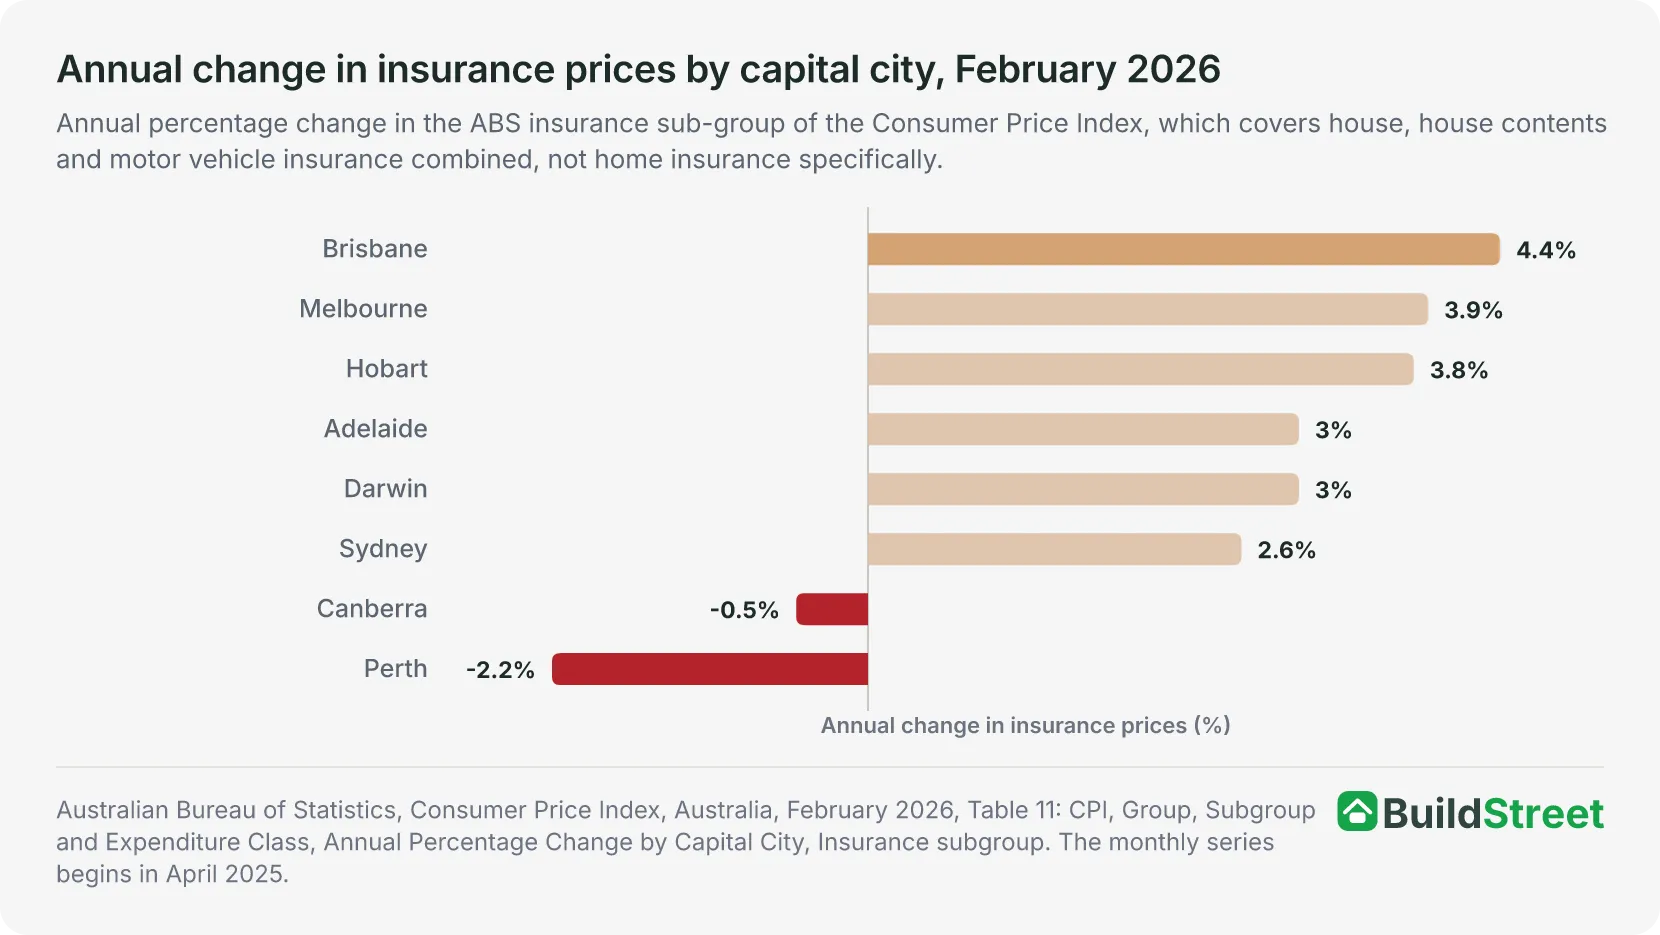
Brisbane recorded the highest rate among the eight capital cities at 4.4%, followed by Melbourne at 3.9% and Hobart at 3.8%. Sydney recorded the lowest increase among the six cities with positive growth, at 2.6%.
Each of those readings is at least 12 percentage points below the 16.4% national rate recorded in the year to March 2024.
The measures in this article run from 2007-08, the ACCC's earliest premium comparison year, to February 2026. Most record higher costs at the end of their period than at the start. Contents insurance outside northern Australia, which fell 3% in real terms between 2007–08 and 2018–19, is the exception.
Insurance claims for storms and floods totalled more than $12.3 billion between January 2020 and November 2022, according to Insurance Council of Australia catastrophe data. That figure covers part of the insured cost of climate-related disasters.
None of the sources reviewed isolates how much of the premium growth is attributable to a single driver.
The following factors applied as cost pressures over the period covered, but their individual contributions are not quantified in the available data:
- Disaster claims
- Reinsurance costs
- Building-cost inflation
- Broader policy coverage including the increased inclusion of flood cover
The increase was uneven across Australia. The 178% real rise in northern Australia between 2007-08 and 2018-19 compares with 52% elsewhere, and the February 2026 city readings range from −2.2% to 4.4%.
References
- ABS Consumer Price Index, Australia, February 2026 · Australian Bureau of Statistics
- ABS, Producer Price Indexes, Australia, March 2026 · Australian Bureau of Statistics
- APRA, Quarterly General Insurance Performance Statistics, March 2026 edition · apra.gov.au
- ACCC, Northern Australia Insurance Inquiry: Final Report, December 2020 · accc.gov.au
- Bureau of Meteorology (Queensland), Floods associated with Severe Tropical Cyclone Yasi, hydrology report, February 2011 · bom.gov.au
- Bureau of Meteorology, Severe Tropical Cyclone Yasi, event history, 30 January - 3 February 2011 · bom.gov.au
- Australian Government, Final Budget Outcome 2021-22 · archive.budget.gov.au
- Australian Government, Final Budget Outcome 2022-23 · archive.budget.gov.au
- Insurance Council of Australia, Three-year weather bill reaches $12.3 billion, media release, 30 November 2022 · insurancecouncil.com.au
- Actuaries Institute, Home Insurance Affordability and Home Loans at Risk, August 2024 · actuaries.asn.au
- Productivity Commission, submission to the Select Committee on the Impact of Climate Risk on Insurance Premiums and Availability, July 2024 · Productivity Commission
