

Published 6 Aug 2026
Home insurance premiums in Australia vary by location, with homeowners in some regions paying more than double the national average. Using official Australian Competition and Consumer Commission (ACCC) data, this guide compares premiums across 330 regions, explains why prices differ, and examines how location, rebuilding costs and natural hazards can affect what homeowners pay.
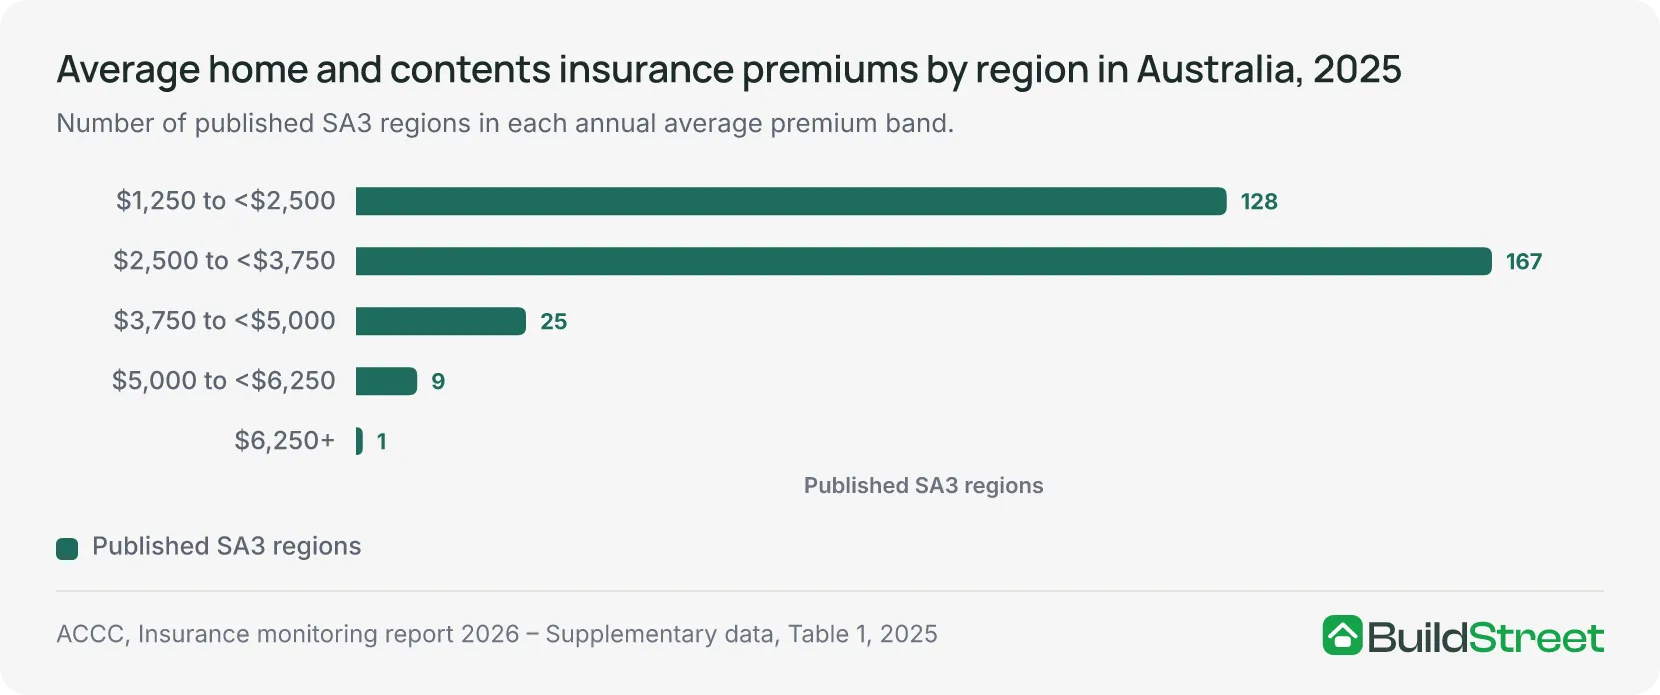
Of the 330 published regions, West Pilbara in Western Australia was the only one where the average combined home and contents insurance premium reached $6,250 or more in 2025. A further nine regions fell into the next highest band, with average premiums ranging from $5,000 to under $6,250. By comparison, the national average premium was $2,360 per policy in 2024-25.
No official source publishes a state-wide average home insurance premium for each Australian jurisdiction, with the Northern Territory the only exception. Instead, the available data comprises a national average, four regional averages and premium bands covering all 330 published regions. Together, these provide a detailed picture of where insurance costs are highest without presenting the regional figures as state-wide averages.
ACCC, Insurance monitoring report 2026 – Supplementary data, Table 1, 2025; ACCC, Insurance monitoring report, June 2026, Table B.1.
Section 01 · National picture
Which Australian regions have the highest home insurance premiums?
Ten of Australia's 330 published regions have an average combined home and contents insurance premium of $5,000 or more. Six of these are in north Western Australia and the Northern Territory, a concentration the ACCC also highlights in its analysis.
At the other end of the distribution, most published regions fall into the lower premium bands. In total, 295 regions, representing 89.4% of those published, sit in the two lowest bands, both below $3,750.
The ACCC reports premiums by Statistical Area Level 3 (SA3) using five premium bands rather than exact average values. As a result, regions within the same band cannot be ranked against one another, and a band's midpoint should not be interpreted as an average.
330
Areas with enough data for the ACCC to publish a band
35
10.6% of published regions
$6,250+
West Pilbara
| Highest areas: published SA3 regions with average premiums of $3,750 or more, Australia, 2025 | ||
|---|---|---|
| SA3 region | State or territory | Average premium band |
| West Pilbara | WA | $6,250+ |
| Dural – Wisemans Ferry | NSW | $5,000 to <$6,250 |
| Eastern Suburbs – North | NSW | $5,000 to <$6,250 |
| Darwin City | NT | $5,000 to <$6,250 |
| East Arnhem | NT | $5,000 to <$6,250 |
| Surfers Paradise | Qld | $5,000 to <$6,250 |
| Stonnington – West | Vic | $5,000 to <$6,250 |
| East Pilbara | WA | $5,000 to <$6,250 |
| Gascoyne | WA | $5,000 to <$6,250 |
| Kimberley | WA | $5,000 to <$6,250 |
| Clarence Valley | NSW | $3,750 to <$5,000 |
| Hawkesbury | NSW | $3,750 to <$5,000 |
| Ku-ring-gai | NSW | $3,750 to <$5,000 |
| Manly | NSW | $3,750 to <$5,000 |
| Moree – Narrabri | NSW | $3,750 to <$5,000 |
| North Sydney – Mosman | NSW | $3,750 to <$5,000 |
| Pittwater | NSW | $3,750 to <$5,000 |
| Richmond Valley – Coastal | NSW | $3,750 to <$5,000 |
| Tweed Valley | NSW | $3,750 to <$5,000 |
| Darwin Suburbs | NT | $3,750 to <$5,000 |
| Litchfield | NT | $3,750 to <$5,000 |
| Brisbane Inner – East | Qld | $3,750 to <$5,000 |
| Brisbane Inner – North | Qld | $3,750 to <$5,000 |
| Brisbane Inner – West | Qld | $3,750 to <$5,000 |
| Broadbeach – Burleigh | Qld | $3,750 to <$5,000 |
| Coolangatta | Qld | $3,750 to <$5,000 |
| Gold Coast – North | Qld | $3,750 to <$5,000 |
| Kenmore – Brookfield – Moggill | Qld | $3,750 to <$5,000 |
| Mudgeeraba – Tallebudgera | Qld | $3,750 to <$5,000 |
| Noosa | Qld | $3,750 to <$5,000 |
| Sherwood – Indooroopilly | Qld | $3,750 to <$5,000 |
| Townsville | Qld | $3,750 to <$5,000 |
| Whitsunday | Qld | $3,750 to <$5,000 |
| Manningham – East | Vic | $3,750 to <$5,000 |
| Cottesloe – Claremont | WA | $3,750 to <$5,000 |
Source · ACCC, Insurance monitoring report 2026 – Supplementary data, Table 1, 2025.
| Exact regional average premiums published by the ACCC, 2024–25 | ||||
|---|---|---|---|---|
| ACCC region | 2023–24 | 2024–25 | Change, as published | Change, recomputed |
| North Western Australia | $4,618 | $4,966 | 8% | 7.5% |
| Northern Territory | $3,337 | $3,546 | 6% | 6.3% |
| North Queensland | $3,006 | $3,117 | 4% | 3.7% |
| Rest of Australia | $2,094 | $2,310 | 10% | 10.3% |
Source · ACCC, Insurance monitoring report, June 2026, Table 6.1, printed page 60.
The four exact regional mean premiums published for 2024–25 range from $2,310 in the rest of Australia to $4,966 in north Western Australia. Only the Northern Territory matches a state or territory boundary.
Australia's average home insurance premium increased 46.4% over three years
The national mean rose from $1,612 in 2021–22 to $2,360 in 2024–25. This is an increase of 46.4% in nominal terms calculated from the two published levels. Adjusted for inflation and expressed in 2024–25 dollars, the increase is 28.2%.
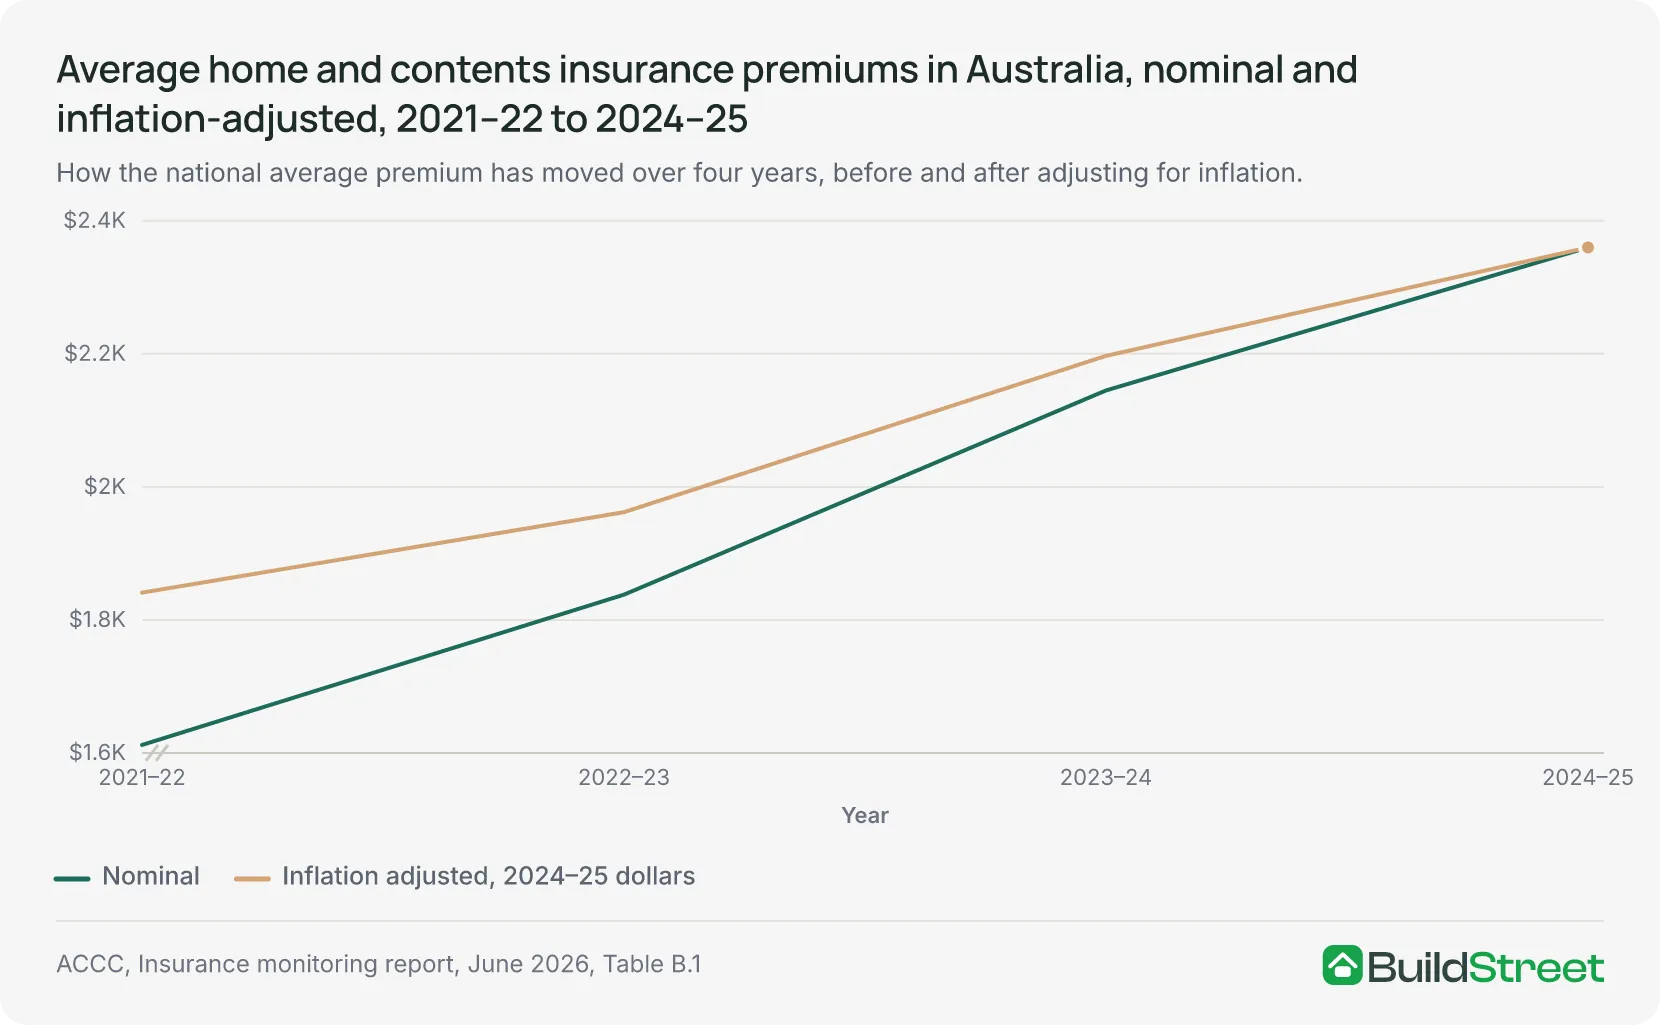
The inflation-adjusted average still rose from $1,841 to $2,360, showing that the increase was greater than the change attributable to general inflation alone.
The Northern Territory has the highest share of regions above $3,750
Across the states and territories, the Northern Territory has the largest share of published regions with premiums of $3,750 or more, at 44.4%. This compares with 16.0% in Queensland, 14.7% in Western Australia and 12.4% in New South Wales.
South Australia, Tasmania and the ACT have no published region at or above $3,750.
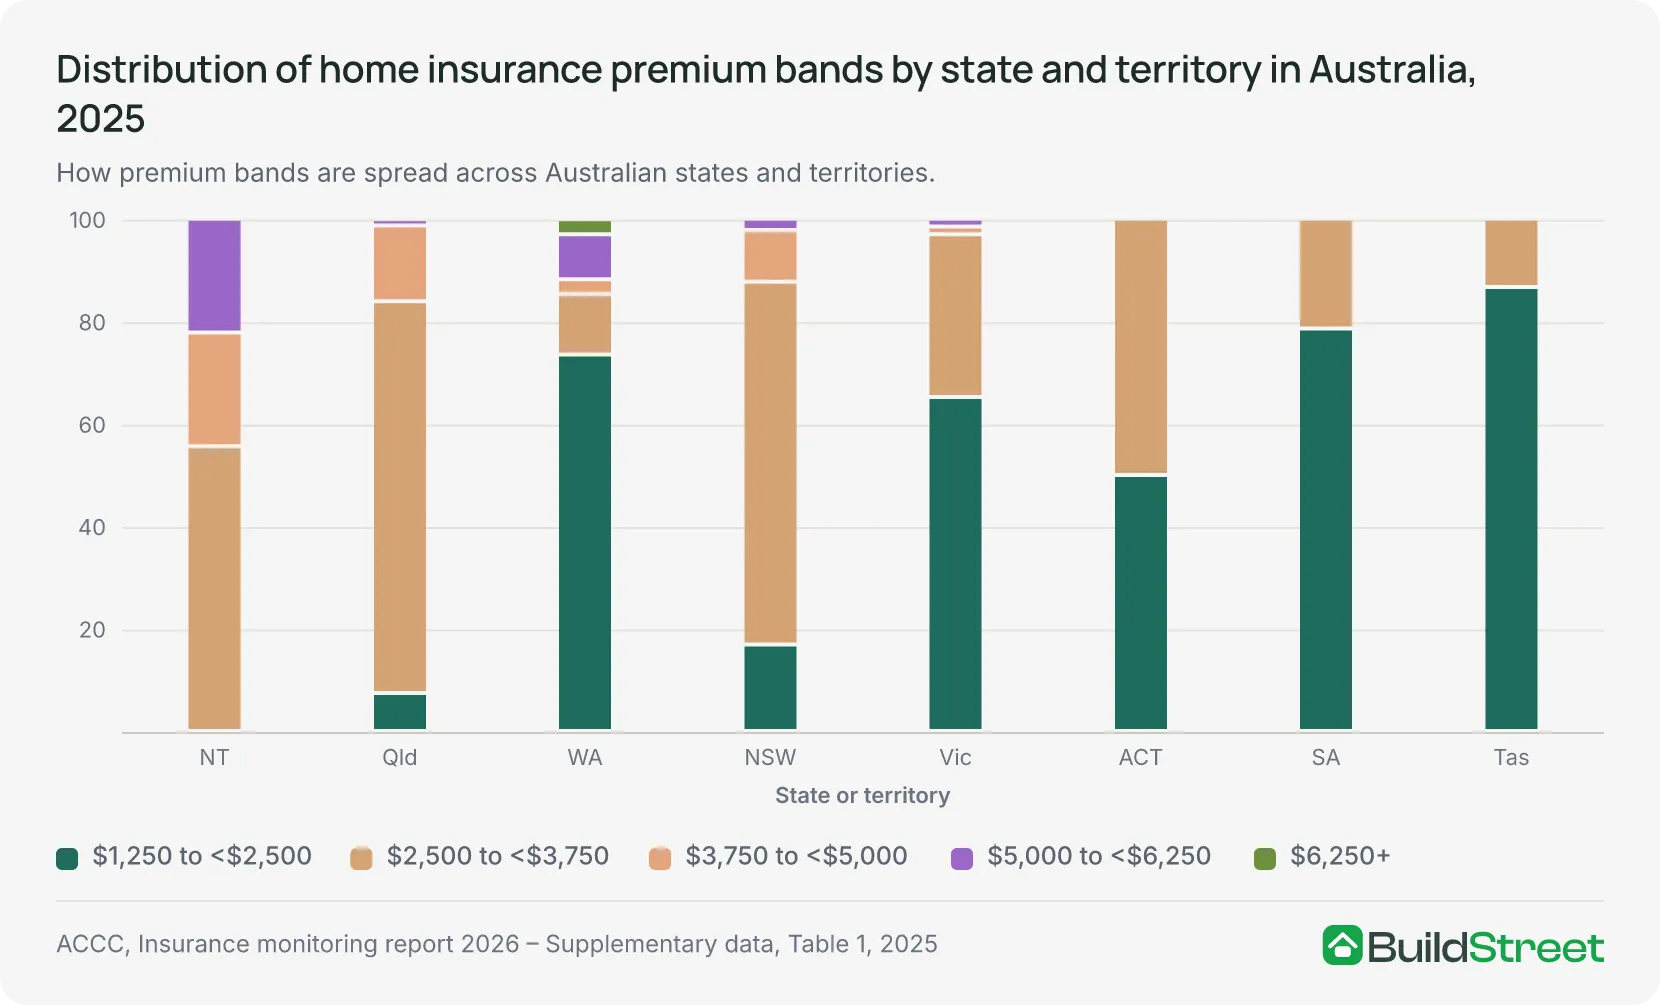
Queensland and New South Wales have the largest numbers of regions at $3,750 or more, with 13 and 11 respectively. The Northern Territory has four, but these account for 44.4% of its nine published regions.
Section 02 · New South Wales
Home insurance premiums in New South Wales
Two of New South Wales' 89 published regions are in the state's highest premium band, $5,000 to under $6,250. They are Dural-Wisemans Ferry, on Sydney's north-western fringe, and Eastern Suburbs - North. No region in NSW reaches the $6,250+ band.
Eleven regions have average premiums of $3,750 or more, the second-largest number of any jurisdiction after Queensland. This represents 12.4% of the state's published regions, placing New South Wales behind the Northern Territory, Queensland and Western Australia by share.
Published SA3 regions by band, NSW, 2025
- $6,250+
0
- $5,000 to <$6,250
2
- $3,750 to <$5,000
9
- $2,500 to <$3,750
63
- $1,250 to <$2,500
15
- Total published
89
Highest published band in NSW
- Dural – Wisemans Ferry
$5,000–<$6,250
- Eastern Suburbs – North
$5,000–<$6,250
Source · ACCC, Insurance monitoring report 2026 – Supplementary data, Table 1, 2025. Counts and shares are calculated from the 330 published SA3 rows, and describe published regions only, not policies or households. No state-wide average premium for New South Wales is published by the ACCC, APRA or the ABS.
Which parts of NSW have premiums of $3,750 or more?
The nine regions between $3,750 and $5,000 span different parts of New South Wales:
- Northern rivers coast: Clarence Valley, Richmond Valley – Coastal, Tweed Valley
- Sydney's northern beaches and lower north shore: Manly, North Sydney – Mosman, Pittwater
- Elsewhere: Hawkesbury, Ku-ring-gai, Moree – Narrabri
This mix of high-value Sydney areas and regional coastal areas shows why the premium bands alone cannot separate the effect of insured property values from insurance risk. A published average reflects the amount insured as well as the rate charged, a point the ACCC makes directly about its premium figures.
Most New South Wales regions are below $3,750
The largest single group is the 63 regions priced between $2,500 and $3,750; 70.8% of those published in the state. A further 15 regions, 16.9%, are in the lowest band, under $2,500.
New South Wales has more published regions than any other jurisdiction, so a change affecting one region has a smaller effect on its overall percentages than in jurisdictions with fewer published regions.
Section 03 · Victoria
Home insurance premiums in Victoria
Victoria's highest published band is $5,000 to under $6,250, with one region in this range: Stonnington - West, which includes South Yarra, Prahran and Windsor. Manningham - East, on Melbourne's eastern edge, is the only Victorian region with an average premium of $3,750 to under $5,000.
These two are the exceptions. Of the 66 published Victorian regions, 43 (65.2%) are in the lowest band, with average premiums below $2,500. This is the fourth-largest share of any jurisdiction, behind Tasmania, South Australia and Western Australia.
Another 21 fall between $2,500 and $3,750.
Published SA3 regions by band, Victoria, 2025
- $6,250+
0
- $5,000 to <$6,250
1
- $3,750 to <$5,000
1
- $2,500 to <$3,750
21
- $1,250 to <$2,500
43
- Total published
66
Highest published bands in Victoria
- Stonnington – West
$5,000–<$6,250
- Manningham – East
$3,750–<$5,000
Source · ACCC, Insurance monitoring report 2026 – Supplementary data, Table 1, 2025. Counts and shares are calculated from published SA3 rows only. Stonnington – West and Manningham – East are in different bands and can be ordered; regions inside the same band cannot.
Most Victorian regions are in the lowest premium band
Stonnington - West sits three bands above the 43 regions in Victoria's lowest band, creating a difference of at least $2,500 in average annual premiums.
At 3.0%, Victoria has the lowest share of regions at $3,750 or more among jurisdictions with at least one region above that threshold.
Section 04 · Queensland
Home insurance premiums in Queensland
Queensland has the largest number of higher-cost regions of any state. Thirteen of its 81 published SA3 regions are at $3,750 or more, representing 16.0% of those published.
Surfers Paradise is the only one in the $5,000 to under $6,250 band. No Queensland region reaches $6,250.
At the other end, six Queensland regions (7.4% of those published) are in the lowest band, with premiums below $2,500. This is the smallest share of any jurisdiction apart from the Northern Territory, which has none.
Published SA3 regions by band, Queensland, 2025
- $6,250+
0
- $5,000 to <$6,250
1
- $3,750 to <$5,000
12
- $2,500 to <$3,750
62
- $1,250 to <$2,500
6
- Total published
81
Highest published band in Queensland
- Surfers Paradise
$5,000–<$6,250
- North Queensland mean, 2024–25
$3,117
Source · ACCC, Insurance monitoring report 2026 – Supplementary data, Table 1, 2025; ACCC, Insurance monitoring report, June 2026, Table 6.1, printed page 60. Band counts are calculated from published SA3 rows. The north Queensland mean is published by the ACCC and covers a monitoring region that doesn't align with any SA3 grouping above, so the two are shown separately rather than combined.
Higher-premium regions are concentrated in south-east and northern Queensland
The 12 regions between $3,750 and $5,000 split between two different ends of the state:
- Brisbane: Brisbane Inner – East, Brisbane Inner – North, Brisbane Inner – West, Kenmore – Brookfield – Moggill, Sherwood – Indooroopilly
- Gold Coast and Sunshine Coast: Broadbeach – Burleigh, Coolangatta, Gold Coast – North, Mudgeeraba – Tallebudgera, Noosa
- Northern Queensland: Townsville, Whitsunday
Ten regions are in Brisbane or on the Gold Coast and Sunshine Coast, while the other two, Townsville and Whitsunday, are in the tropical north. Because the ACCC reports premium bands rather than exact regional averages, the data does not show how much of each premium reflects insured values, location-specific risk or other pricing factors.
North Queensland's average premium was $3,117
North Queensland's mean combined home and contents premium was $3,117 in 2024–25, against $3,006 the previous year. That's a 4% increase as reported, or 3.7% calculated from the two reported levels.
Queensland is one of only two jurisdictions where the ACCC publishes an exact average for part of the state. Western Australia is the other. By comparison, the Northern Territory figure covers the whole territory.
Queensland's published region extends from Mackay to Port Douglas and covers only a minority of the state's population, so it should not be treated as a Queensland-wide average. Its average premium increased by 14% between 2021–22 and 2024–25, compared with 49% across the rest of Australia.
Section 05 · Western Australia
Home insurance premiums in Western Australia
Western Australia contains the highest published premium band in the country. West Pilbara is the only one of 330 published regions in the $6,250+ band, with East Pilbara, Gascoyne and Kimberley all in the $5,000 to under $6,250 band.
Four of Australia's 10 published regions with average home and contents insurance premiums of $5,000 or more are in Western Australia, all in the state's north or north-west. Cottesloe – Claremont, in Perth, is the only other Western Australian region in the $3,750-or-more premium band.
At the same time, 25 of its 34 published regions are in the lowest band, with average premiums below $2,500. This gives Western Australia the widest spread of premium bands of any jurisdiction.
Published SA3 regions by band, WA, 2025
- $6,250+
1
- $5,000 to <$6,250
3
- $3,750 to <$5,000
1
- $2,500 to <$3,750
4
- $1,250 to <$2,500
25
- Total published
34
Highest published bands in WA
- West Pilbara
$6,250+
- East Pilbara
$5,000–<$6,250
- Gascoyne
$5,000–<$6,250
- Kimberley
$5,000–<$6,250
- Cottesloe – Claremont
$3,750–<$5,000
Source · ACCC, Insurance monitoring report 2026 – Supplementary data, Table 1, 2025. East Pilbara, Gascoyne and Kimberley share one band and are listed alphabetically; their exact averages are not published and they cannot be ranked. Western Australia is the only jurisdiction with a published region in all five bands.
North Western Australia's average premium was $4,966
The average combined premium for the northern part of Western Australia was $4,966 in 2024–25 compared with $4,618 the previous year. That is an 8% increase as reported, or 7.5% calculated from the two levels.
This region is the highest of the four published regional averages, and more than double the $2,310 average for the rest of Australia.
The north Western Australia average increased by 17% between 2021–22 and 2024–25, which was slower than the increase in the national premium over the same period.
Most Western Australian regions are in the lowest premium band
Twenty-five of Western Australia's 34 published regions, or 73.5% are in the lowest band, under $2,500, and only four fall between $2,500 and $3,750.
This combination means Western Australia's published regions extend from the country's highest premium band to the lowest, a wider range than in any other jurisdiction.
Section 06 · South Australia and Tasmania
Home insurance premiums in South Australia and Tasmania
Neither South Australia nor Tasmania has a published SA3 region in the $3,750-or-higher premium bands. Instead, both peak in the $2,500 to under $3,750 band, three bands below the national maximum. Along with the ACT, they are the only jurisdictions with no region above that level.
Six of South Australia's 28 published regions reach the $2,500-to-under-$3,750 band, all in or around Adelaide:
- Adelaide City
- Adelaide Hills
- Burnside
- Norwood – Payneham – St Peters
- Prospect – Walkerville
- Unley
The remaining 22 regions, or 78.6% of those published in South Australia, are in the lowest band, with average premiums under $2,500.
Tasmania has two regions in the $2,500 to under $3,750 band: Hobart Inner and Huon – Bruny Island. The remaining 13 of its 15 published regions are below $2,500. At 86.7%, this is the largest share in the lowest band of any state or territory.
South Australia, 2025
- $3,750 or more
0
- $2,500 to <$3,750
6
- $1,250 to <$2,500
22
- Total published
28
- Share under $2,500
78.6%
Tasmania, 2025
- $3,750 or more
0
- $2,500 to <$3,750
2
- $1,250 to <$2,500
13
- Total published
15
- Share under $2,500
86.7%
Australia, for comparison
- $3,750 or more
35
- $2,500 to <$3,750
167
- $1,250 to <$2,500
128
- Total published
330
- Share under $2,500
38.8%
Source · ACCC, Insurance monitoring report 2026 – Supplementary data, Table 1, 2025. South Australia's six top-band regions and Tasmania's two are listed alphabetically within their shared band and can't be ranked. Tasmania has the fewest published regions of any state, at 15, so its shares move by 6.7 percentage points for each region that changes band.
All published regions in both states are below $3,750
South Australia and Tasmania are two of three jurisdictions, along with the ACT, whose published regions appear only in the two lowest premium bands.
Neither state has a published state-wide average premium, so the band distribution shows how regions are grouped but not the exact average premium for either state.
Section 07 · ACT and Northern Territory
Home insurance premiums in the ACT and Northern Territory
The ACT has no published region with an average at $3,750 or more. The Northern Territory shows the opposite pattern: four of its nine published regions are at or above this level, while none are in the lowest band below $2,500.
These two territories have the smallest samples in the dataset, with eight published regions in the ACT and nine in the Northern Territory. As a result, each region has a larger effect on their percentage distributions than in the states.
ACT, published regions by band, 2025
- $3,750 or more
0
- $2,500 to <$3,750
4
- $1,250 to <$2,500
4
- Total published
8
- Published mean premium
Not published
Northern Territory, published regions by band, 2025
- $5,000 to <$6,250
2
- $3,750 to <$5,000
2
- $2,500 to <$3,750
5
- $1,250 to <$2,500
0
- Published mean premium, 2024–25
$3,546
Source · ACCC, Insurance monitoring report 2026 – Supplementary data, Table 1, 2025; ACCC, Insurance monitoring report, June 2026, Table 6.1. The ACT's four top-band regions and the Northern Territory's two are listed alphabetically within their shared bands and cannot be ranked. Each ACT region accounts for 12.5% of the territory's published distribution.
Home insurance premiums in the ACT
The ACT's eight published regions split evenly between the two lowest bands. Four are under $2,500, while these four are in the $2,500 to under $3,750 band:
- Canberra East
- North Canberra
- South Canberra
- Woden Valley
No ACT region reaches $3,750.
Like South Australia and Tasmania, the ACT has published regions in only the two lowest premium bands. The ACCC does not publish an exact territory-wide average for the ACT.
Home insurance premiums in the Northern Territory
The Northern Territory's nine published regions are spread across three premium bands:
- $5,000 to under $6,250: Darwin City, East Arnhem
- $3,750 to under $5,000: Darwin Suburbs, Litchfield
- $2,500 to under $3,750: Alice Springs, Barkly, Daly – Tiwi – West Arnhem, Katherine, Palmerston
At 44.4%, the Northern Territory has the highest share of published regions with premiums of $3,750 or more. This compares with 16.0% in Queensland, 14.7% in Western Australia and 12.4% in New South Wales.
The Northern Territory's mean combined premium was $3,546 in 2024–25, compared with $3,337 the previous year. This is a 6% increase as reported, or 6.3% calculated from the two levels.
Because the Northern Territory aligns with one of the ACCC's four monitoring regions, it is the only Australian state or territory with a published jurisdiction-wide mean premium in this dataset.
Its mean premium increased by 38% between 2021–22 and 2024–25, compared with 17% in north Western Australia and 14% in north Queensland, all in nominal terms.
Section 08 · Local risk
Why home insurance premiums vary by location
Standardised premiums per $100,000 sum insured were $304 nationally in 2024–25, $494 in northern Australia and $295 elsewhere. The ACCC uses this measure to reduce the effect of differing insured values across regions.
Two major drivers of a raw home insurance premium are the rate charged for risk and the amount insured. Building costs are also generally higher in northern Australia, because of remoteness and stricter building standards.
A raw premium therefore does not isolate risk pricing. A higher average may reflect greater insurance risk, higher insured values or a combination of both.
Northern Australia has higher premiums per $100,000 insured
Standardising for the amount insured narrows the regional gap but does not remove it. In 2024–25, northern Australia's premium per $100,000 sum insured was 1.67 times the figure for the rest of Australia, at $494 compared with $295.
In per-policy terms, northern Australia averaged $3,233 in 2024–25 against $2,310 in the rest of Australia, a difference of $923.
Even after allowing for differences in insured values, the northern Australian figure remained higher. The ACCC states that this measure helps control for regional differences in rebuilding costs and insured values, although it does not remove every pricing difference.
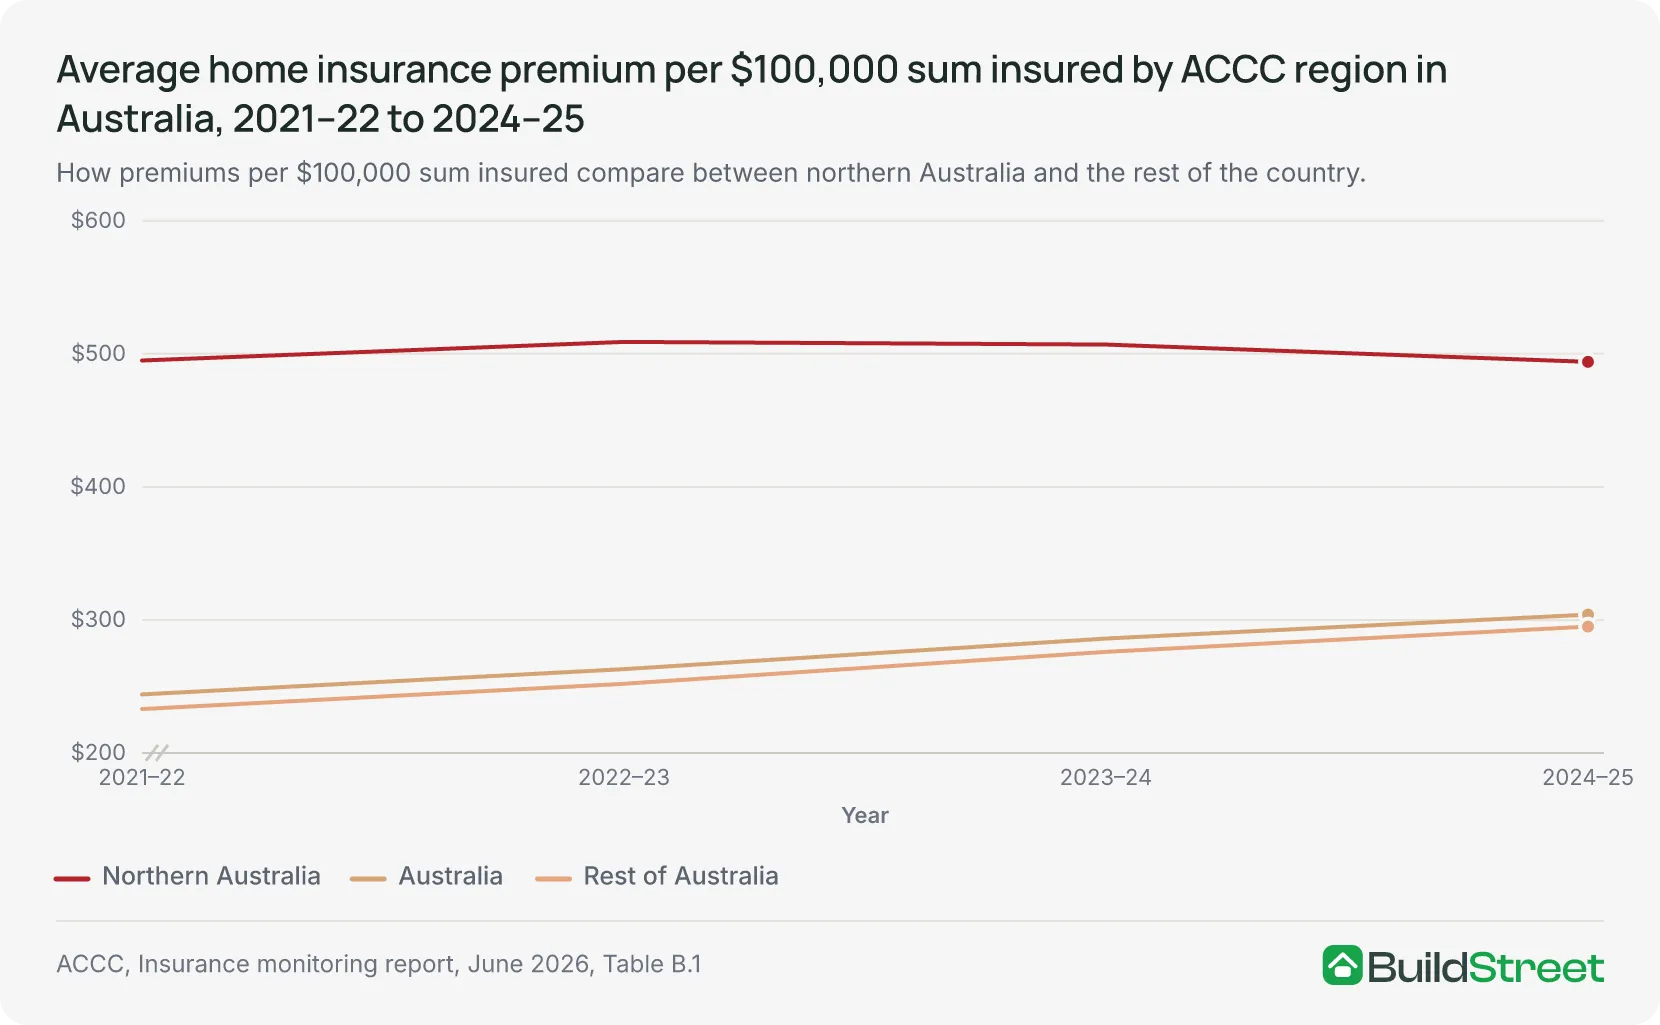
The northern Australia series was broadly flat over these four years, while the rest-of-Australia series rose from $233 to $295 per $100,000 insured.
Average premiums differ by insurance product
The national mean premium in 2024–25 was $2,360 for a combined home and contents policy, $1,852 for building only and $531 for contents only.
These figures relate to separate products rather than components of a single policy. They should therefore be compared as different types of cover, not added together.
Since 2021–22 the national mean premium increased by 48.4% for building-only cover and 20.1% for contents-only cover.
| Average home insurance premium by product type in Australia, 2021–22 and 2024–25 | ||||
|---|---|---|---|---|
| Product | 2021–22 | 2024–25 | Change, nominal | Per $100,000 sum insured, 2024–25 |
| Combined home and contents | $1,612 | $2,360 | +46.4% | $304 |
| Home building only | $1,248 | $1,852 | +48.4% | $331 |
| Home contents only | $442 | $531 | +20.1% | $636 |
Source · ACCC, Insurance monitoring report, June 2026, Table B.1.
Cyclone-risk premiums vary widely within the same category
Among policies in medium to high cyclone risk areas, priced after their insurer joined the reinsurance pool, the median premium was $551 per $100,000 sum insured, while the 95th percentile was $1,220.
The 95th percentile was 2.21 times the median, based on the two published figures. Before pool entry, the equivalent figures were $631 and $1,341.
This shows that premiums can vary substantially even within the same cyclone-risk category. Medium-to-high wind-risk bands account for about 2% of policies in the dataset, so this spread is not visible in national or state averages.
| Average home and contents insurance premium by cyclone risk category in Australia, pre-pool and post-pool policies | ||||
|---|---|---|---|---|
| Cyclone risk | Pre-pool premium | Post-pool premium | Pre-pool per $100,000 | Post-pool per $100,000 |
| Medium to high | $3,885 | $3,823 | $708 | $628 |
| Low | $2,233 | $2,458 | $345 | $355 |
| Nil | $2,091 | $2,320 | $283 | $300 |
Source · ACCC, Insurance monitoring report, June 2026, Table 6.2, printed page 64, and Chapter 6.
For post-pool policies, average premiums per $100,000 sum insured ranged from $824 in Karratha to $281 in Sydney.
Mackay, Cairns and Brisbane are all in Queensland and span $267 per $100,000 sum insured.
| Average home insurance premium per $100,000 sum insured in selected Australian cities, post-pool policies | |||
|---|---|---|---|
| City | State | Premium per $100,000 sum insured | Change from pre-pool policies |
| Karratha | Western Australia | $824 | −15% |
| Mackay | Queensland | $619 | −14% |
| Cairns | Queensland | $556 | −12% |
| Brisbane | Queensland | $352 | +2% |
| Sydney | New South Wales | $281 | +7% |
Source · ACCC, Insurance monitoring report, June 2026, Chapter 6.
Premium averages also reflect taxes and address-level pricing
Mean premiums have risen unevenly by region since 2021–22: up 49% in the rest of Australia and 38% in the Northern Territory, against 17% in north Western Australia and 14% in north Queensland, all in nominal terms.
Two further features of the published premiums limit what a state average can reveal. The figures are means, and means get pulled upward by the most expensive policies in a region.
They also include GST, stamp duty and applicable levies, so part of any difference between jurisdictions reflects state insurance taxes rather than risk.
The ACCC also states that regional averages can conceal the higher premiums paid by some consumers and that insurers can increasingly price natural-peril risk at an individual-address level. An average may therefore differ substantially from a quote for a specific property.
The latest available ABS state comparison is from 2015–16
Average household spending on house and contents insurance ranged from $22.27 a week in the Northern Territory to $13.81 in Victoria, compared with a national average of $16.74.
This remains the latest ABS measure covering all eight states and territories, but it is not directly comparable with the ACCC premium data.
The ABS figures are averaged across all households, including those without a house or contents insurance policy. They measure household spending rather than the average premium paid by policyholders.
| Average weekly household spending on house and contents insurance by state and territory in Australia, 2015–16 | |||
|---|---|---|---|
| State or territory | Per household per week | Annualised | Relative standard error |
| Northern Territory | $22.27 | $1,158 | 8.3% |
| Queensland | $20.32 | $1,057 | 3.4% |
| Tasmania | $17.70 | $920 | 4.9% |
| New South Wales | $17.48 | $909 | 3.0% |
| Western Australia | $16.50 | $858 | 4.6% |
| Australian Capital Territory | $14.48 | $753 | 5.6% |
| South Australia | $13.93 | $724 | 3.3% |
| Victoria | $13.81 | $718 | 2.9% |
| Australia | $16.74 | $870 | 1.6% |
Source · ABS, Household Expenditure Survey, Australia: Summary of Results, 2015–16, Table 13.9A and Table 13.9B_RSE
References
- ACCC, Insurance Monitoring Report, June 2026 · accc.gov.au
- ACCC, Insurance monitoring report 2026 – Supplementary data · accc.gov.au
- ABS, Household Expenditure Survey, Australia: Summary of Results, 2015–16 · Australian Bureau of Statistics
- APRA, Quarterly General Insurance Performance Statistics, March 2026 edition · apra.gov.au
