

Published 25 Aug 2026
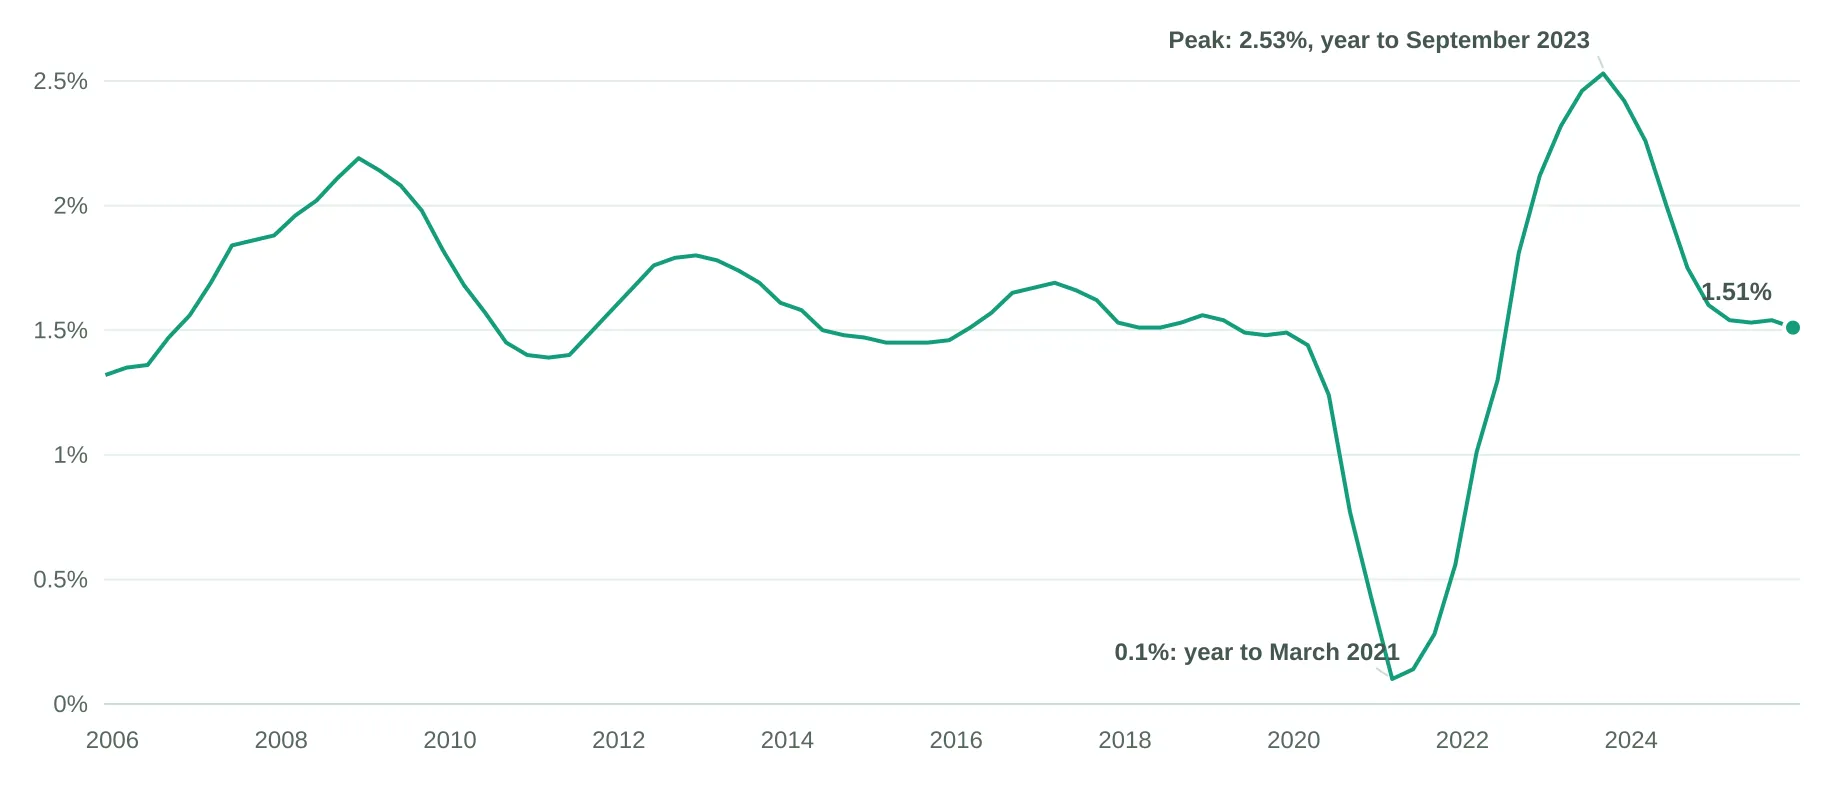 Australia's population in fullThe population article puts city growth alongside births, deaths and migration, the components that took Australia's population to 27.8 million at the end of 2025.
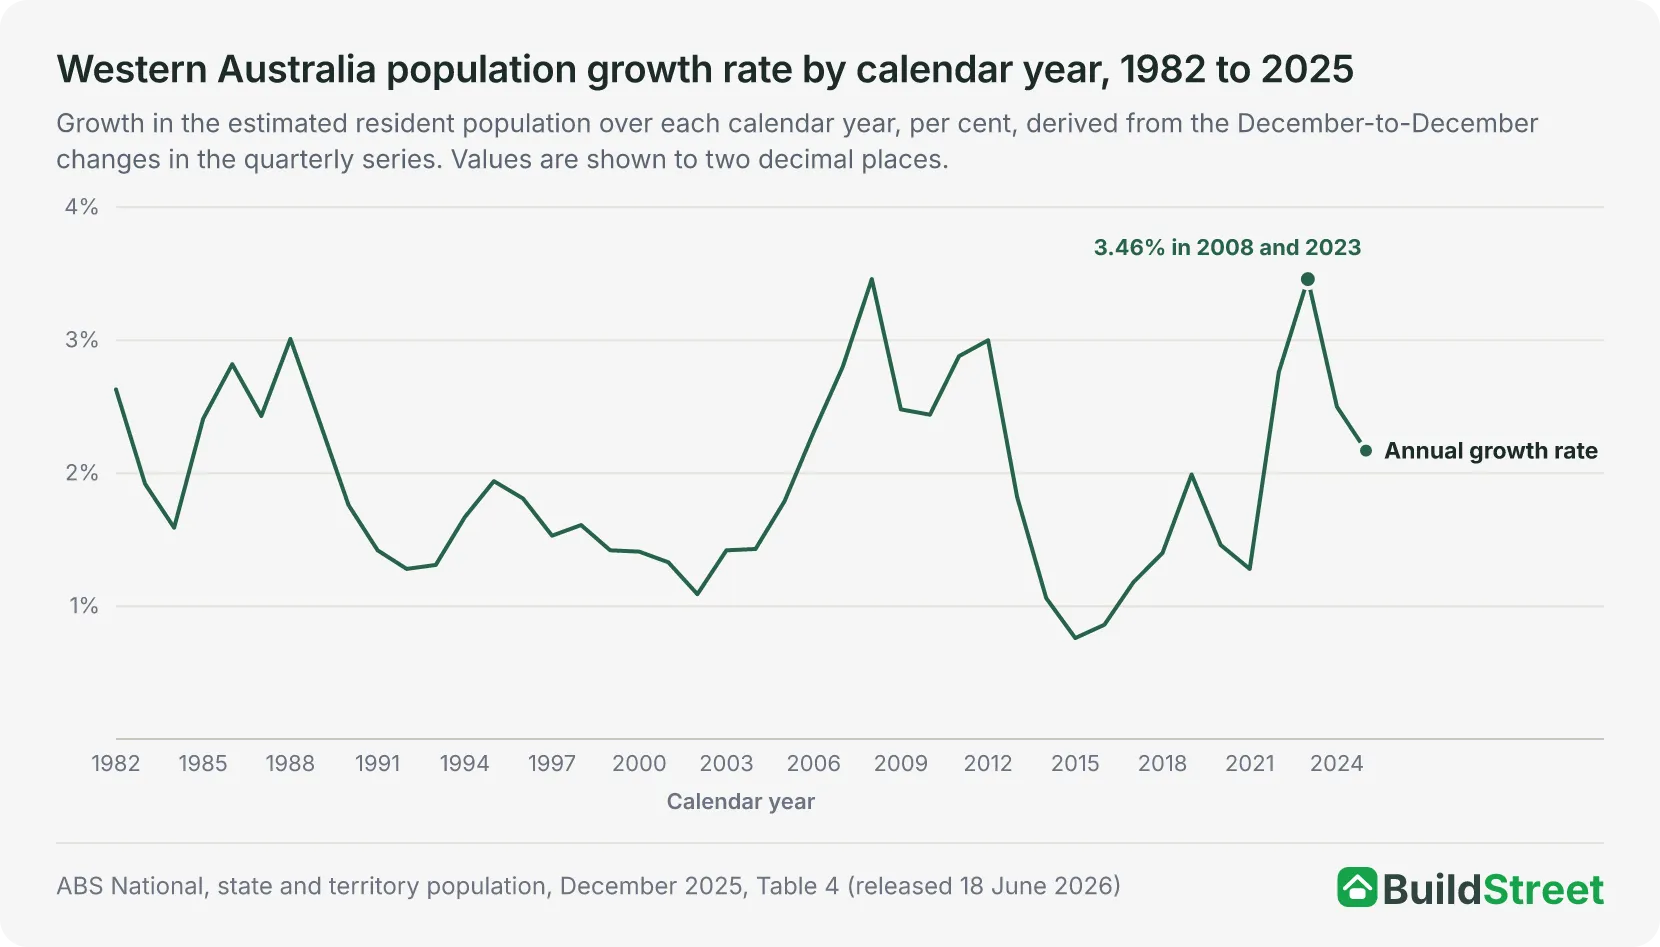 The state behind Perth's growthPerth's growth is part of a wider Western Australian trend. The state article covers WA's population, its growth components and how the state compares over time.
Section 01 · The capitals
What is Australia's fastest-growing capital city?
Perth was the fastest-growing capital city in 2024-25 at 2.4 per cent, ahead of Brisbane at 2.1 per cent and Melbourne at 2.0 per cent; Melbourne added the most people, 105,030.
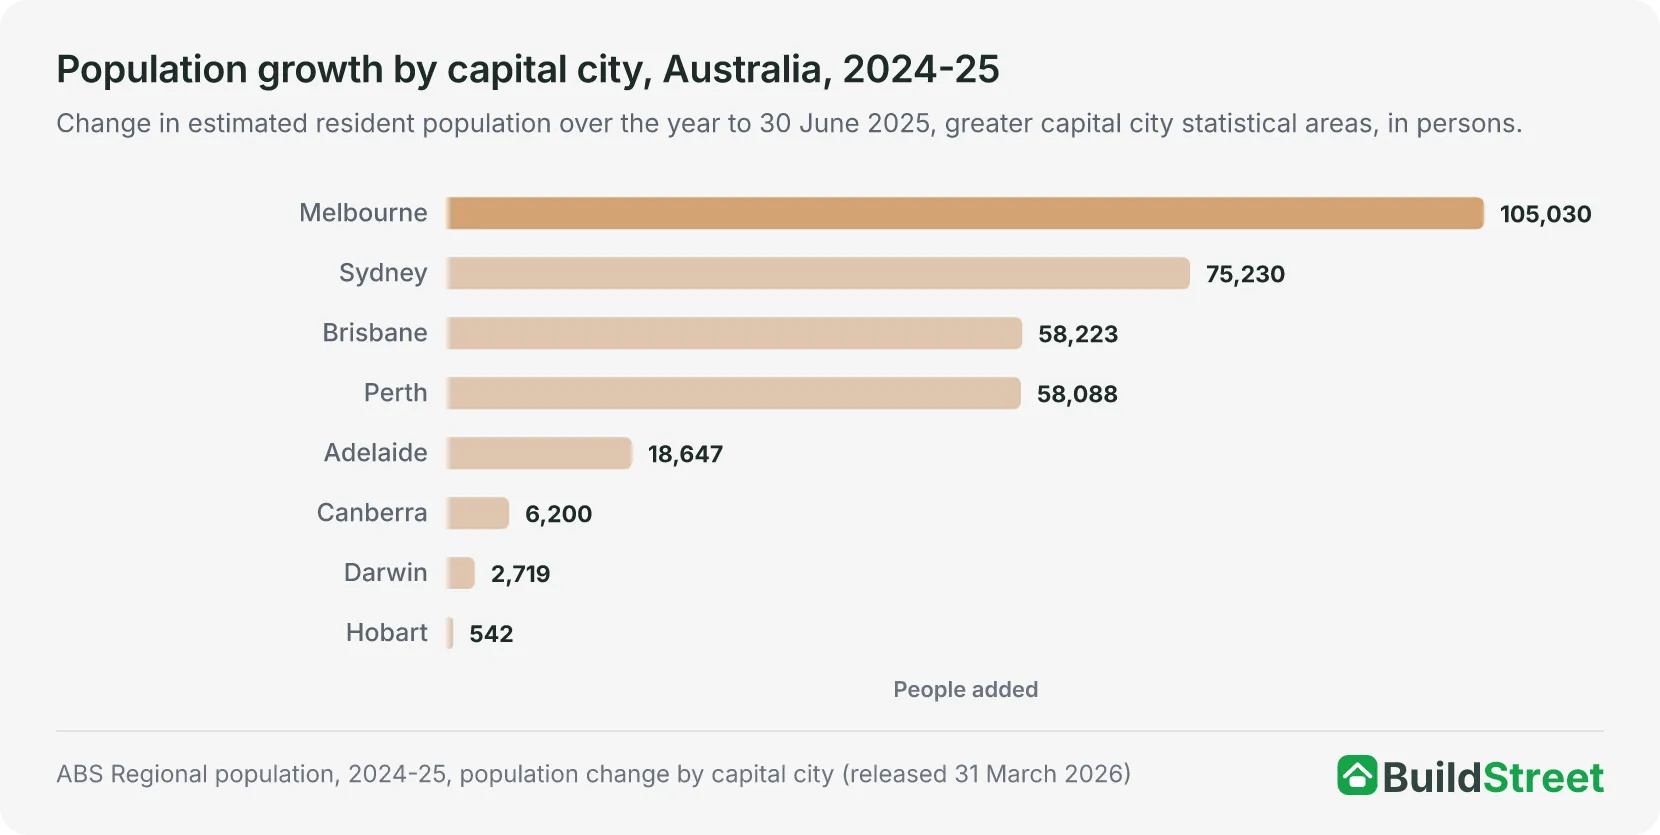
The ranking depends on the measure. On growth rate, Perth had the highest rate among the capitals in 2024-25, at 2.4 per cent, followed by Brisbane at 2.1 per cent and Melbourne at 2.0 per cent1. By number of people added, Melbourne ranked first with 105,030, ahead of Sydney with 75,230, Brisbane with 58,223 and Perth with 58,088.
The two rankings order the capitals differently. Melbourne and Sydney ranked first and second by population increase, while Perth and Brisbane had the two highest growth rates. Sydney's 75,230-person increase was the second largest in the country, but its 1.4 per cent growth rate ranked fifth among the eight capitals, behind Perth, Brisbane, Melbourne and Darwin1. Hobart recorded the smallest change on both measures, adding 542 people at a rate of 0.2 per cent.
| Capital city population and growth, Australia, 2024-25 | |||
|---|---|---|---|
| Capital city | ERP at 30 June 2025 | Change 2024-25 | Growth rate |
| Sydney | 5,638,830 | +75,230 | 1.4% |
| Melbourne | 5,435,590 | +105,030 | 2.0% |
| Brisbane | 2,833,524 | +58,223 | 2.1% |
| Perth | 2,452,765 | +58,088 | 2.4% |
| Adelaide | 1,491,015 | +18,647 | 1.3% |
| Canberra | 484,630 | +6,200 | 1.3% |
| Hobart | 255,250 | +542 | 0.2% |
| Darwin | 159,284 | +2,719 | 1.7% |
| All capital cities | 18,750,888 | +324,679 | 1.8% |
Source · ABS Regional population, 2024-25, population change by capital city and the GCCSA datacube.
Section 02 · City and country
Are Australia's capital cities growing faster than the regions?
The eight greater capital cities grew 1.8 per cent in 2024-25, compared with 1.1 per cent across regional Australia, and accounted for 77.4 per cent of the nation's growth.
The eight greater capital cities added 324,679 people in 2024-25, a growth rate of 1.8 per cent, while regional Australia added 94,689 at 1.1 per cent1. Australia's population reached 27,613,654 at 30 June 2025, an increase of 419,368 over the year. The capitals accounted for 77.4 per cent of that increase, derived by dividing their 324,679 gain by the national 419,3682.
The regional split varied by state and territory. Regional Queensland added the most people of any rest-of-state area in 2024-25, at 39,651, and recorded the highest rest-of-state growth rate, at 1.4 per cent. Regional Western Australia's rate rounds to the same 1.4 per cent, from 8,147 people added. Regional New South Wales added the second-largest number, 25,244, at 0.9 per cent, and regional Tasmania grew 0.3 per cent2.
National context comes from the ABS National, state and territory population quarterly series, which estimated Australia's population at 27,801,023 at 31 December 2025, with annual growth of 412,500 people, or 1.5 per cent3. Australia's population centre, a point around 30 kilometres east of the Ivanhoe township in western New South Wales, moved 2.0 kilometres west in 2024-25. The shift was attributed to strong population growth in Western Australia1.
What this growth means for housing demand is covered in the population growth versus housing supply article.
Share of Australia's 2024-25 growth in the capital cities
77.4%
324,679 of the 419,368 people added nationally in the year to 30 June 2025, derived from the ABS regional series
Section 03 · Regional cities
Which regional cities are growing fastest in Australia?
Gold Coast - Tweed Heads added 12,279 people to reach 761,634 residents, making it Australia's sixth-largest significant urban area, ahead of Newcastle - Maitland with 541,634 and Canberra - Queanbeyan with 521,0494. The Sunshine Coast added 8,018 people, Newcastle - Maitland 6,953 and Geelong 6,360.
Among regional significant urban areas with at least 100,000 residents at 30 June 2024, Geelong had the highest growth rate, at 2.1 per cent. Among all 20 significant urban areas above that threshold, including the capitals, Geelong ranked third overall, behind only Perth at 2.4 per cent and Brisbane at 2.1 per cent, on the unrounded rates, and ahead of Melbourne at 2.0 per cent and the Sunshine Coast at 1.9 per cent4. Regional cities here are significant urban areas, ABS statistical boundaries around built-up urban centres, rather than council or commuting boundaries. The capitals in this ranking are measured on the same urban area boundary, not the greater capital city boundary used elsewhere on this page, although their rates round to the same figures.
Among smaller regional centres, Medowie in New South Wales recorded the highest growth rate among significant urban areas with at least 10,000 residents at 30 June 2024, at 3.2 per cent. Morisset - Cooranbong followed at 2.7 per cent and Gisborne in Victoria at 2.6 per cent4.
| Fastest-growing regional centres with at least 10,000 residents, 2024-25 | ||||
|---|---|---|---|---|
| Regional centre | State | ERP at 30 June 2025 | Change 2024-25 | Rate |
| Medowie | NSW | 17,178 | +537 | 3.2% |
| Morisset - Cooranbong | NSW | 31,333 | +827 | 2.7% |
| Gisborne | Vic | 24,163 | +615 | 2.6% |
| Gympie | Qld | 24,591 | +614 | 2.6% |
| Karratha | WA | 19,659 | +485 | 2.5% |
| Bacchus Marsh | Vic | 27,182 | +651 | 2.5% |
| Camden Haven | NSW | 19,995 | +475 | 2.4% |
| Airlie Beach - Cannonvale | Qld | 16,597 | +372 | 2.3% |
| Busselton | WA | 46,023 | +991 | 2.2% |
| Hervey Bay | Qld | 63,312 | +1,327 | 2.1% |
Source · ABS Regional population, 2024-25, significant urban area datacube.
Section 04 · Council areas
Which council areas grew fastest in 2024-25?
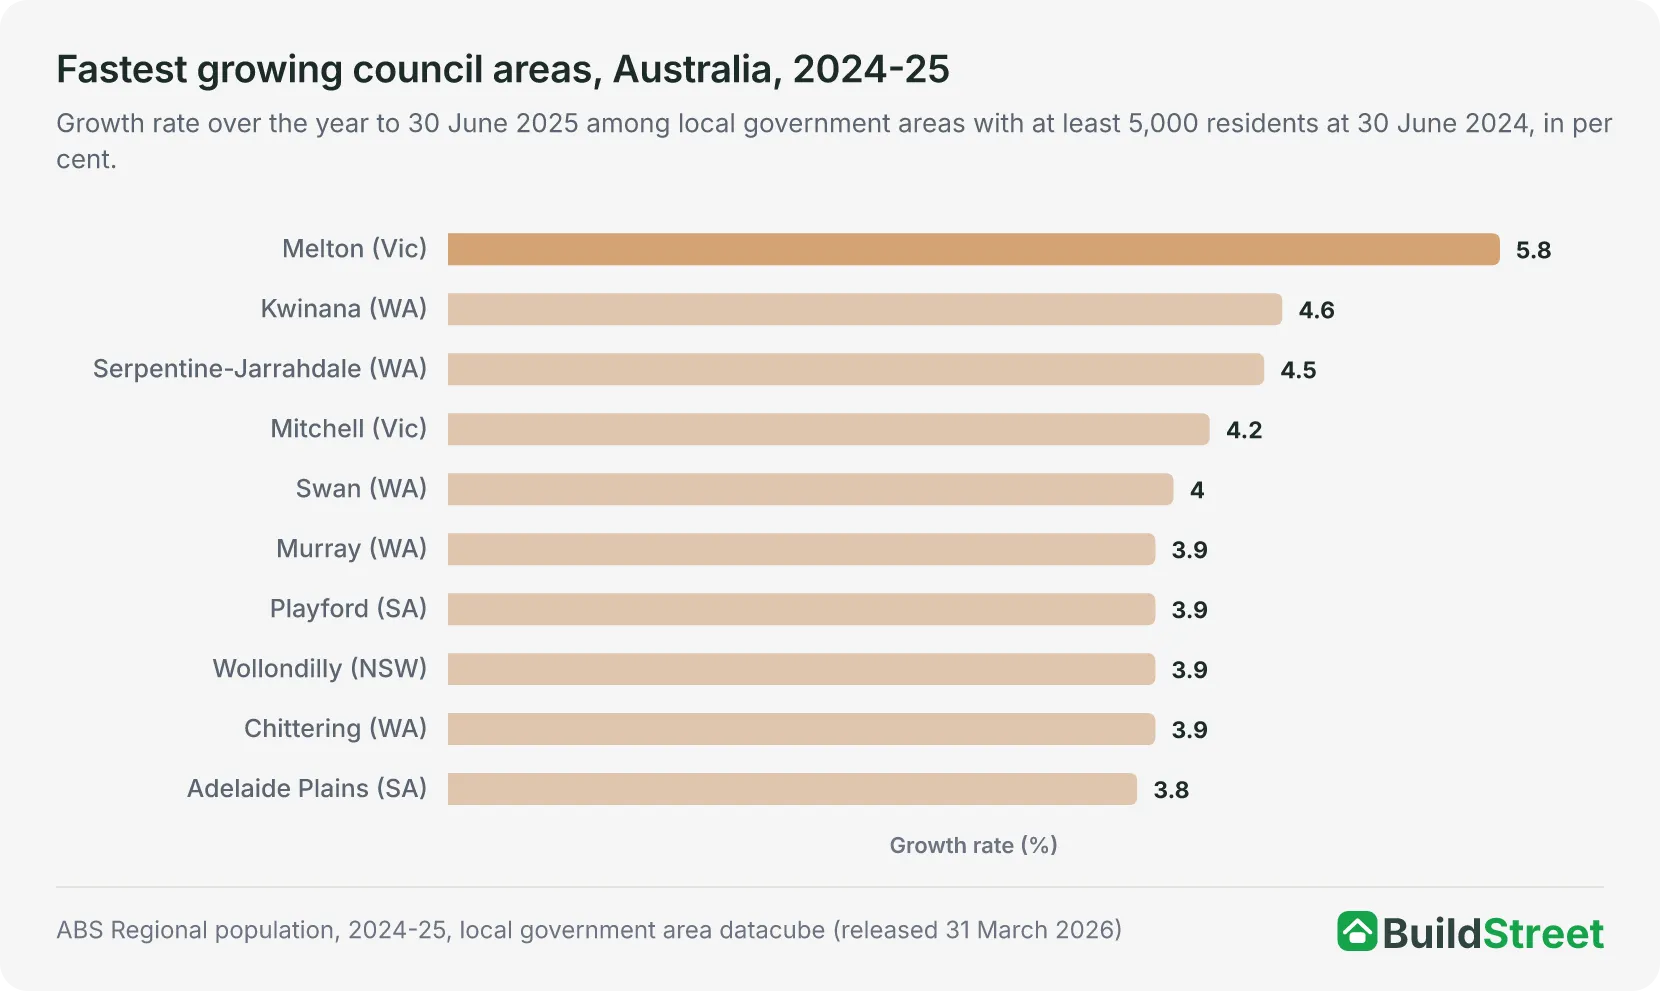
Melton, in Melbourne's outer west, grew 5.8 per cent in 2024-25, the fastest growth rate of any local government area with at least 5,000 residents. The City of Brisbane added the most people, at 21,464.
Melton's population rose from 218,894 to 231,567, an increase of 12,673 and the second-largest population increase of any council area4. Only the City of Brisbane added more people, with its population rising by 21,464, to 1,375,301 residents.
The fastest-growing council areas are concentrated in outer metropolitan areas. Kwinana at 4.6 per cent, Serpentine-Jarrahdale at 4.5 per cent and Swan at 4.0 per cent are on Perth's fringes, and Mitchell at 4.2 per cent is on Melbourne's northern edge. Playford at 3.9 per cent is in Adelaide's north, and Murray and Chittering, both among the ten fastest-growing councils, are on the outer edges of the Perth commuting area4. The minimum population threshold excludes very small areas where small increases can produce high percentage growth. Without it, the highest rate belongs to the Darwin Waterfront Precinct, an ABS-listed area that is not a local government area, at 9.3 per cent, an increase of 30 people on a base of 322.
The finer statistical areas show a similar concentration of high growth in outer metropolitan areas. The largest increases were recorded in Rockbank - Mount Cottrell, up 4,600 people, Fraser Rise - Plumpton, up 4,100, both in Melbourne's outer west, and Mickleham - Yuroke in the outer north, also up 4,100. Excluding areas with fewer than 1,000 people at 30 June 2024, the highest rates were Port Melbourne Industrial at 23 per cent, Berrimah east of Darwin at 22 per cent and Fraser Rise - Plumpton at 20 per cent. Outside the capitals, Caloundra West - Baringa on Queensland's Sunshine Coast had the largest growth, at 2,000 people, and Googong, just outside the Australian Capital Territory, had the highest rate, at 9.7 per cent1.
| Largest council population increases, Australia, 2024-25 | ||||
|---|---|---|---|---|
| Local government area | State | ERP at 30 June 2025 | Change 2024-25 | Rate |
| Brisbane | Qld | 1,375,301 | +21,464 | 1.6% |
| Melton | Vic | 231,567 | +12,673 | 5.8% |
| Wyndham | Vic | 347,830 | +12,510 | 3.7% |
| Logan | Qld | 403,515 | +11,949 | 3.1% |
| Gold Coast | Qld | 691,230 | +11,944 | 1.8% |
| Moreton Bay | Qld | 532,445 | +10,951 | 2.1% |
| Casey | Vic | 414,929 | +10,721 | 2.7% |
| Blacktown | NSW | 449,385 | +9,833 | 2.2% |
| Ipswich | Qld | 268,272 | +9,138 | 3.5% |
| Hume | Vic | 278,885 | +8,122 | 3.0% |
Source · ABS Regional population, 2024-25, local government area datacube.
Section 05 · The drivers
What drives population growth in Australia's capital cities?
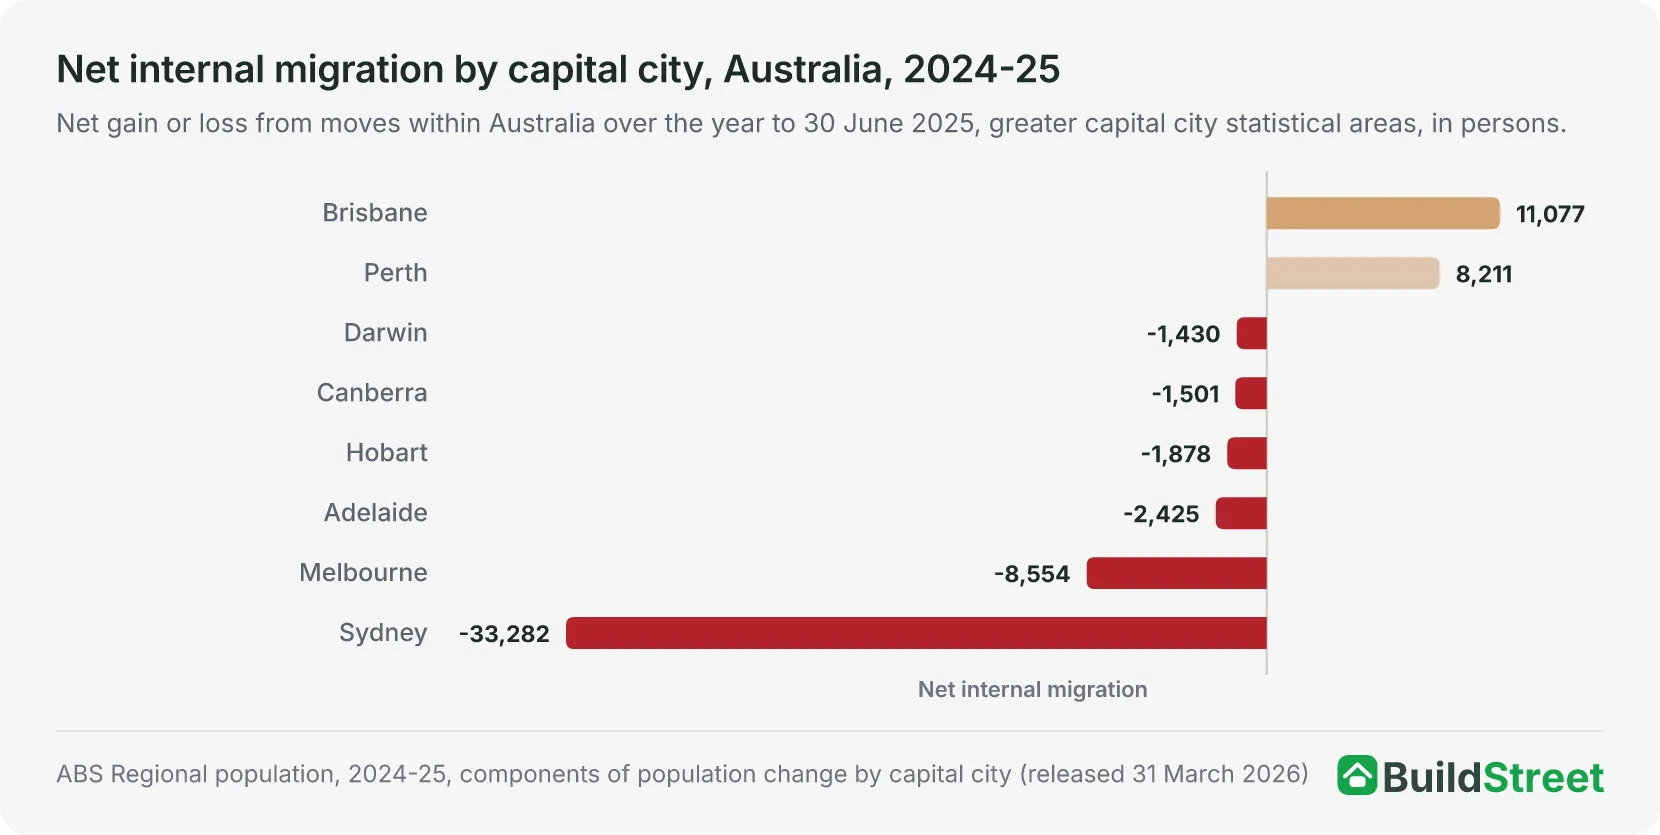
Population change at the city level has three sources: natural increase, net internal migration and net overseas migration. Across the eight capitals, overseas migration added 258,117 people in 2024-25, natural increase added 96,344, and internal migration reduced the total by 29,782, derived by summing the eight capitals' published components1. Melbourne recorded both the largest overseas migration gain, 81,168, and the largest natural increase, 32,416.
Internal migration varied between the capitals. Brisbane and Perth were the only capitals with net internal migration gains in 2024-25, adding 11,077 and 8,211 people respectively from the rest of Australia, while Sydney recorded the largest net internal migration loss, 33,282, followed by Melbourne with 8,5541. Sydney still grew by 75,230 people over the year, because its 78,403 overseas migration gain and 30,109 natural increase more than offset the internal outflow.
Where those domestic moves go, state by state, is covered in the interstate migration article.
| Components of population change by capital city, Australia, 2024-25 | ||||
|---|---|---|---|---|
| Capital city | Natural increase | Internal migration | Overseas migration | Total change |
| Sydney | +30,109 | -33,282 | +78,403 | +75,230 |
| Melbourne | +32,416 | -8,554 | +81,168 | +105,030 |
| Brisbane | +13,212 | +11,077 | +33,934 | +58,223 |
| Adelaide | +3,248 | -2,425 | +17,824 | +18,647 |
| Perth | +12,588 | +8,211 | +37,289 | +58,088 |
| Hobart | +587 | -1,878 | +1,833 | +542 |
| Darwin | +1,302 | -1,430 | +2,847 | +2,719 |
| Canberra | +2,882 | -1,501 | +4,819 | +6,200 |
Source · ABS Regional population, 2024-25, components of population change by capital city.
Section 06 · The long run
Is Melbourne catching up with Sydney in population?
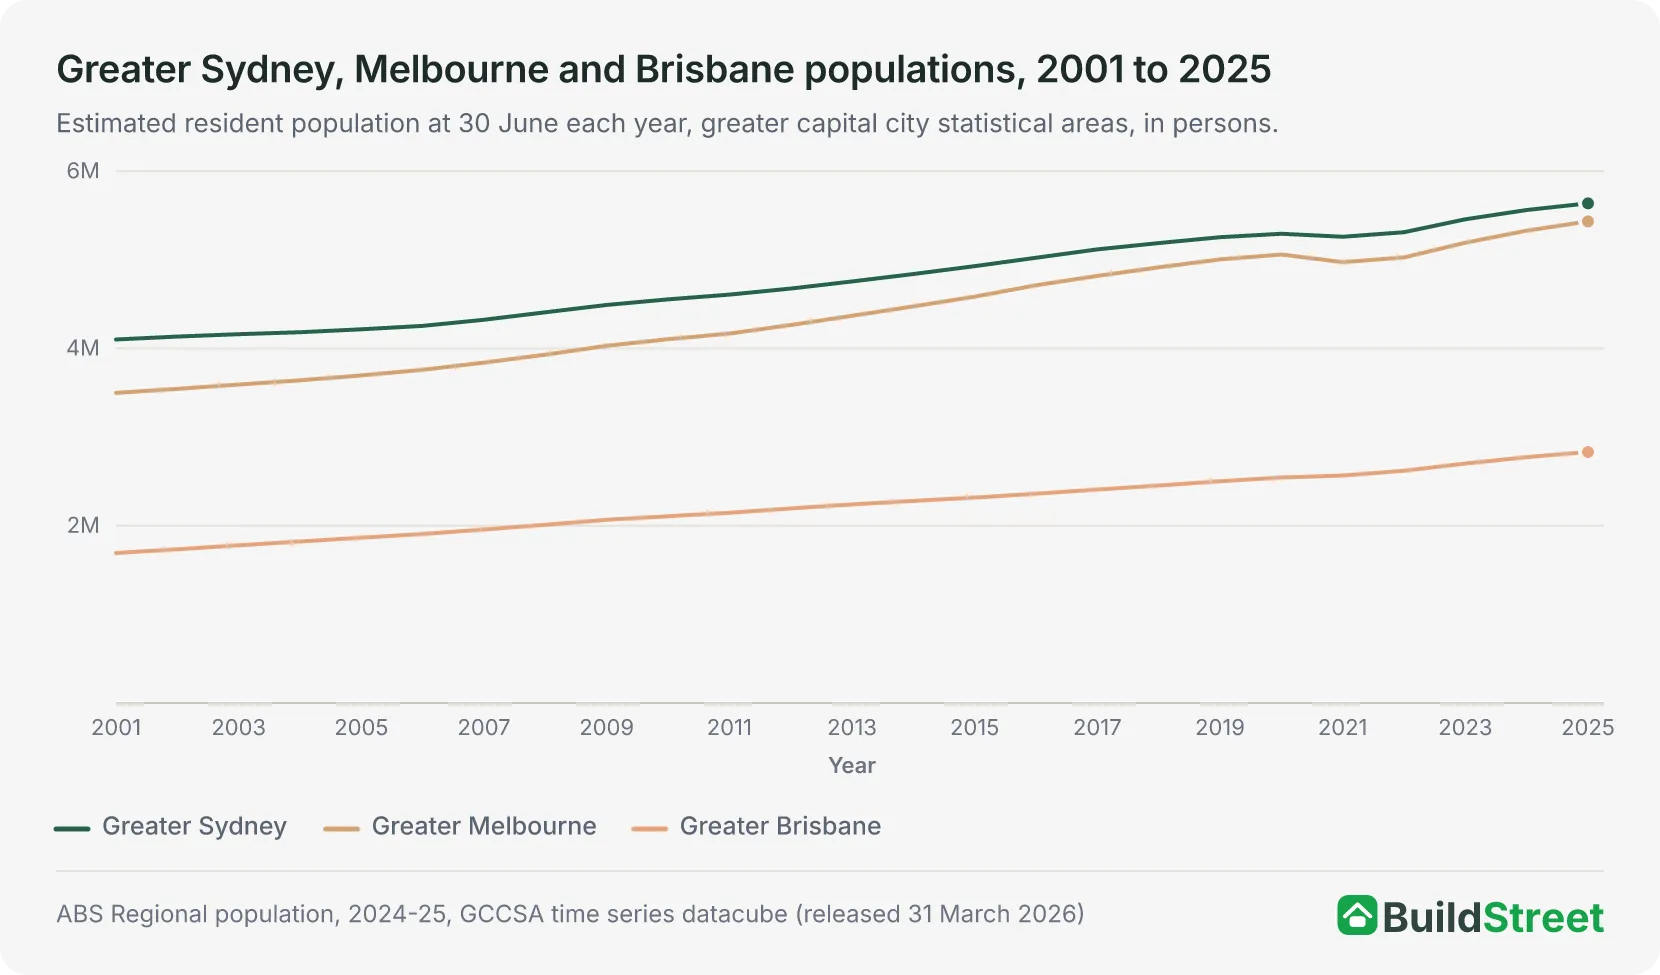
Sydney remained larger than Melbourne on the greater capital city boundary, although its lead has narrowed since 2001. On the significant urban area boundary, which measures the built-up urban area, Melbourne was larger.
The gap narrowed by about two-thirds over the 24 years to 30 June 2025. Greater Sydney's lead over Greater Melbourne fell from 602,331 people at 30 June 2001 to 203,240 at 30 June 2025, derived from the two cities' estimates at each date2. Melbourne added 1,935,341 people between 2001 and 2025 compared with Sydney's 1,536,250. Melbourne's growth rate exceeded Sydney's in every year of the series except 2020-21, the year both cities recorded their only population falls. In 2024-25, the gap narrowed by 29,800 people, the difference between Melbourne's 105,030 increase and Sydney's 75,230.
Which city is larger depends on the boundary used. Using the significant urban area boundary, Melbourne had 5,328,274 residents and Sydney had 5,219,674 at 30 June 2025. The difference partly reflects the Central Coast, whose 354,189 residents are counted as a separate urban area rather than as part of Sydney4. On the greater capital city boundary used elsewhere on this page, Sydney remained larger.
Melbourne's growth story in full is covered in the Melbourne population article.
| Sydney and Melbourne population by ABS boundary, 2025 | ||
|---|---|---|
| City | Greater capital city (GCCSA) | Urban area (SUA) |
| Sydney | 5,638,830 | 5,219,674 |
| Melbourne | 5,435,590 | 5,328,274 |
Source · ABS Regional population, 2024-25, GCCSA and SUA datacubes.
Section 07
Fastest growing cities: quick answers
What is the fastest growing city in Australia?
Perth was the fastest-growing capital city in Australia in 2024-25, growing 2.4 per cent in the year to 30 June 2025, ahead of Brisbane at 2.1 per cent and Melbourne at 2.0 per cent. By population increase, Melbourne ranked first, adding 105,030 people.
Which Australian city added the most people in 2024-25?
Greater Melbourne added the most people of any Australian capital city in 2024-25, at 105,030, ahead of Sydney with 75,230, Brisbane with 58,223 and Perth with 58,088. The figures are estimated resident population changes over the year to 30 June 2025.
What is the fastest growing regional city in Australia?
Geelong was the fastest-growing regional city in 2024-25 among significant urban areas outside the capitals with at least 100,000 residents, growing at 2.1 per cent. Gold Coast - Tweed Heads added the most people of any regional city, 12,279. Among regional centres with at least 10,000 residents at 30 June 2024, Medowie in New South Wales had the highest rate, 3.2 per cent.
What is the fastest growing council area in Australia?
Melton, in Melbourne's outer west, was the fastest-growing council area in 2024-25 among local government areas with at least 5,000 residents at 30 June 2024, growing 5.8 per cent. The City of Brisbane added the most people of any council area, 21,464.
Is Melbourne bigger than Sydney?
Sydney was larger than Melbourne on the greater capital city boundary as at 30 June 2025, with populations of 5,638,830 and 5,435,590 respectively. On the significant urban area boundary Melbourne was larger, with 5,328,274 residents compared with Sydney's 5,219,674, mainly because the Central Coast's 354,189 people are counted as their own urban area rather than as part of Sydney.
Are Australia's capital cities growing faster than the regions?
The eight greater capital cities grew 1.8 per cent in 2024-25, while regional Australia grew 1.1 per cent. The capitals added 324,679 of the 419,368 people Australia gained in the year to 30 June 2025, accounting for 77.4 per cent of national growth, derived by dividing the capitals' increase by the national increase.
References
- ABS: Regional Population, 2024–25 · Australian Bureau of Statistics ↑ b c d e f g
- ABS Regional population, 2024-25: population estimates by SA2 and above, 2001 to 2025 (datacube 32180DS0003) · Australian Bureau of Statistics ↑ b c
- ABS, National, state and territory population, December 2025 · Australian Bureau of Statistics ↑
- ABS Regional population, 2024-25: population estimates by LGA and Significant Urban Area, 2001 to 2025 (datacube 32180DS0004) · Australian Bureau of Statistics ↑ b c d e f
