

Published 6 Aug 2026
Insurance premiums, rebuilding costs and climate-related disasters have all increased the potential for home insurance underinsurance in Australia.
Insurance prices in Australia rose 52.7% between the December quarter of 2019 and the March quarter of 2026, according to the Australian Bureau of Statistics' (ABS) Consumer Price Index (CPI) insurance subgroup. Over the same period, the ABS Producer Price Index (PPI) for house construction output shows that prices rose 48.3%. This means the cost of construction work increased by almost half during the period under review. Based on these figures, a sum insured set in December 2019 and never adjusted would equal about 67.4% of the equivalent March 2026 index value, an index-based shortfall of 32.6%.
 Are some Australian homes becoming harder to insure?APRA's climate stress test in full, premium trends by region, the cyclone reinsurance pool, and how availability and affordability are measured separately.
 Owner-builder insurance requirements in Australia: rules by state and territoryOwner-builders are not covered for defects in their own work under any operating statutory home warranty scheme in Australia. Four of eight states and territories exclude owner-built work outright, wh…
Section 01 · Definitions
What is underinsurance and how does it differ from non-insurance?
Non-insurance means holding no building policy at all. Underinsurance means holding a policy, but the payout would fall short of the full cost of rebuilding or replacing what is covered. The two are often reported together, but they measure different things and cannot be added, averaged or substituted for one another.
The ACCC estimated that about 20% of potentially insurable properties in Northern Australia and about 11% in the rest of Australia had no home building insurance. This is non-insurance. Separately, the Melbourne Institute's HILDA Statistical Report 2025 found that 7.8% of insured homeowners said their policy would not fund a full rebuild. This is underinsurance.
The full cost of rebuilding can only be confirmed once a property is a total loss. In every other case, the sum insured is tested against an estimate that cannot itself be verified. This means the estimate depends on the costs and conditions that could reasonably be anticipated when it was made. If building costs rise unexpectedly, even a household with cover based on an earlier estimate can end up short. This measurement problem was first identified in 2005 and has not changed.
While Australia has reasonably good data on how many properties have no cover, it has almost none on how many have cover that is too low.
Underinsurance
Has a policy, sum insured too low
- Historical estimates, 2000 and 2002
27.5% to 81%
- Average shortfall where measured
27% to 40%
- Current self-reported estimate
7.8%
- Verified administrative estimate
None
Non-insurance
Has no policy at all
- Home building, northern Australia
About 20%
- Home building, rest of Australia
About 11%
- Renters without contents cover
About 40%
Cost pressure
Whether cover keeps pace
- Insurance prices
+52.7%
- House construction prices
+48.3%
- Period measured
Dec 2019 to Mar 2026
Source · ASIC, Getting home insurance right, 2005, pp. 12, 14, 15 and 16; ACCC, Northern Australia Insurance Inquiry second interim report, 2019, pp. 122 and 125; ABS, Consumer Price Index, Australia, March 2026, and Producer Price Indexes, Australia, March 2026. The historical estimates used different samples and methods, so they are not directly comparable or representative of the current national position. The shortfall range measures the size of the gap among selected households, not how many households were underinsured. No verified national estimate exists. Non-insurance figures use 2016–17 data for Northern Australia, 2017–18 data for the rest of Australia and June 2019 data for renters.
Section 02 · National prevalence
Building and contents insurance cover falls short for some Australians
In 2023, 7.8% of Australian homeowners with building insurance said their policy would not fund a complete rebuild, while 15.1% of people with contents insurance said their cover would not replace all their contents.
A further 3.7% of homeowners had no building insurance at all, and 30% of Australians lived in a home with no contents cover. Building underinsurance was no more common among mortgage holders than among people who owned outright; the survey found that the difference was not statistically significant.
The Household, Income and Labour Dynamics in Australia Survey (HILDA) introduced these questions in its 2023 survey wave, providing Australia's most recent national self-reported measure of underinsurance. Because the results rely on self-reporting, they may miss households that do not realise their own cover falls short. The Australian Competition and Consumer Commission (ACCC) says underinsurance cannot be reliably estimated, and the Australian Prudential Regulation Authority (APRA) excluded it from its 2026 climate stress test because it was too complex to model. An earlier national survey by Quantum Market Research in 2013 used a broader definition of underinsurance and is therefore not directly comparable.
Melbourne Institute, HILDA Statistical Report 2025, chapter 6, pp. 132 to 140; Quantum Market Research, 2013, cited in Productivity Commission, Natural Disaster Funding Arrangements, Volume 2, 2014, Box 5.8, pp. 448 to 449.
How underinsurance is measured in the HILDA Survey
The 7.8% and 15.1% figures both come from a single yes/no question, which shapes what the numbers can and cannot show. Homeowners with building insurance were asked whether their insurance would cover a complete rebuild if their home needed one. People with contents insurance were asked whether a claim would cover replacing all their contents.
That makes this a measure of what households believe about their own cover. It records respondents who believe their policy falls short, but it cannot identify households that incorrectly believe they have enough cover. The 7.8% result is a self-reported estimate, not a verified comparison between each policy and an independently assessed rebuild cost. Respondents may misjudge adequacy in either direction, so the result should not be described as a statistically verified floor.
Why Australian homeowners report being underinsured
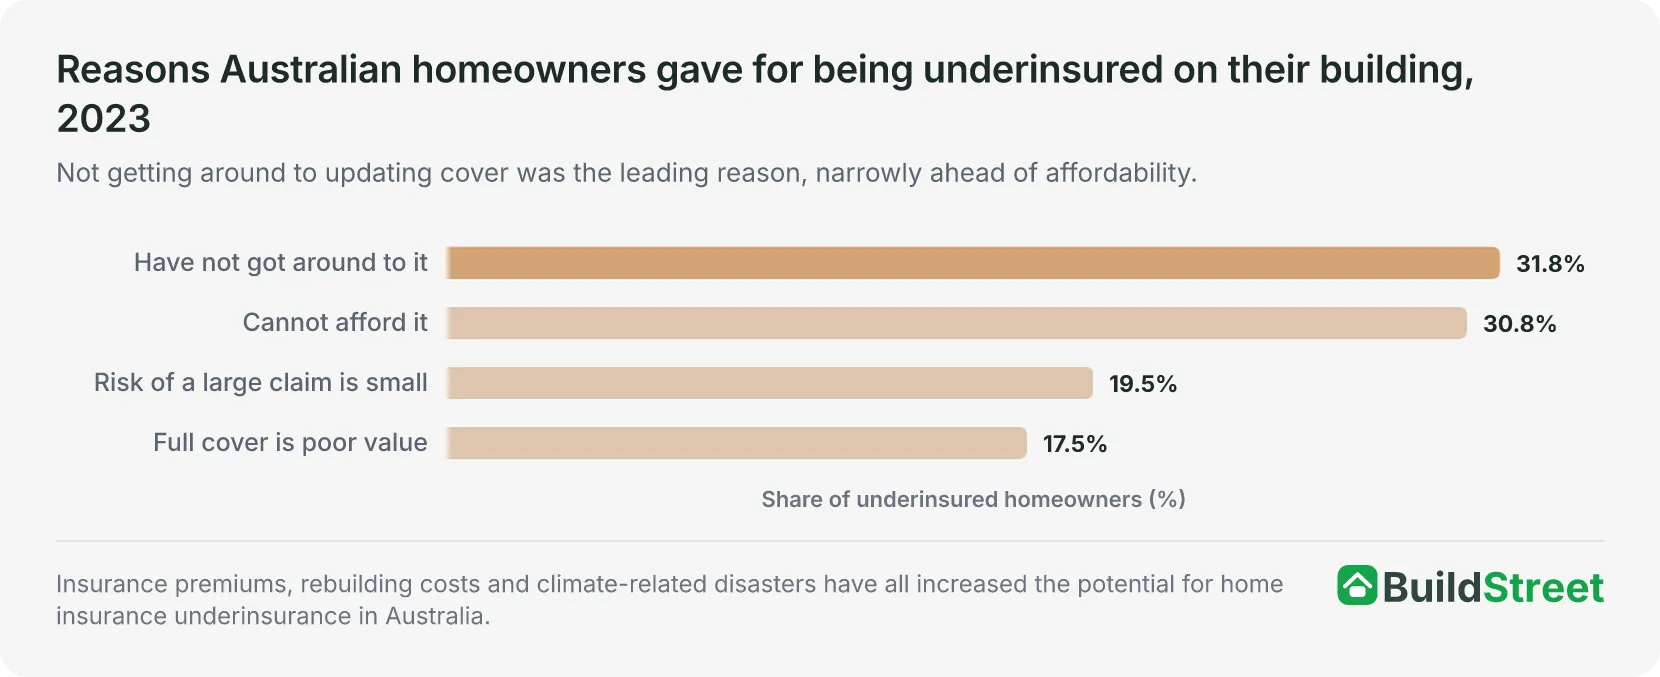
Not updating cover was the most common reason homeowners gave for being underinsured on their building:
- Had not got around to updating their cover: 31.8%
- Said cover was unaffordable: 30.8%
- Thought the risk of a large claim was small: 19.5%
- Thought full cover was poor value: 17.5%
The pattern for contents insurance was almost identical, with 33.7% citing affordability and 31.4% saying they had not got around to updating their cover.
Contents insurance shortfalls are more common than building insurance shortfalls
Contents insurance ownership varies by tenure: 90.4% of outright owners and 84.7% of owners with a mortgage hold it. This compares with 30.6% of private renters and 14.9% of social housing tenants. This is a different pattern from building cover.
Once a household has a policy, the reported adequacy of that cover is relatively consistent across most tenure groups. Underinsurance rates for contents were 15% among homeowners and 15.1% among private renters. The exception is social housing, where, among the 14.9% of tenants who hold contents insurance, 27.1% say it would not replace what they own.
| Housing tenure | Have contents insurance | Of those, underinsured |
|---|---|---|
| Owner outright | 90.4% | 15.0% |
| Owner with mortgage | 84.7% | 15.0% |
| Private rental | 30.6% | 15.1% |
| Social housing | 14.9% | 27.1% |
Source · Melbourne Institute, HILDA Statistical Report 2025, Figures 6.1, 6.2 and 6.4, pp. 133 and 139.
Why Australia has no official underinsurance statistic
The 7.8% figure captures only one version of the question. It records how many households believe their cover falls short, but does not test any policy against an actual rebuilding cost. This means it cannot identify the households that would discover a shortfall only after a total loss. No Australian source measures that, and no Commonwealth statistical agency publishes an underinsurance figure.
The ACCC set out why in its 2019 Northern Australia inquiry. Its consumer research allowed inferences about the potential for underinsurance, but concluded that underinsurance could not be estimated across a general region with confidence and drew no conclusions about its prevalence.
Measuring underinsurance outside a disaster would mean assessing the appropriate level of cover for each individual property and its contents, then comparing that against the sum insured that the household has nominated.
It would also require subjective judgements about what an appropriate level of cover looks like. The ACCC described assessing enough individual properties to produce even a regional estimate as a costly undertaking.
Other bodies have reached a similar conclusion:
- APRA modelled around 10 million houses out to 2050 in its March 2026 stress test, working with five insurers that write about 80% of the home insurance market. The report states that underinsurance was not directly modelled because of its complexity.
- The ABS has been approved to link insurers' policy data, including sums insured, to its integrated data asset, but that project was still listed as open in July 2026 with no analytical release.
- The ACCC's insurance monitoring role ended on 30 June 2026 without producing a measure.
Section 03 · Costs and premiums
How insurance prices and rebuilding costs have changed since 2019
Although insurance prices and house construction output prices both rose sharply between late 2019 and early 2026, they followed different paths.
House construction prices rose first, reaching an annual increase of 20.5% in the September quarter of 2022. Insurance prices peaked six quarters later, at 16.4% in the March quarter of 2024. Both annual growth rates subsequently slowed.
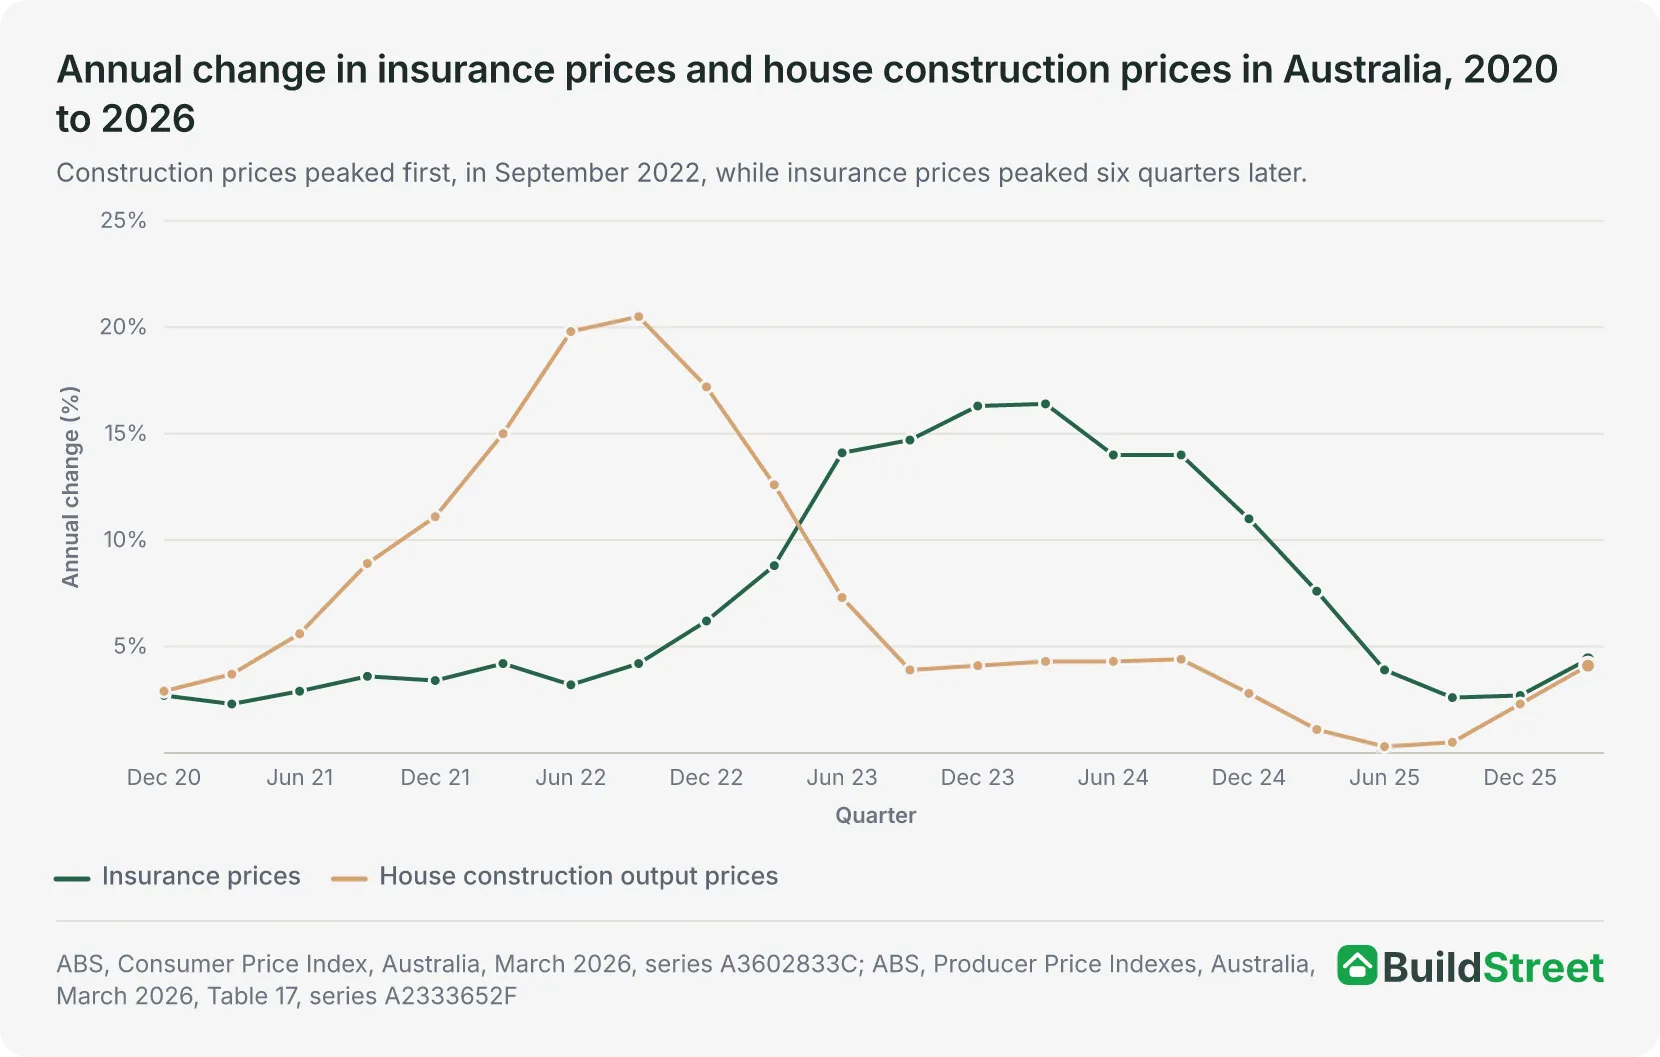
Rebuild costs rose first, increasing the sum insured required to keep pace with construction prices. Insurance prices followed, increasing the cost of maintaining cover. Those pressures overlapped for about two years and may have increased the risk of inadequate cover, although the available data do not quantify that effect.
Both annual growth rates have slowed from their peaks. In the year to March 2026, insurance prices rose 3.7%, while house construction output prices rose 4.1%.
Insurance prices
- Peak annual rise
+16.4%
- When
Mar qtr 2024
- Year to Mar 2026
+3.7%
House construction prices
- Peak annual rise
+20.5%
- When
Sep qtr 2022
- Year to Mar 2026
+4.1%
Source · Source: ABS, Consumer Price Index, Australia, March 2026, insurance subgroup series A3602833C; ABS, Producer Price Indexes, Australia, March 2026, Table 17, house construction output series A2333652F.
The annual increase in insurance prices peaked in early 2024 and had slowed substantially by March 2026. However, the cumulative increases in insurance and construction price indexes since 2019 remain. These data do not show how much those increases changed the prevalence of underinsurance.
How rebuilding costs and premiums can affect insurance cover
Rising construction costs are one of two main routes by which APRA's modelling expects Australia's insurance protection gap to widen over the 25 years to 2050. The two 2026 stress tests that APRA ran to that year treat the relationship between rebuild costs and premiums as a forward risk:
- Physical risk dominates: more frequent and severe weather events push premiums up.
- Economic transition dominates: weather losses matter less, and rising construction costs become the main factor pushing premiums higher instead.
How rising insurance costs may contribute to underinsurance
The House Standing Committee on Economics reported in October 2024 on insurers' responses to the 2022 floods. In its chapter on policy design, the committee noted evidence from insurer submissions that some policyholders were reducing their sums insured compared with previous years to help manage rising premium costs. The submissions came from Insurance Australia Group and Suncorp Group.
The ACCC reported a similar finding the following year. Its fourth insurance monitoring report, published in July 2025, included a section titled Affordability pressures are contributing to underinsurance and non-insurance.
This is also consistent with the ACCC's findings from five years earlier. It found that 19% of Northern Australian residents with a sum insured policy had either contacted an insurer's call centre or used its online calculator to help determine their sum insured. Of those policyholders, 17% chose a lower sum insured than the amount recommended, with cost being the main reason given.
Section 04 · State comparison
How rebuilding cost increases vary across Australian states and territories
House construction prices have not risen uniformly across Australia. Since December 2019, the output price index has doubled in Western Australia and risen by less than a fifth in the Northern Territory. The remaining states and territories fall between these two extremes, creating a spread of more than 80 percentage points across the country.
This variation has a direct consequence. Homeowners who set their sum insured at a given point and never updated it may now face a different index-based shortfall depending on where they live and when the amount was last reviewed.
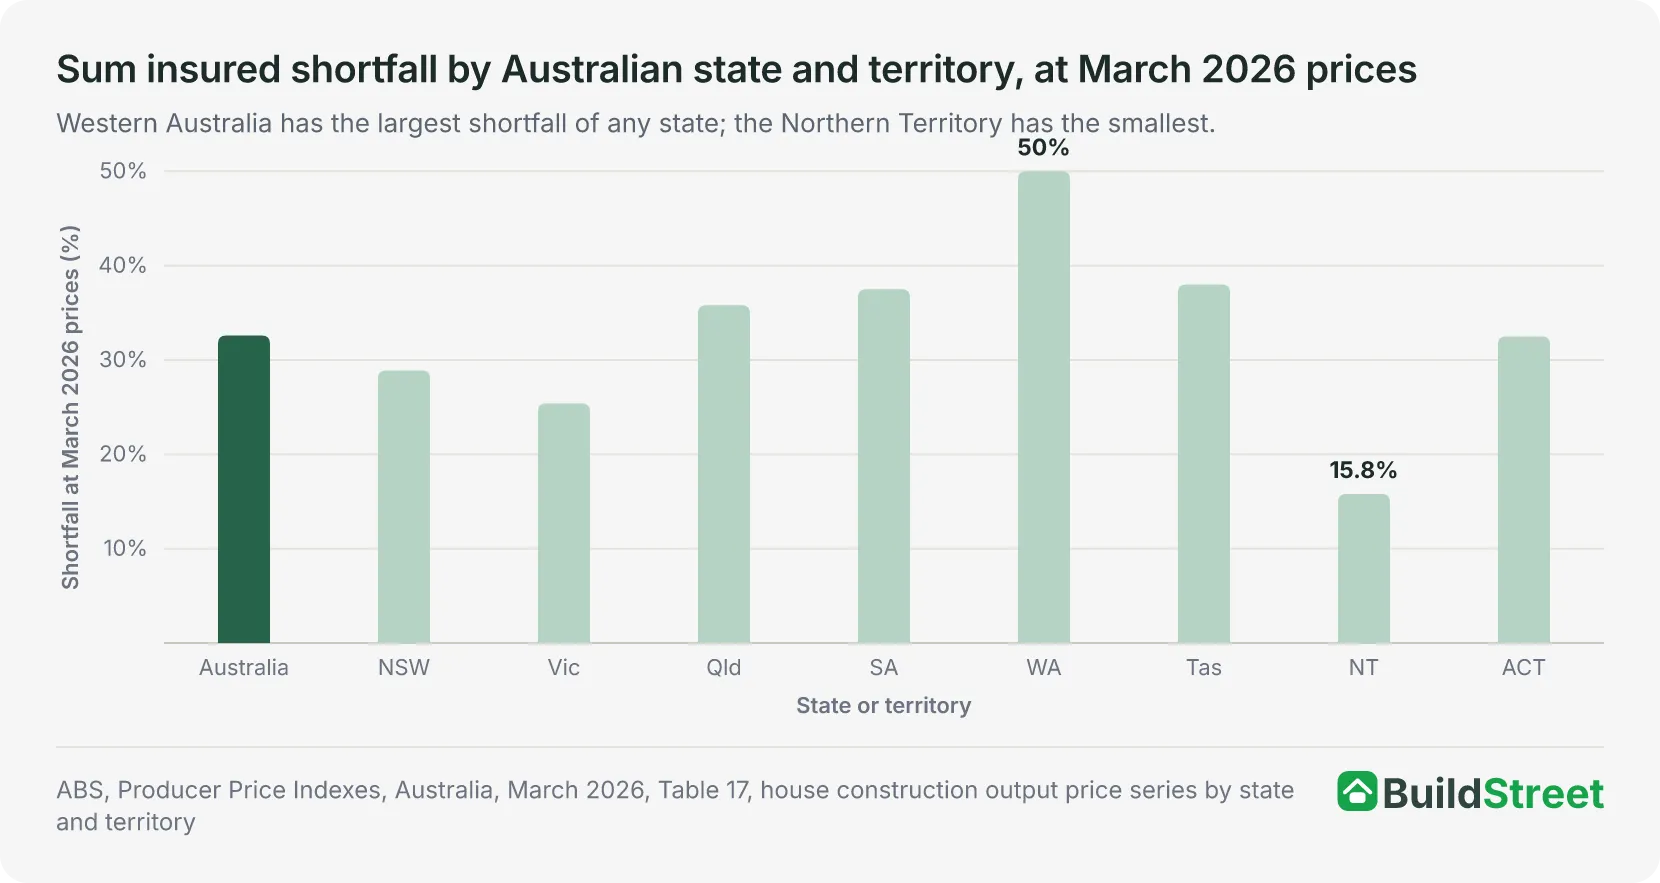
Average approved construction values across Australian states and territories
The average approved construction value of a new Australian house was $514,782 in the 12 months to May 2026. This was based on 118,743 new house approvals with a combined construction value of $61.1 billion. While price indexes show how construction costs have changed over time, they do not indicate the dollar cost of building a home. Building approval data therefore provide a separate benchmark for approved construction values.
| State or territory | Construction price change since Dec 2019 | Shortfall on an unadjusted 2019 sum insured | Average approved value per new house |
|---|---|---|---|
| Western Australia | +100.1% | 50.0% | $470,879 |
| Tasmania | +61.4% | 38.0% | $427,772 |
| South Australia | +60.0% | 37.5% | $436,687 |
| Queensland | +55.8% | 35.8% | $526,026 |
| Australian Capital Territory | +48.1% | 32.5% | $506,350 |
| New South Wales | +40.7% | 28.9% | $562,780 |
| Victoria | +34.0% | 25.4% | $527,289 |
| Northern Territory | +18.8% | 15.8% | $542,724 |
| Australia | +48.3% | 32.6% | $514,782 |
Source · ABS, Producer Price Indexes, Australia, March 2026, Table 17; ABS, Building Approvals, Australia, May 2026, Tables 22 to 29.
Western Australia is the outlier in both directions of this table: it recorded the largest price increase and one of the lower average approved construction values.
Section 05 · Disaster evidence
What Australia's 2022 floods show about underinsurance
Four declared flood events in 2022 produced 305,769 claims worth $7.73 billion, and 32 people died. Despite this scale, Australia has no comparable national series measuring underinsurance across hazard or individual events. What does exist is a set of separate post-disaster findings, gathered under different methods, plus the claims record from those floods.
CAT 221, the south-east Queensland and northern New South Wales event, accounted for 244,398 claims and $6.32 billion. The Insurance Council of Australia described CAT 221 as the costliest insurance event in Australian history in non-normalised cost terms.
| Event | Claims lodged | Incurred cost | Closed |
|---|---|---|---|
| CAT 221, south-east Qld and northern NSW | 244,398 | $6.32b | 98.4% |
| SE 222 | 23,618 | $296.9m | 98.7% |
| CAT 223 | 22,890 | $859.6m | 96.0% |
| SE 224 | 14,863 | $257.0m | 97.9% |
| Total | 305,769 | $7.73b | 98.3% |
Source · Parliament of Australia, House Standing Committee on Economics' Flood Failure to Future Fairness, October 2024, Table 2.2 and paragraph 6.32, using data provided by the Insurance Council of Australia.
None of these figures measures underinsurance. They show the number and cost of claims, not whether the amount paid was enough to rebuild or replace what was insured. The committee did not publish a count of claims affected by inadequate sums insured, and no official national source provides one.
Historical disasters have increased rebuilding costs by up to 75%
Historical records show that rebuilding costs have increased by as much as 75% after a major disaster. When many homes are damaged in one area, increased demand for builders and materials can raise local rebuilding costs. This means a sum insured that was adequate before an event may become insufficient afterwards.
| Event | Year | Recorded effect |
|---|---|---|
| Cyclone Tracy, Darwin | 1974 | Rebuilding costs reportedly increased by 75% |
| Newcastle earthquake | 1989 | Rebuilding costs reportedly increased by 35% |
| ACT bushfires | 2003 | 488 homes destroyed; ASIC's homeowner survey identified 6 homeowners with no building insurance |
| ACT bushfires, shortfall among those who rebuilt | 2003 | 27% underinsured average across 19 comparable rebuilds (ASIC); the Insurance Disaster Response Organisation reported destroyed structures underinsured by 40% average replacement cost |
| Blue Mountains bushfires | 2013 | Insurance Australia Group reported 35% of affected residents were underinsured, based on analysis of NRMA Insurance claims data |
Source · ASIC, Getting home insurance right, 2005, pp. 12 to 14; Productivity Commission, Natural Disaster Funding Arrangements, Volume 2, 2014, pp. 448 to 449.
The cited evidence measures different outcomes, rebuilding-cost increases of 35% to 75%, average shortfalls among selected households, and underinsurance prevalence among residents affected by a particular disaster. These findings are not directly comparable and cannot be used to estimate national underinsurance. They show that the scale and form of underinsurance can vary by event, location and methodology.
Section 06 · Renters and contents
Contents insurance remains uncommon among Australian renters
Around 40% of Australian renters have no contents insurance, compared with roughly 6% to 7% of homeowners. Those figures measure who holds a policy, not whether that policy is large enough. What follows describes non-insurance rather than underinsurance.
Renters were the group least likely to hold contents insurance: 59% in Northern Australia and 58% in the rest of Australia said they had contents cover, meaning around 40% did not. Among homeowners, 93% in Northern Australia and 94% elsewhere had contents insurance. Only 60% of people aged 18 to 29 reported having contents insurance.
Contents insurance, Northern Australia
- Homeowners
93%
- Renters
59%
- All residents
83%
Contents insurance, rest of Australia
- Homeowners
94%
- Renters
58%
- All residents
82%
Source · ACCC, Northern Australia Insurance Inquiry second interim report, 2019, pp. 124 and 125. Survey conducted in June 2019 by Susan Bell Research for the ACCC. The Northern Australia sample was a mobile phone survey of 1,600 residents with quotas by age, gender, state and territory. The rest of Australia comparison used an online survey of 500 residents.
Cost was the dominant reason in both cases. Among residents without contents insurance who had considered taking out a policy, 42% said they could not afford the premium, while 36% said they could not justify the cost. A further 19% believed their contents were not worth insuring, compared with just 3% of homeowners who had no building insurance.
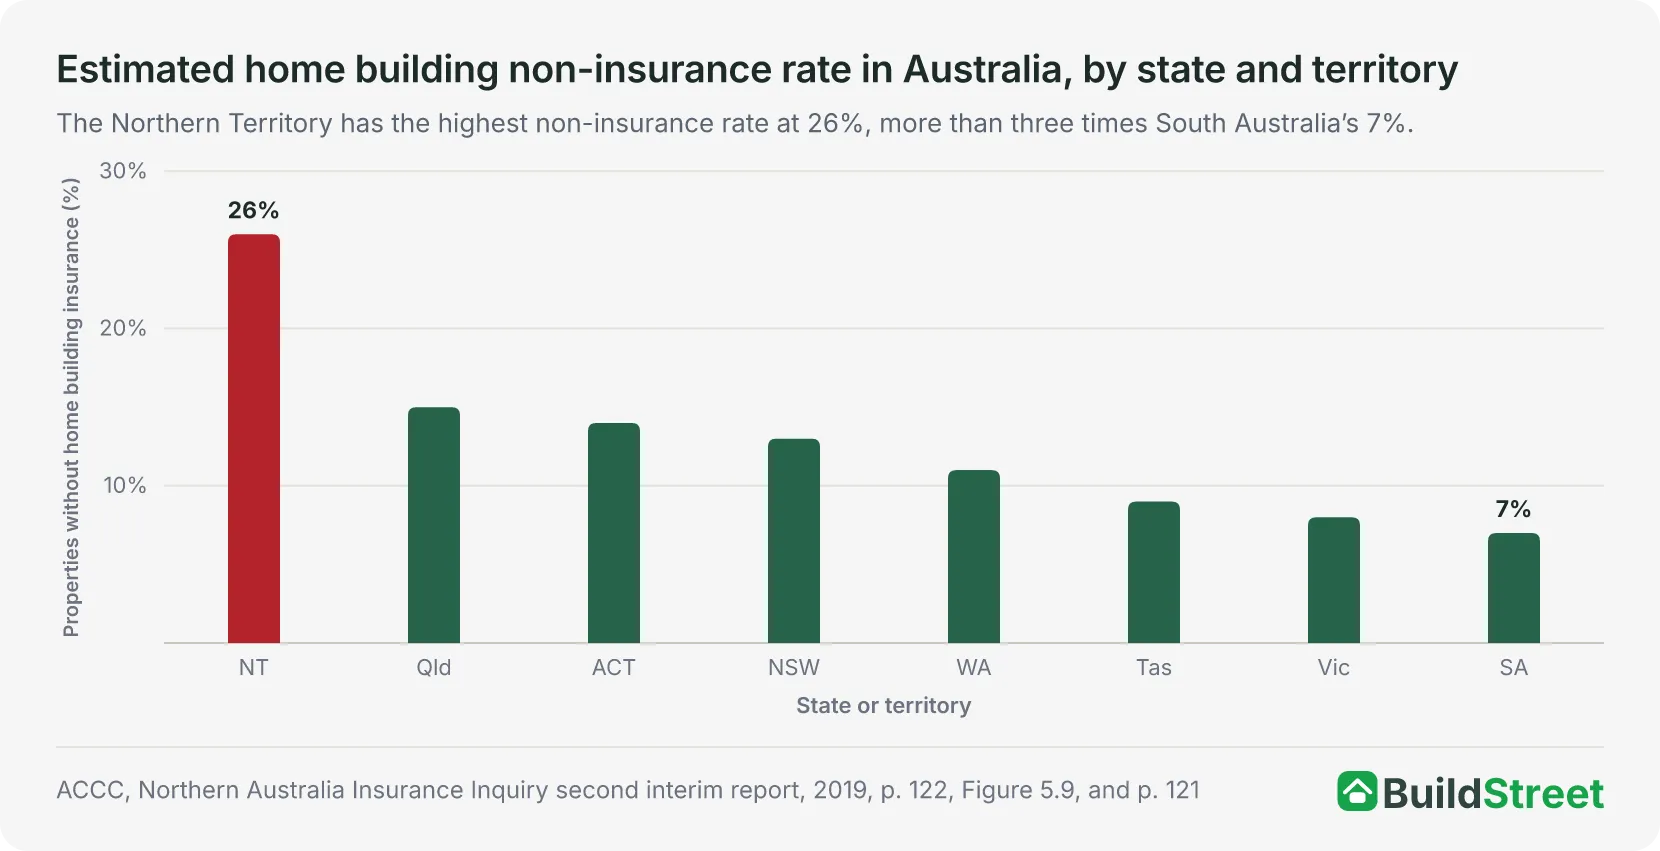
Home building insurance gaps across Australia's states and territories
The ACCC estimated that about 20% of potentially insurable properties in Northern Australia and about 11% in the rest of Australia had no home building insurance. This estimate is based on insurer policy data compared with census-derived counts of potentially insurable properties. The state pattern varied widely, with an even larger gap between capital cities and regional areas in some northern jurisdictions.
Section 07 · Cost pressure
How insurance costs can contribute to underinsurance
Higher insurance costs can increase affordability pressure and may contribute to underinsurance or non-insurance. In New South Wales, Treasury estimates that the Emergency Services Levy has added an average of 18% to residential base insurance premiums since 2017–18, including the flow-on effects of GST and stamp duty.
Treasury states that the levy contributes to underinsurance and non-insurance. It is one factor affecting premium costs alongside property risk, rebuilding costs and insurers' pricing.
The levy provides 73.7% of funding for NSW emergency services agencies, and the Treasurer said its cost to residential insurance policyholders increased by 48% between 2017–18 and 2024–25. Treasury modelled five land-value-based alternatives using a matched dataset of around 2.1 million insured properties. Across all five options, an estimated 54% to 56% of insured properties would pay less than under the current levy. Among insured residential properties, the proportion was slightly higher, at 56% to 58%.
Treasury stated it could not estimate how many currently uninsured or self-insured property owners would begin contributing under a new model because those properties could not be identified in the matched dataset. The paper was subsequently referred to a Legislative Assembly select committee, which is due to report by 18 November 2026.
Victoria introduced a similar reform in July 2013, replacing its insurance-based fire services levy with a property-based charge. Reducing underinsurance was one of the stated reasons for the change.
The Insurance Council of Australia estimated in its submission to the 2024 parliamentary inquiry that states and territories collect around $6 billion each year through stamp duties and levies on insurance.
How Northern Australians calculate their building insurance cover
Many Northern Australian homeowners with building insurance said they used an estimate of rebuilding costs to set their sum insured, with 64% reporting this approach. A minority relied on methods unrelated to rebuilding costs: 25% based their sum insured on what they paid for the house, while 17% based it on what they believed they could sell it for.
| Method used to set the sum insured | Share of respondents |
|---|---|
| An estimate of rebuilding cost | 64% |
| What they paid for the house | 25% |
| What they could sell it for | 17% |
| What they could afford | 14% |
| An online calculator | 12% |
| Advice from a broker | 12% |
| Advice from a call centre | 10% |
Source · ACCC, Northern Australia Insurance Inquiry second interim report, 2019, pp. 128 and 129.
The 2024 parliamentary inquiry heard a similar account. Consumers were sometimes unaware that the sum insured represents the cost to rebuild rather than the purchase price of the property. The Financial Rights Legal Centre argued that too much of the responsibility for estimating rebuild costs sits with households rather than with insurers, which hold detailed cost data.
The Actuaries Institute estimated that 1.61 million Australian households, or 15%, were home insurance affordability-stressed in the year to March 2024. Households in this group spent an average of 9.6 weeks of gross income on home insurance. The measure captures affordability pressure rather than whether the insurance cover held was adequate.
Section 08 · Measurement and policy
Why home insurance rebuild estimates can vary
Estimates for rebuilding the same house have varied by as much as 169% between insurers' sum insured calculators. In 2005, ASIC road-tested calculators from nine insurers across five properties and found that the highest estimate was more than two and a half times the lowest.
Consumer group CHOICE has since identified similarly wide variations. One homeowner obtained estimates for the same property from 10 insurer brands, ranging from $601,000 to $753,000.
Sum insured calculators provide estimates of rebuilding costs. Under the General Insurance Code of Practice, insurers must provide access to a calculator when a customer applies for or renews a home building policy. However, consumer advocacy evidence presented to the 2024 parliamentary inquiry suggested these calculators may not always reflect current inflation, updated building code requirements, or rising labour and material costs. The ACCC has also found that rebuild estimates vary between insurers.
Building code changes are another factor because they can increase the standard required for new construction. Although all jurisdictions adopted the National Construction Code 2022 from 1 May 2023, the housing energy efficiency and livable housing provisions were implemented on different dates, and two jurisdictions had not adopted parts of those provisions when the national comparison was published.
| State or territory | General NCC 2022 adoption | Housing energy efficiency | Livable housing design |
|---|---|---|---|
| New South Wales | 1 May 2023 | 1 October 2023, Enhanced BASIX | Not adopted |
| Victoria | 1 May 2023 | 1 May 2024 | 1 May 2024 |
| Queensland | 1 May 2023 | 1 May 2024 | 1 October 2023 |
| South Australia | 1 May 2023 | 1 October 2024 | 1 October 2024 |
| Western Australia | 1 May 2023 | 1 May 2025 | Not adopted |
| Tasmania | 1 May 2023 | Not adopted | Staged from 1 October 2024 |
| Northern Territory | 1 May 2023 | 1 October 2023, 5-star housing only | 1 October 2023 |
| Australian Capital Territory | 1 May 2023 | 15 January 2024 | 15 January 2024 |
Source · Australian Building Codes Board, NCC 2022 state and territory adoption dates; Tasmanian Director's Determination on the application of Part H8 Livable Housing provisions of the NCC; Queensland Government, Modern Homes Standards.
These staggered adoption dates add a separate layer to the underinsurance question. A rebuild that must now meet updated energy-efficiency or livable-housing standards can cost more than the original building. This means a sum insured set before a jurisdiction adopted these provisions may not account for the additional cost of meeting newer standards.
Key insurance recommendations from the 2024 flood inquiry
The House Standing Committee on Economics made 86 recommendations. Three deal directly with sums insured, and all three propose changes to the General Insurance Code of Practice rather than to legislation.
Recommendation 24
Insurers to amend the General Insurance Code of Practice to provide clearer information at application and renewal about how sums insured are determined and the factors consumers should consider to ensure adequate cover, particularly for a total loss
Recommendation 25
Insurers to tell policyholders when they suspect the sum insured will not cover full rebuild costs. Also to keep calculators accurate and current, including current building standards and labour and material costs
Recommendation 26
A more flexible approach to rebuilds, with like-for-like replacement not required, so size or scope can be traded for resilience and efficiency
References
- ABS, Producer Price Indexes, Australia, March 2026 · Australian Bureau of Statistics
- ABS Consumer Price Index, Australia (latest release, Cat. 6401.0) · Australian Bureau of Statistics
- ABS Building Approvals, Australia (latest release, Cat. 8731.0) · Australian Bureau of Statistics
- ABS, Data integration project register · Australian Bureau of Statistics
- APRA, Mind the Gap: An Insurance Climate Vulnerability Assessment, March 2026 · apra.gov.au
- ASIC, Getting home insurance right (Report 54), September 2005 · asic.gov.au
- ACCC, Insurance Monitoring Report, June 2026 · accc.gov.au
- ACCC, Insurance monitoring report, July 2025 · accc.gov.au
- ACCC, Northern Australia Insurance Inquiry second interim report, December 2019 · accc.gov.au
- Productivity Commission, Natural Disaster Funding Arrangements, Volume 2, December 2014 · pc.gov.au
- Parliament of Australia, House Standing Committee on Economics, Flood failure to future fairness, October 2024 · aph.gov.au
- NSW Treasury, Emergency services funding reform options paper, May 2026 · nsw.gov.au
- Australian Building Codes Board, NCC 2022 state and territory adoption dates · abcb.gov.au
- Tasmanian Director's Determination on Part H8 Livable Housing provisions of the NCC · cbos.tas.gov.au
- Insurance Council of Australia, General Insurance Code of Practice draft public consultation paper, June 2026 · insurancecouncil.com.au
- Actuaries Institute, Home Insurance Affordability and Home Loans at Risk, August 2024 · actuaries.asn.au
- Melbourne Institute, HILDA Statistical Report 2025, September 2025 · melbourneinstitute.unimelb.edu.au
- CHOICE, testing of insurer sum insured calculators · choice.com.au
- Queensland Government, Modern Homes Standards · housing.qld.gov.au
