

Published 25 Aug 2026
 What is driving housing demand?The housing demand article covers population growth, household formation and dwelling supply, the three inputs to estimates of how many homes Australia needs each year.
 Migration and each capital cityThis companion article maps net overseas migration against housing supply in each Australian capital city, using the same ABS releases as this page.
Section 01 · The headline numbers
How many people does Australia gain from overseas migration each year?
Australia gained 305,570 people from overseas migration in 2024-25, the second consecutive annual fall from the 2022-23 record. The ABS recorded 568,370 migrant arrivals and 262,800 migrant departures in the year ending 30 June 20251.
Net overseas migration fell from 538,340 in 2022-23 to 429,160 in 2023-24 and then to 305,570 in 2024-25. This was a fall of 43 per cent over two years, derived from the 2022-23 and 2024-25 figures1. On the quarterly measure, the decline began earlier. Annual net overseas migration peaked at 556,000 in the year ending September 2023, and the ABS reports seven consecutive quarters of decline in the annual figure since that peak.
Migration accounted for most of Australia's population growth in the 2025 calendar year. In the year ending 31 December 2025, the population grew by 412,500 people to 27,801,023. Net overseas migration contributed 301,000, or 73 per cent, of that growth, derived by dividing the migration gain by the total population increase. Natural increase, which is births minus deaths, contributed the remaining 111,5002.
The broader growth picture, including births, deaths and state populations, is covered in the Australian population statistics article.
Section 02 · Arrivals and visas
Who is arriving in Australia, and on what visas?
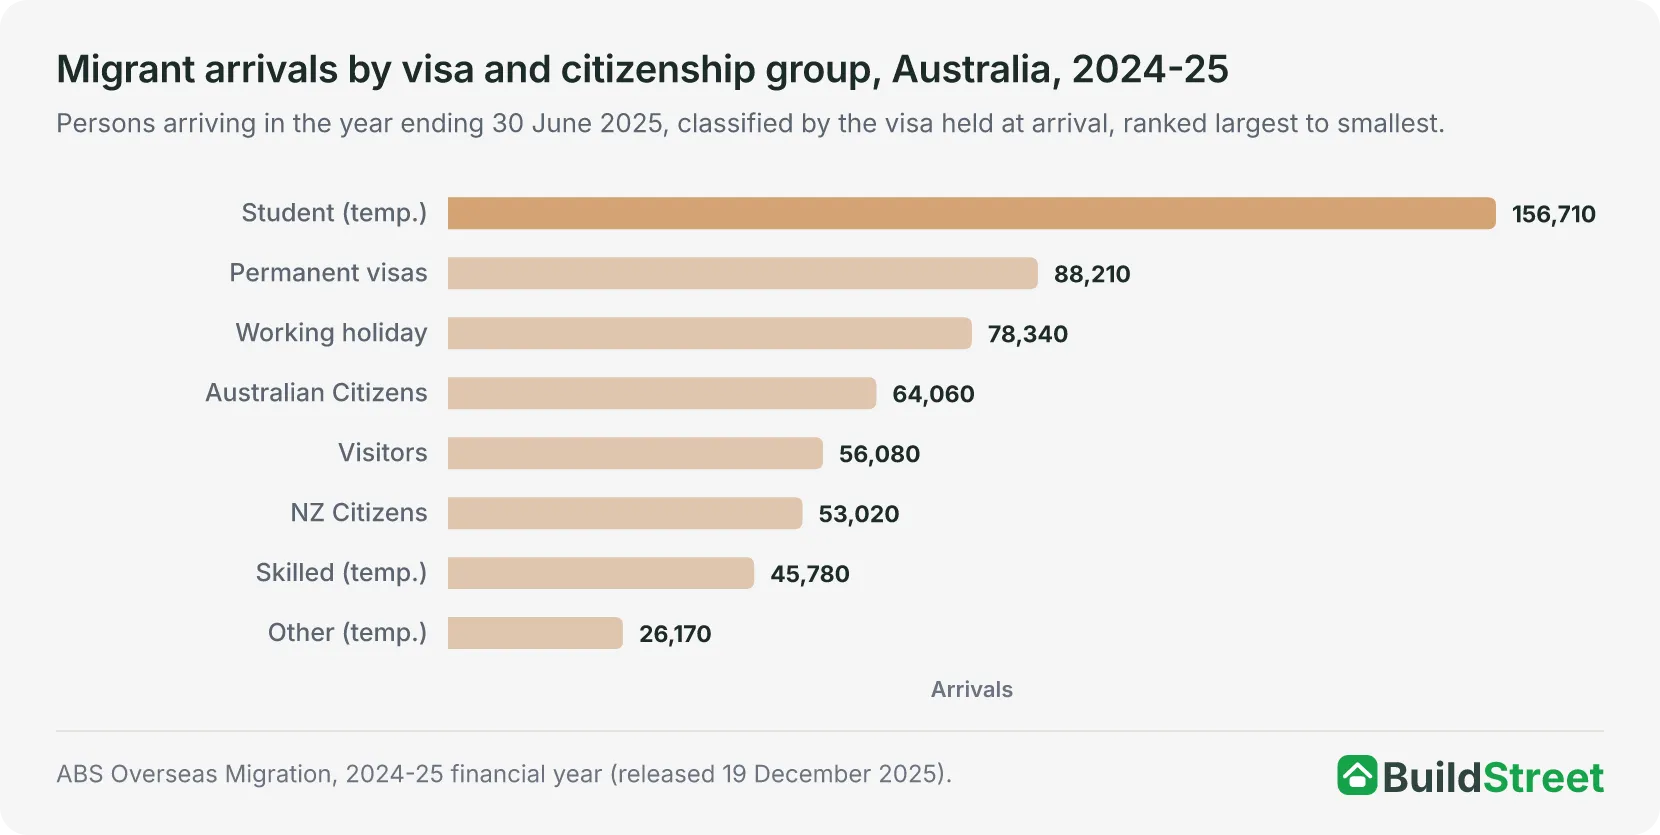
Most migrant arrivals held temporary visas. Temporary visa holders accounted for 363,090 of the 568,370 arrivals in 2024-25, and people on student visas were the single largest group at 156,7101. Permanent visa holders accounted for 88,210 arrivals and working holiday makers for 78,340.
Migrant arrivals include more than people entering through visa programmes. Arrivals are classified by the visa held at arrival, so the count includes 56,080 people who arrived on visitor visas and then stayed long enough to be counted as migrants1. Australian citizens returning to live in Australia after 12 months or more overseas also count, with 64,060 arrivals in 2024-25. New Zealand citizens accounted for another 53,020. Under the ABS 12/16-month rule, a traveller is counted as a migrant if they spend 12 months or more in Australia within a 16-month period, whether or not the stay is continuous3.
Every temporary category recorded fewer arrivals than in 2023-24. Student arrivals fell from 204,130 in 2023-24 to 156,710 in 2024-25, a 23 per cent decrease, while arrivals on visitor visas fell from 85,330 to 56,080. Permanent visa arrivals fell from 90,930 in 2023-24 to 88,210 in 2024-25, a decrease of 3 per cent1.
| Migrant arrivals by visa and citizenship group, Australia, 2023-24 to 2024-25 | |||
|---|---|---|---|
| Group | 2023-24 | 2024-25 | Change |
| Student | 204,130 | 156,710 | -23% |
| Permanent visas | 90,930 | 88,210 | -3% |
| Working holiday | 80,070 | 78,340 | -2% |
| Australian citizens | 60,840 | 64,060 | +5% |
| Visitors | 85,330 | 56,080 | -34% |
| New Zealand citizens | 51,680 | 53,020 | +3% |
| Skilled (temporary) | 48,870 | 45,780 | -6% |
| Other temporary | 39,510 | 26,170 | -34% |
| Total | 661,360 | 568,370 | -14% |
Source · ABS Overseas Migration, 2024-25 financial year, Table 4.1.
Section 03 · Departures
Who is leaving Australia?
Migrant departures rose from 232,200 in 2023-24 to 262,800 in 2024-25, an increase of 13 per cent1.
Australian citizens leaving to live overseas were the largest individual group of departures at 81,510. Temporary visa holders accounted for 147,930 departures, including 48,640 people on student visas and 45,920 in the ABS "other temporary" category. Student-visa departures rose from 32,820 in 2023-24 to 48,640 in 2024-25, a 48 per cent increase1.
According to the Centre for Population's 2025 Population Statement, migrants on temporary visas are departing at lower rates than before the COVID-19 pandemic. The lower departure rate is attributed partly to Australia's relatively favourable economic conditions, including the low unemployment rate4.
Section 04 · Source countries
Which countries do Australia's migrants come from?
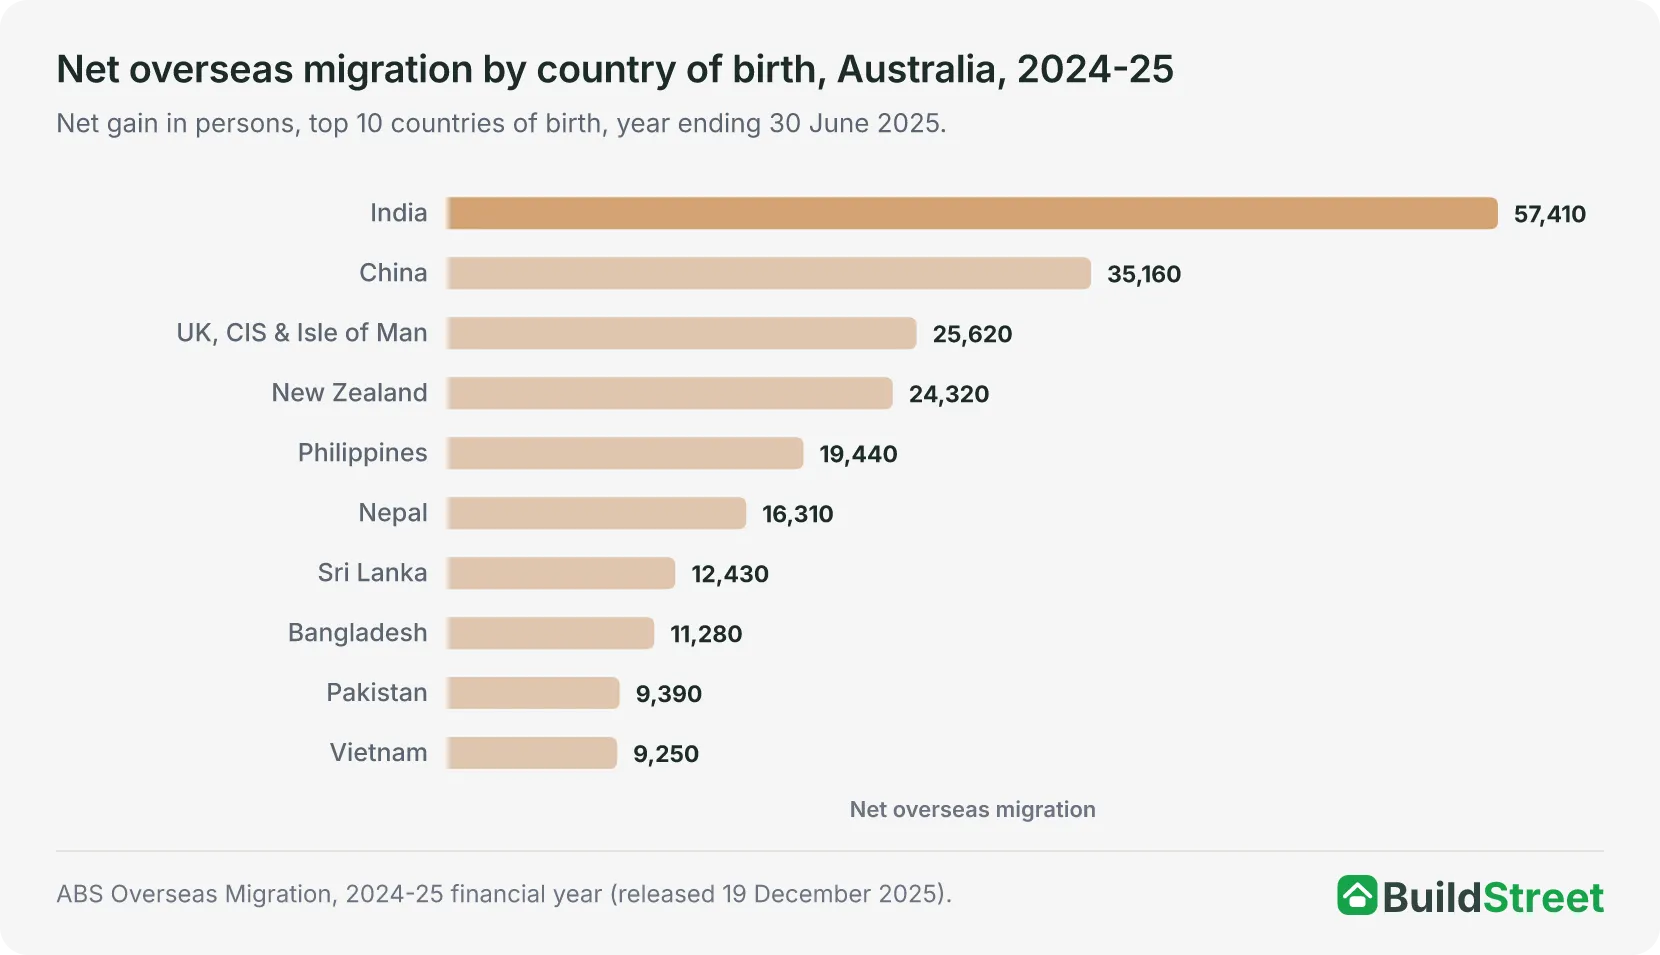
India was the largest source country in 2024-25. Migrants born in India added a net 57,410 people, ahead of China-born migrants at 35,160 and United Kingdom-born migrants at 25,6201. These figures classify migrants by country of birth, not by citizenship or visa type.
Seven of the top 10 countries of birth recorded smaller net gains in 2024-25 than in 2023-24. The net gain for India-born migrants fell from 70,130 in 2023-24 to 57,410 in 2024-25, and the net gain for China-born migrants fell from 46,580 to 35,160. The net gain for Vietnam-born migrants more than halved, from 20,350 to 9,250. Three of the top 10 countries recorded increases: the United Kingdom-born net gain increased from 23,550 to 25,620, the New Zealand-born gain from 22,910 to 24,320, and the Bangladesh-born gain from 9,750 to 11,2801.
More Australian-born residents left the country than returned in 2024-25, resulting in a net loss of 17,060 people, and the Australian-born net figure has been negative in every year of the ABS series except 2019-20 and 2020-211.
| Top 10 countries of birth ranked by 2024-25 net gain. | |||
|---|---|---|---|
| Country of birth | 2023-24 | 2024-25 | Change |
| India | 70,130 | 57,410 | -18% |
| China | 46,580 | 35,160 | -25% |
| United Kingdom | 23,550 | 25,620 | +9% |
| New Zealand | 22,910 | 24,320 | +6% |
| Philippines | 31,670 | 19,440 | -39% |
| Nepal | 18,160 | 16,310 | -10% |
| Sri Lanka | 14,760 | 12,430 | -16% |
| Bangladesh | 9,750 | 11,280 | +16% |
| Pakistan | 14,250 | 9,390 | -34% |
| Vietnam | 20,350 | 9,250 | -55% |
Source · ABS Overseas Migration, 2024-25 financial year, Table 1.1.
Section 05 · States and territories
Which states and territories gain the most overseas migrants?
New South Wales received the largest net overseas migration gain of any state or territory. The state gained a net 91,570 people in 2024-25, equal to 30 per cent of the national 305,570. Victoria followed at 87,770 and Queensland at 55,7401.
Every state and territory recorded a smaller net gain than in 2023-24. The largest percentage falls were in Tasmania, where the net gain fell from 4,140 in 2023-24 to 2,720 in 2024-25, and Western Australia, where it fell from 59,270 to 40,4101.
Net overseas migration is only one source of state population growth. On the broader population measure, which also includes natural increase and interstate migration, Western Australia was the fastest-growing state or territory over the 2025 calendar year at 2.2 per cent, ahead of Victoria at 1.7 per cent2.
How these gains translate into demand for homes is covered in the population growth versus housing supply article.
| Net overseas migration by state and territory, Australia, 2023-24 to 2024-25 | |||
|---|---|---|---|
| State or territory | 2023-24 | 2024-25 | Change |
| New South Wales | 133,120 | 91,570 | -31% |
| Victoria | 127,880 | 87,770 | -31% |
| Queensland | 71,730 | 55,740 | -22% |
| Western Australia | 59,270 | 40,410 | -32% |
| South Australia | 23,350 | 18,730 | -20% |
| Australian Capital Territory | 5,860 | 4,980 | -15% |
| Northern Territory | 3,770 | 3,610 | -4% |
| Tasmania | 4,140 | 2,720 | -34% |
Source · ABS Overseas Migration, 2024-25 financial year, Tables 1.2 to 1.9.
Section 06 · The outlook
How far is net overseas migration expected to fall?
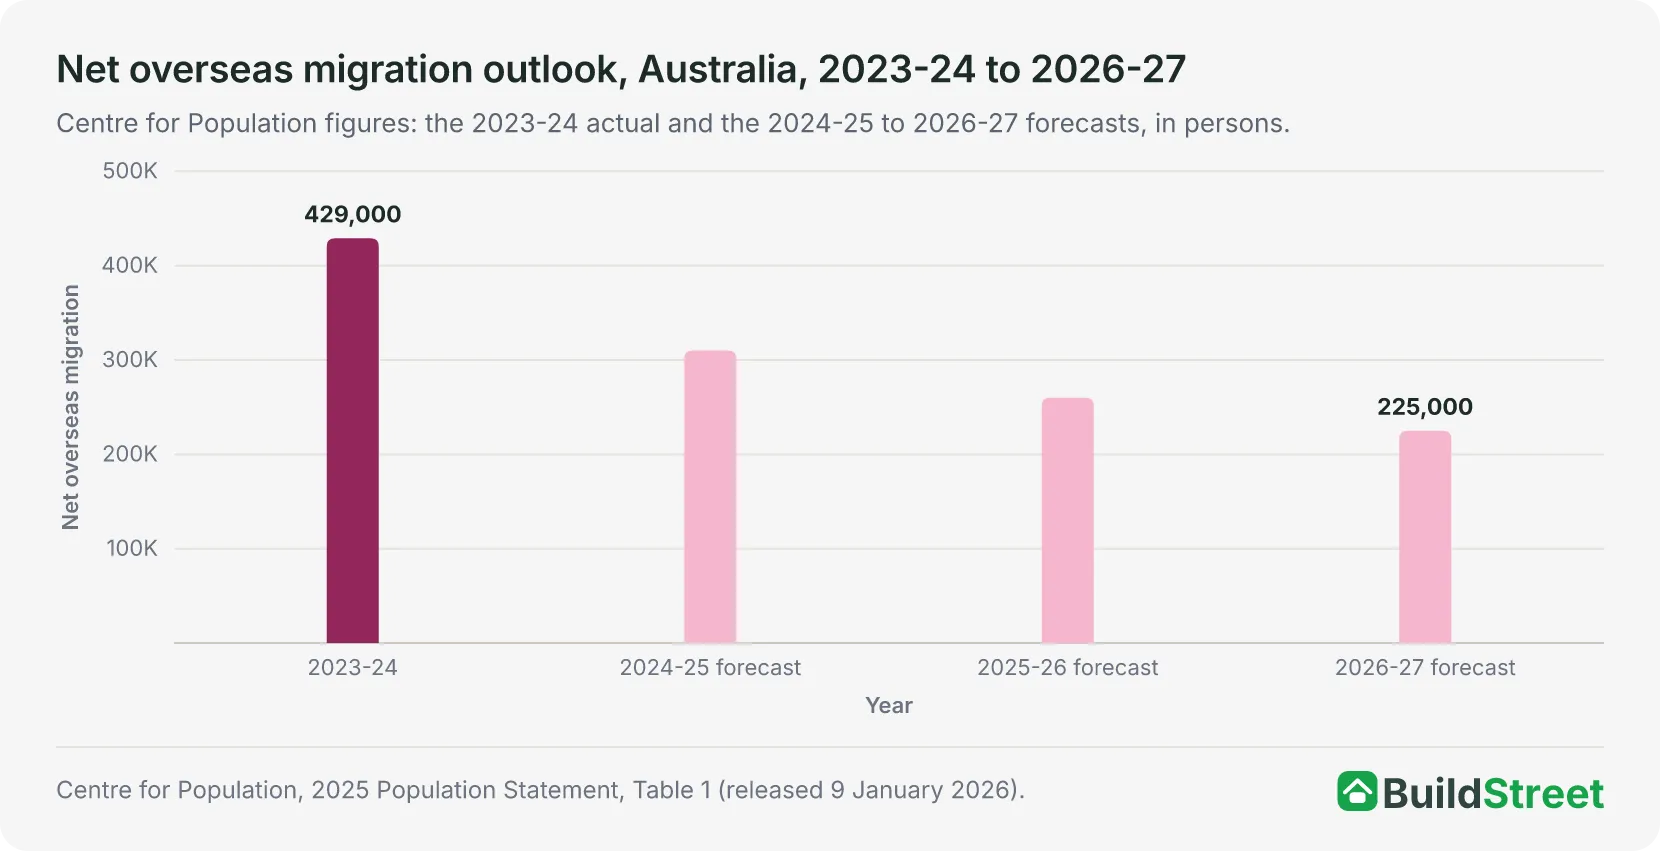
The official outlook is for further falls. The Centre for Population's 2025 Population Statement forecasts net overseas migration of 260,000 in 2025-26 and 225,000 in 2026-27. It uses 235,000 a year as a long-run modelling assumption rather than a forecast4.
Rising departures, rather than falling arrivals, are expected to account for the decline in 2025-26. Migrant departures are forecast to reach 305,000 as many people who arrived on temporary visas after the border reopened reach the end of their visas4.
The projections were prepared before the ABS published its 2024-25 estimate. The Centre forecast a net gain of 310,000 for 2024-25, and the ABS subsequently estimated about 306,0004.
Lower net overseas migration is also expected to reduce population growth. Population growth is forecast at 1.3 per cent in 2025-26 and an average of 1.2 per cent from 2026-27, below the average of 1.6 per cent recorded during the 2010s. It forecasts the population to reach 28 million by the end of 2025-26 and projects 31.5 million by 2035-364.
| Net overseas migration and population outlook, Australia | |||
|---|---|---|---|
| Year | Net overseas migration '000 | Population at 30 June millions | Growth % |
| 2023-24 actual | 429 | 27.2 | 2.0 |
| 2024-25 forecast | 310 | 27.6 | 1.5 |
| 2025-26 forecast | 260 | 28.0 | 1.3 |
| 2026-27 forecast | 225 | 28.3 | 1.2 |
| 2035-36 projection | 235 | 31.5 | 1.1 |
| 2065-66 projection | 235 | 41.0 | 0.7 |
Source · Centre for Population, 2025 Population Statement, Table 1.
Section 07 · The long run
How has net overseas migration changed over 21 years?
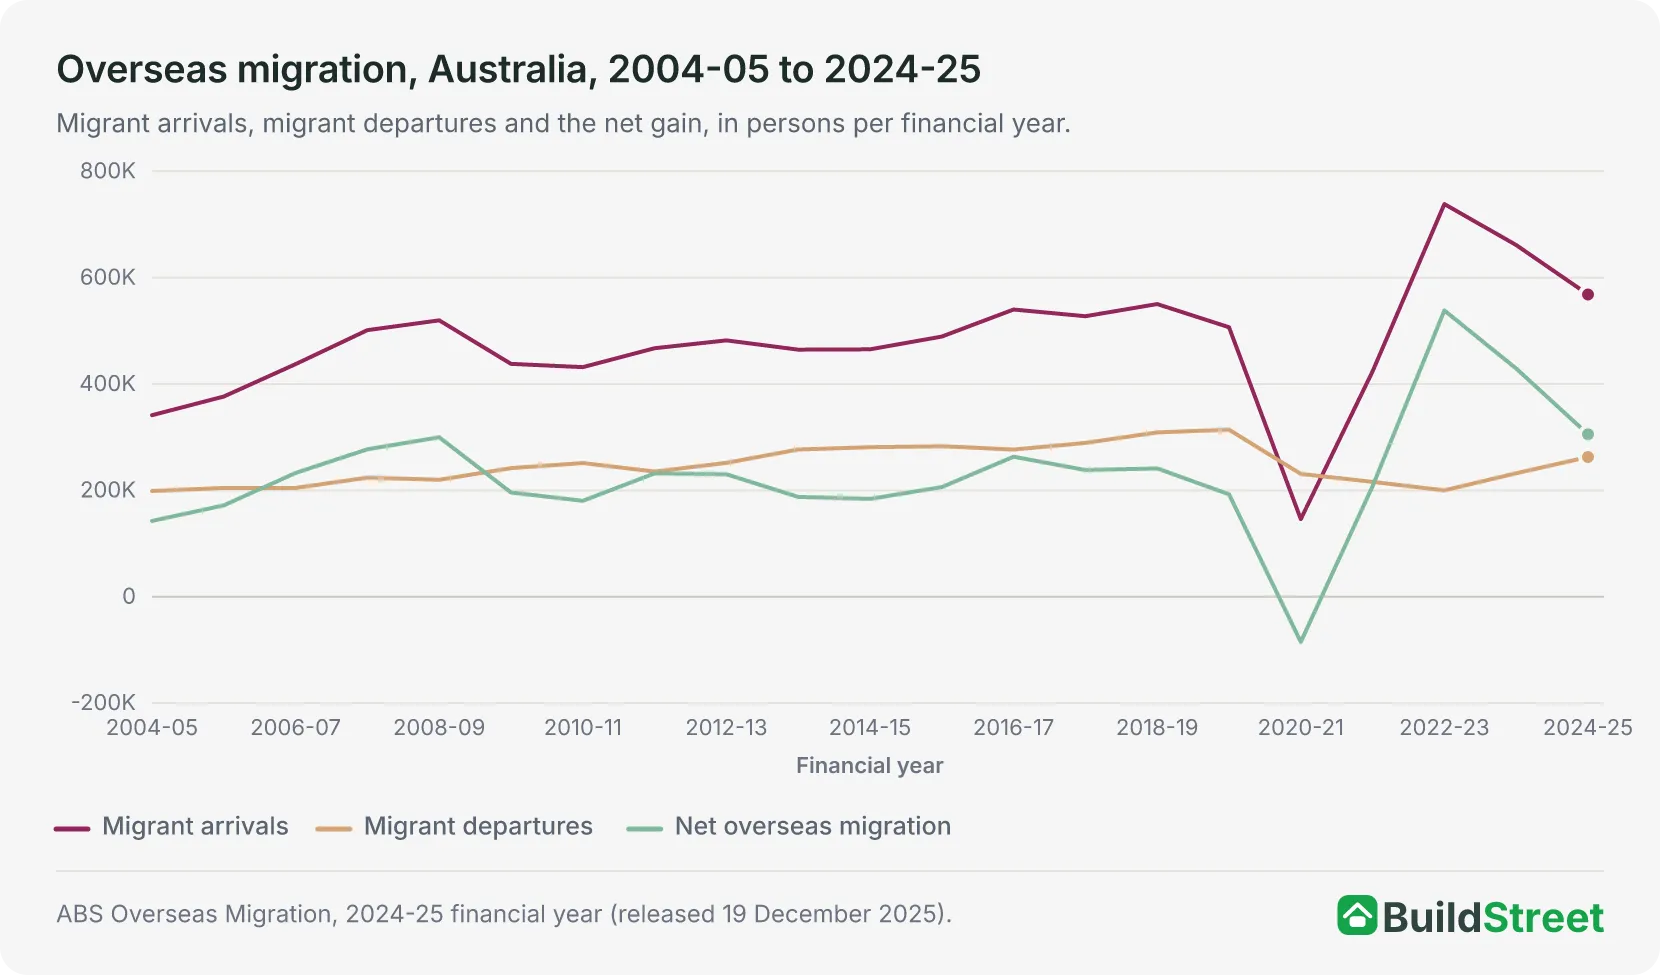
Across the 21 years of the ABS series, net overseas migration averaged about 232,000 people a year, derived by dividing the series total of 4,872,830 by 211. From 2004-05 to 2019-20, annual net overseas migration ranged from 142,580 to 299,870.
In 2020-21, with international borders closed, Australia recorded a net migration loss of 84,940 people, the only negative year in the series1. Borders reopened to most travellers from 21 February 2022, and the ABS describes the subsequent record levels of net overseas migration as consistent with a catch-up in arrivals after almost two years of border restrictions. Net migration reached 538,340 in 2022-23, the highest financial-year figure in the series.
At 305,570, the 2024-25 net gain was higher than any recorded before the COVID-19 pandemic, but 43 per cent below the 2022-23 record. The Centre for Population forecasts of 260,000 in 2025-26 and 225,000 in 2026-27 would place net overseas migration back within the range recorded from 2004-05 to 2019-201.
| Migrant arrivals, departures and net overseas migration, Australia, 2004-05 to 2024-25 | |||
|---|---|---|---|
| Financial year | Arrivals | Departures | Net overseas migration |
| 2004-05 | 341,400 | 198,820 | 142,580 |
| 2005-06 | 376,530 | 204,690 | 171,840 |
| 2006-07 | 437,440 | 204,640 | 232,800 |
| 2007-08 | 501,340 | 224,000 | 277,340 |
| 2008-09 | 519,790 | 219,920 | 299,870 |
| 2009-10 | 437,930 | 241,870 | 196,060 |
| 2010-11 | 431,780 | 251,410 | 180,370 |
| 2011-12 | 467,330 | 235,380 | 231,950 |
| 2012-13 | 482,090 | 251,760 | 230,330 |
| 2013-14 | 464,680 | 276,900 | 187,780 |
| 2014-15 | 465,250 | 281,220 | 184,030 |
| 2015-16 | 489,280 | 283,040 | 206,230 |
| 2016-17 | 540,150 | 276,800 | 263,350 |
| 2017-18 | 527,520 | 289,300 | 238,220 |
| 2018-19 | 550,400 | 309,060 | 241,340 |
| 2019-20 | 506,850 | 314,160 | 192,700 |
| 2020-21 | 146,000 | 230,930 | -84,940 |
| 2021-22 | 423,910 | 216,000 | 207,910 |
| 2022-23 | 738,410 | 200,070 | 538,340 |
| 2023-24 | 661,360 | 232,200 | 429,160 |
| 2024-25 preliminary | 568,370 | 262,800 | 305,570 |
Source · ABS Overseas Migration, 2024-25 financial year, Tables 1.1, 2.1 and 3.1.
Section 08
Australian immigration statistics: quick answers
How many migrants came to Australia in 2024-25?
Australia recorded 568,370 migrant arrivals and 262,800 migrant departures in 2024-25, a net overseas migration gain of 305,570 people, which the ABS rounds to 306,000 in its headline reporting.1
Is immigration to Australia falling?
Yes. Net overseas migration fell from a record 538,340 in 2022-23 to 429,160 in 2023-24 and 305,570 in 2024-25.1 The Centre for Population forecasts further declines to 260,000 in 2025-26 and 225,000 in 2026-27.
Which country do most of Australia's migrants come from?
India was the largest country of birth for net overseas migration in 2024-25. Migrants born in India added a net 57,410 people, ahead of China-born migrants at 35,160 and United Kingdom-born migrants at 25,620.1
Which state gets the most overseas migrants?
New South Wales received the largest net overseas migration gain in 2024-25, at 91,570 people, ahead of Victoria at 87,770 and Queensland at 55,740.1
What is net overseas migration?
Net overseas migration is the ABS measure of migrant arrivals minus migrant departures. Under the 12/16-month rule, a traveller is added to the population if they spend 12 months or more in Australia within a 16-month period, whether or not the stay is continuous, and removed on the same basis when they leave.3 The measure includes people on temporary visas as well as permanent migrants, Australian citizens and New Zealand citizens.
References
- ABS: Overseas Migration, 2024–25 · Australian Bureau of Statistics ↑ b c d e f g h i j k l m n o p q r s
- ABS, National, state and territory population, December 2025 · Australian Bureau of Statistics ↑ b c
- ABS Overseas Migration methodology, 2024-25 · Australian Bureau of Statistics ↑ b
- 2025 Population Statement · population.gov.au ↑ b c d e
