

Published 26 Aug 2026 · Updated 18 Sept 2026
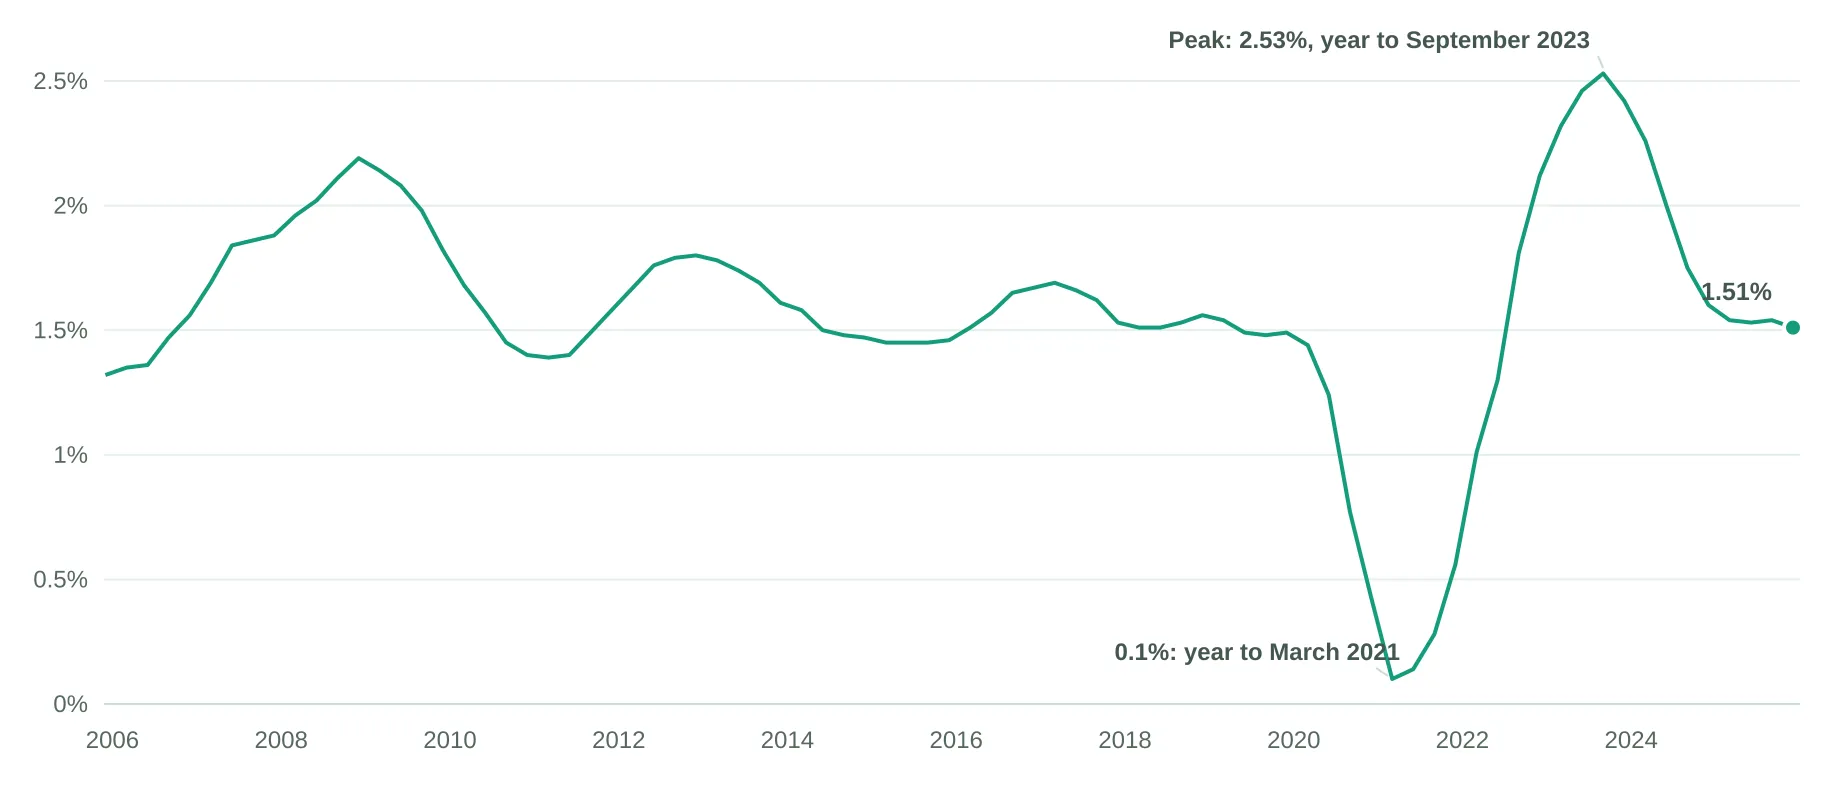 The population side in fullThis page compares growth with building. The main population article covers the growth itself: how many people live in Australia, how fast the total is changing, and the births, deaths and migration behind it.
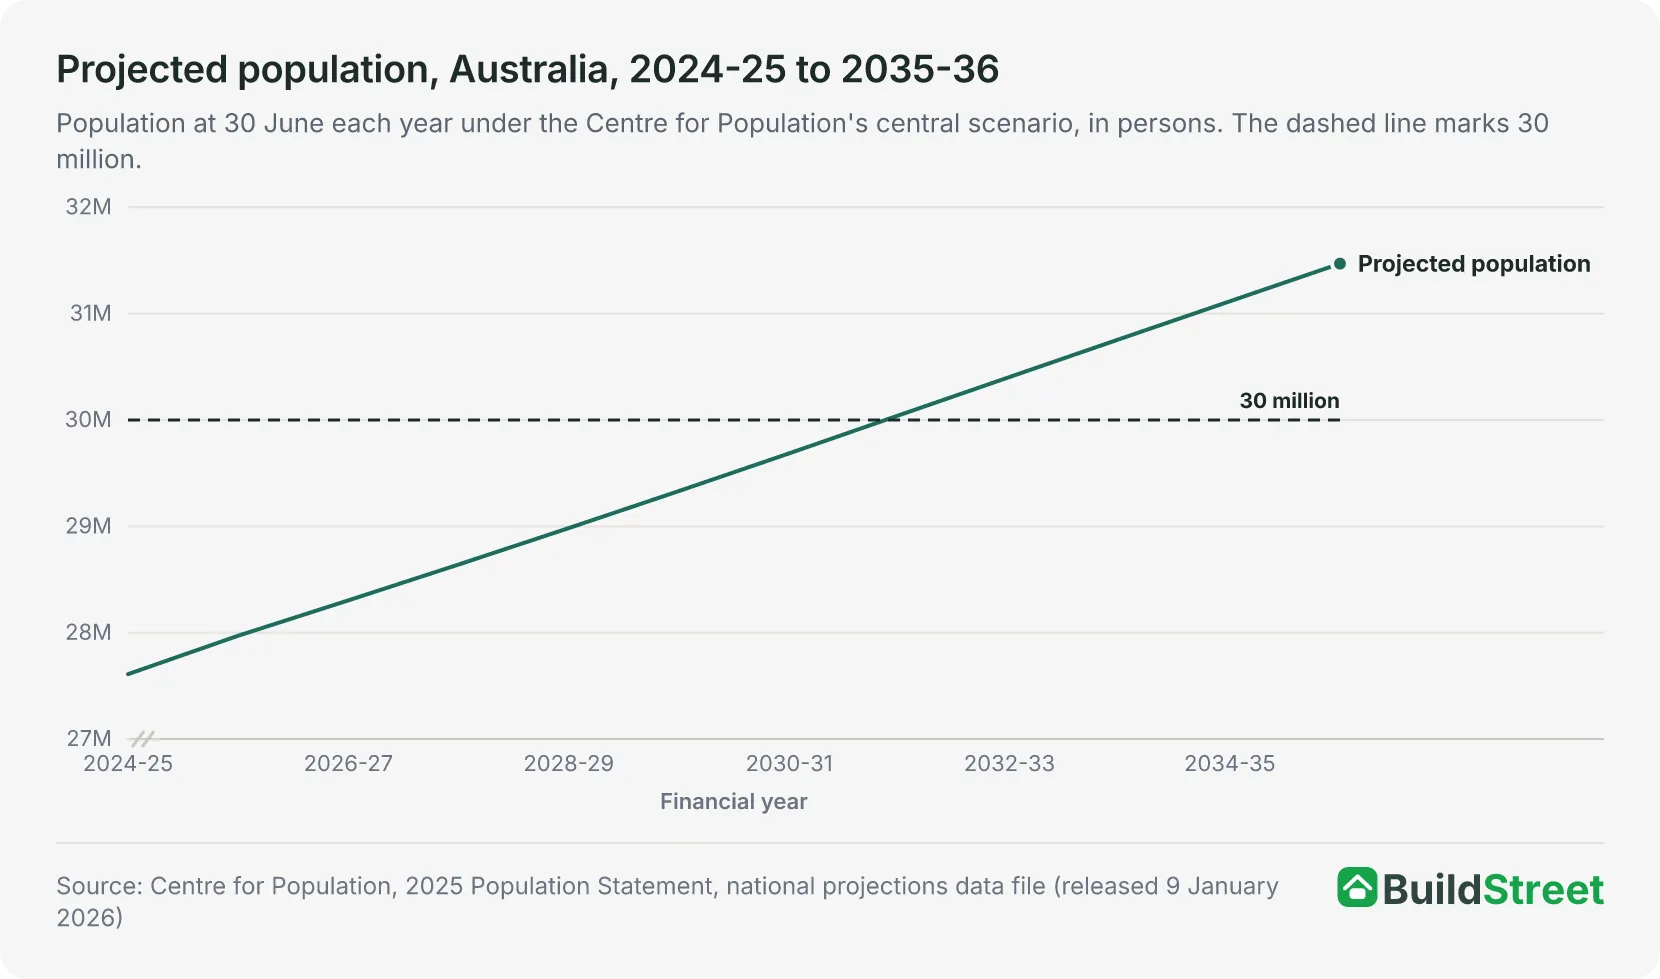 Where growth goes nextHousing demand over the next decade depends on population projections. The projections article covers when Australia is expected to pass 30 million people and how fast each state and territory is projected to grow.
Section 01 · The headline gap
Is Australia building enough homes for its population growth?
In 2025 Australia added 412,500 people and completed 173,228 dwellings, equal to 2.38 people for each dwelling completed. Across the four years from 2022 to 2025 the ratio was 2.88, against 1.85 across the four decades since 1985.
Australia's population grew by 412,500 people, or 1.5 per cent, in the year to 31 December 20251, while 173,228 dwellings were completed across the 2025 calendar year. That works out at 2.38 people added for each dwelling completed. The ratio is derived by dividing the exact increase in the ABS quarterly population series, 412,494, by the 173,228 completions. The key statistics round the increase to 412,5002.
Across the four years from 2022 to 2025, the ratio was higher. Between the end of 2021 and the end of 2025 the population grew by 2,027,228 people while 702,842 dwellings were completed, equal to 2.88 people per dwelling completed. The ratio is derived by summing the calendar-year figures from the ABS population and dwelling completions data for 2022 to 20252. Average household size fell from 2.6 people at the 2016 Census to 2.5 at the 2021 Census3.
How the components of that growth have moved, the births, deaths and migration behind the 412,500, is covered in the Australian population statistics article.
People added per dwelling completed, Australia, 2025
2.38
Across 2022 to 2025, the ratio was 2.88; across 1985 to 2025 as a whole it was 1.85.
Section 02 · Completions
How many homes does Australia complete each year?
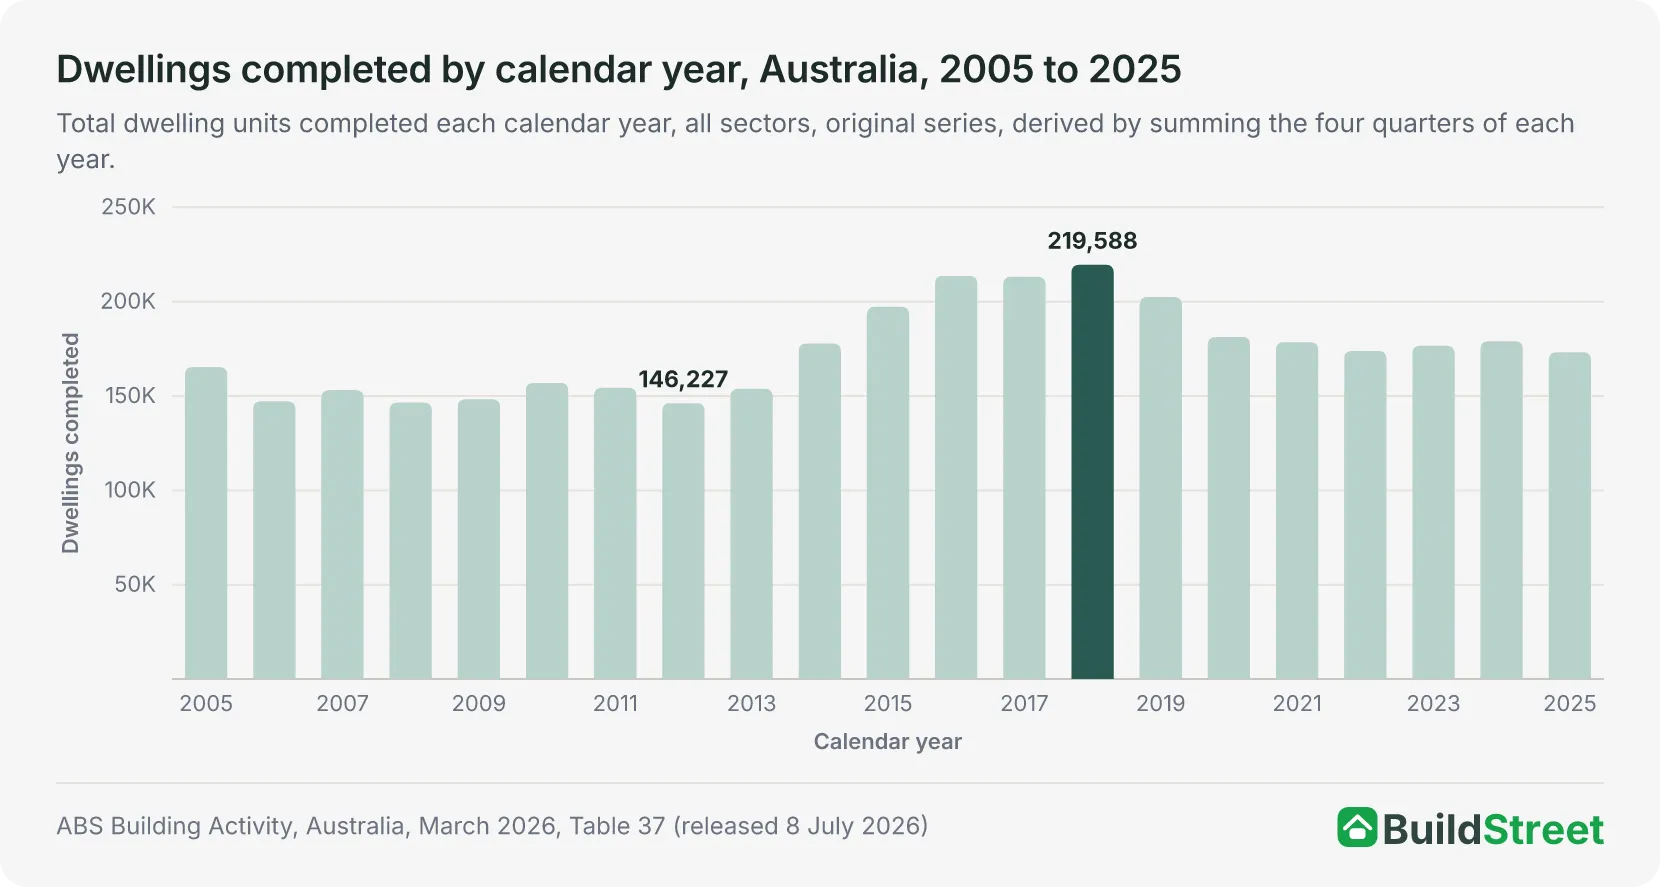
Australia completed 173,228 dwellings in the 2025 calendar year, and every rolling four-quarter period since the December quarter of 2015 has recorded between 172,522 and 223,090 completions2. The most recent four quarters, from the June quarter 2025 to the March quarter 2026, totalled 173,526, with 38,333 dwellings completed in the March quarter itself.
Completions since 2020 have stayed below the late-2010s peak. Calendar-year completions rose to 219,588 in 2018, the highest in the series, and fell to 173,228 by 2025, a decline of 21.1 per cent, derived by comparing the two calendar-year totals2.
Detached houses made up the largest share of the 2025 total. Of the 173,228 dwellings completed, 110,579 were new houses and 62,063 were new dwellings in other residential buildings, such as townhouses and apartment blocks. The remaining 586, derived by subtracting those two categories from the total, came from conversions and alterations to existing buildings2.
Section 03 · People per home
How many people does Australia add for each new home built?
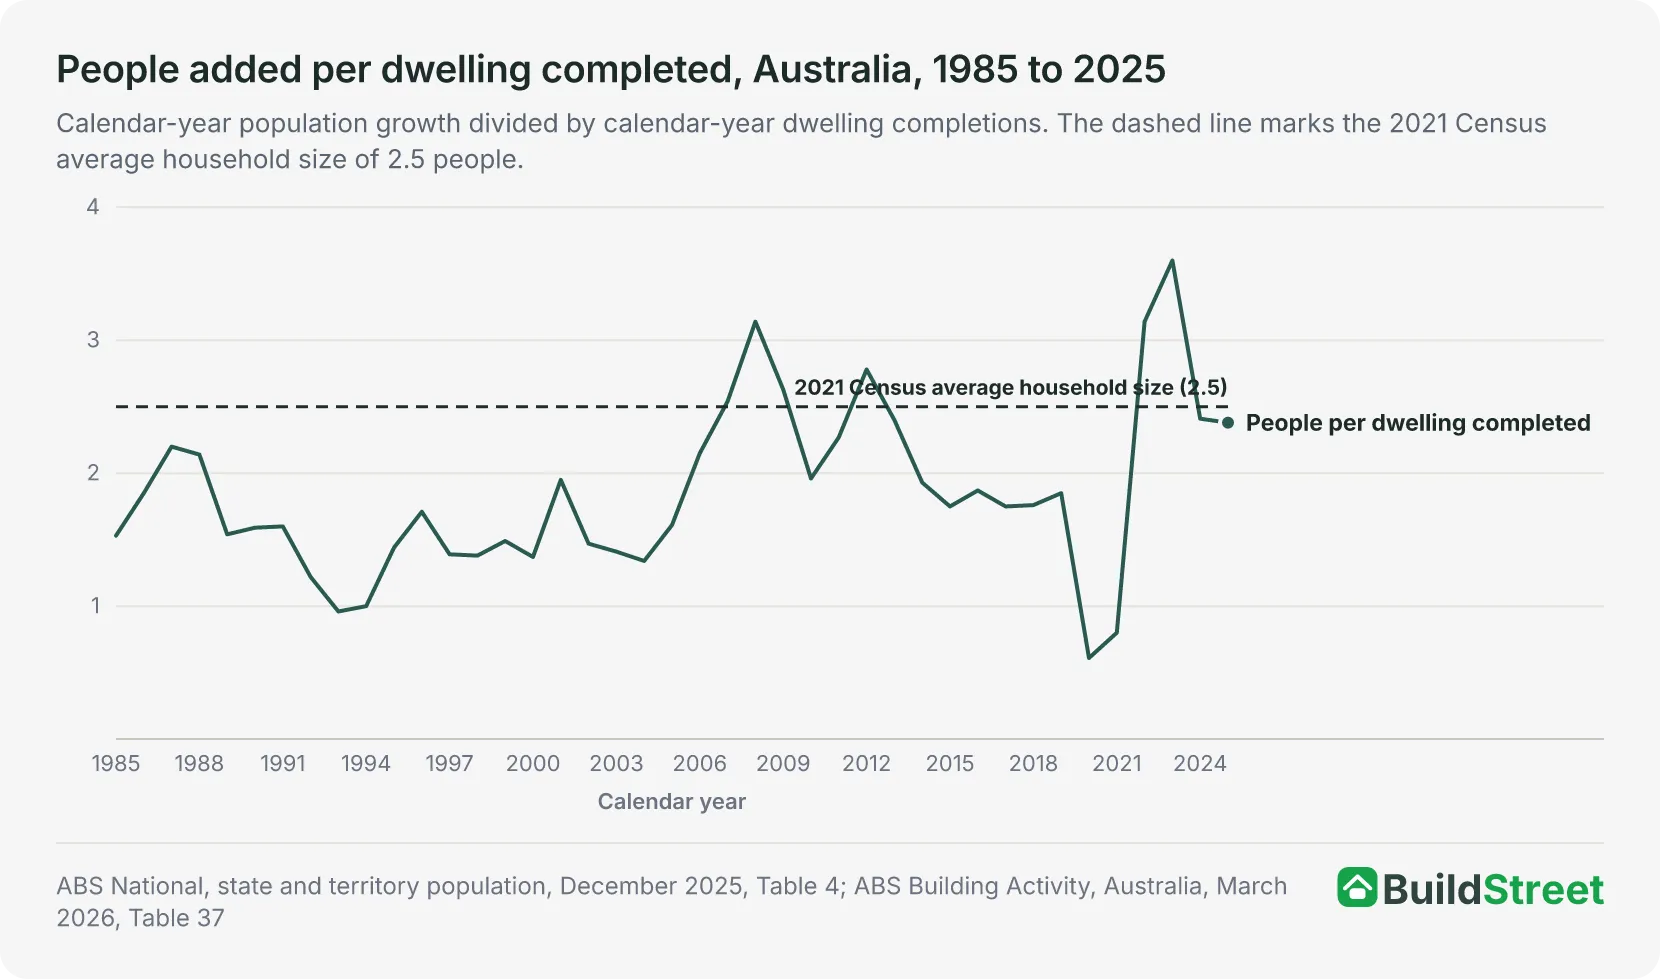
Over the long run, Australia has added fewer than two people per completed home. Between the end of 1984 and the end of 2025 the population grew by 12,123,741 people while 6,567,662 dwellings were completed, equal to 1.85 people per dwelling. This long-run ratio is derived by dividing total population growth over the 41 years by total dwelling completions over the same period1.
Both extremes of the annual ratio occurred in the 2020s. In 2020, population growth of 110,230 against 181,340 completions produced a ratio of 0.61, the lowest of the 41 years compared here. In 2023, growth of 636,375 against 176,636 completions produced a ratio of 3.6, the highest1. The ratio then eased to 2.41 in 2024 and 2.38 in 2025.
Average household size provides a reference point for this comparison. Using the 2021 Census average of 2.5 people per household, population growth of 412,500 people in 2025 equates to about 165,000 households at that average size, while 173,228 dwellings were completed3. This is an illustrative comparison rather than a measure of housing need. It does not count demolitions, holiday homes or changes in household size, so it indicates scale rather than a precise requirement.
Section 04 · The Accord target
Is Australia on track to meet the National Housing Accord's 1.2 million homes target?
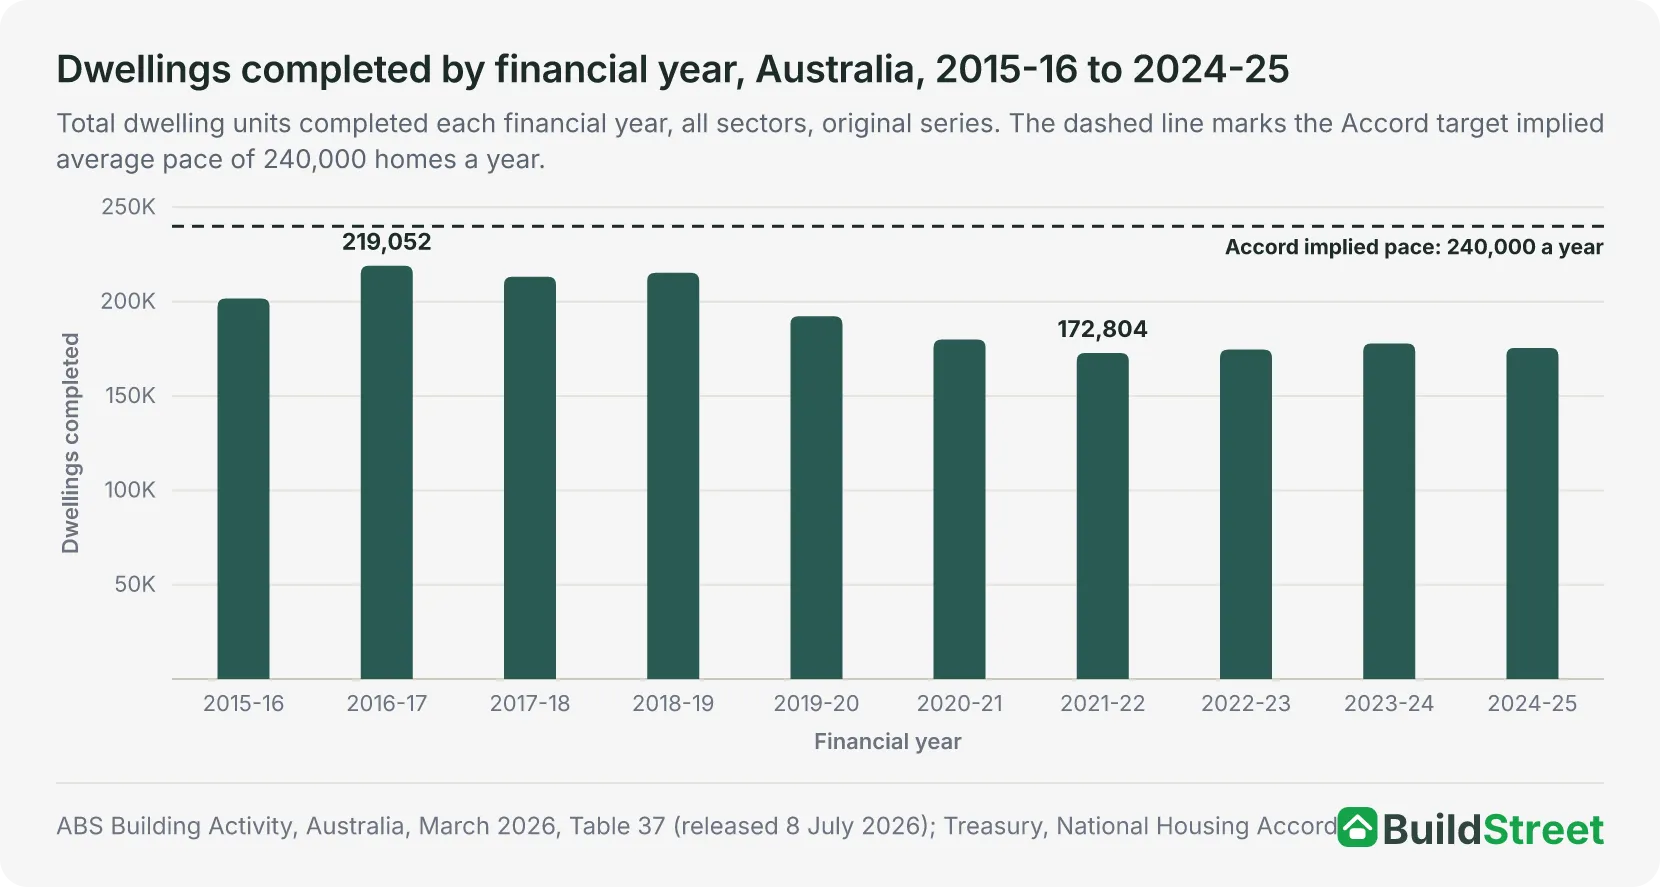
Australia was behind the pace implied by the National Housing Accord target as at March 2026. Completions in the first seven quarters of the National Housing Accord period totalled 307,8822, about 73 per cent of the pace the 1.2 million target implies. The National Housing Supply and Affordability Council's latest projection has the target being reached in the December quarter of 20304, after the Accord period ends.
The target is 1.2 million new well-located homes over five years from 1 July 20245. The National Housing Accord's initial aspirational target was one million homes. On 16 August 2023, National Cabinet agreed to increase it to 1.2 million. Spread evenly, the target implies 240,000 homes a year, or 60,000 a quarter, derived by dividing 1.2 million by the five-year period.
Completions are running behind that pace. From the start of the Accord period to the March quarter 2026, 307,882 dwellings were completed, derived by summing the seven quarters of the completions data. That is 25.7 per cent of the target after 35 per cent of the five-year period had elapsed, and about 73 per cent of the implied average pace2.
No calendar year or financial year since 1985 has reached 240,000 completions; the highest calendar-year total was 219,588 in 2018 and the highest financial-year total 219,052 in 2016-172.
The official supply forecast also falls short of the five-year target. In its State of the Housing System 2026 report, released 30 April 2026, the National Housing Supply and Affordability Council estimated that around 980,000 new homes would be completed over the Accord period in the absence of global disruptions to commodity prices and supply chains, 220,000 short of the target and 42,000 more than it forecast in its 2025 report6. Its Middle East conflict scenarios put completions 10,000 lower over the Accord period under a shorter-term scenario and 33,000 lower under a more prolonged one.
Its August 2026 Quarterly Report subsequently projected that cumulative supply would reach 1.2 million in the December quarter of 20304, after the five-year Accord period.
| Dwellings completed in the National Housing Accord period, Australia, by quarter | ||
|---|---|---|
| Quarter | Dwellings completed | Cumulative since 1 July 2024 |
| September 2024 | 46,567 | 46,567 |
| December 2024 | 49,754 | 96,321 |
| March 2025 | 38,035 | 134,356 |
| June 2025 | 41,154 | 175,510 |
| September 2025 | 45,686 | 221,196 |
| December 2025 | 48,353 | 269,549 |
| March 2026 | 38,333 | 307,882 |
Source · ABS Building Activity, Australia, March 2026, Table 37
Section 05 · States and territories
Which states and territories are adding the most people per new home?
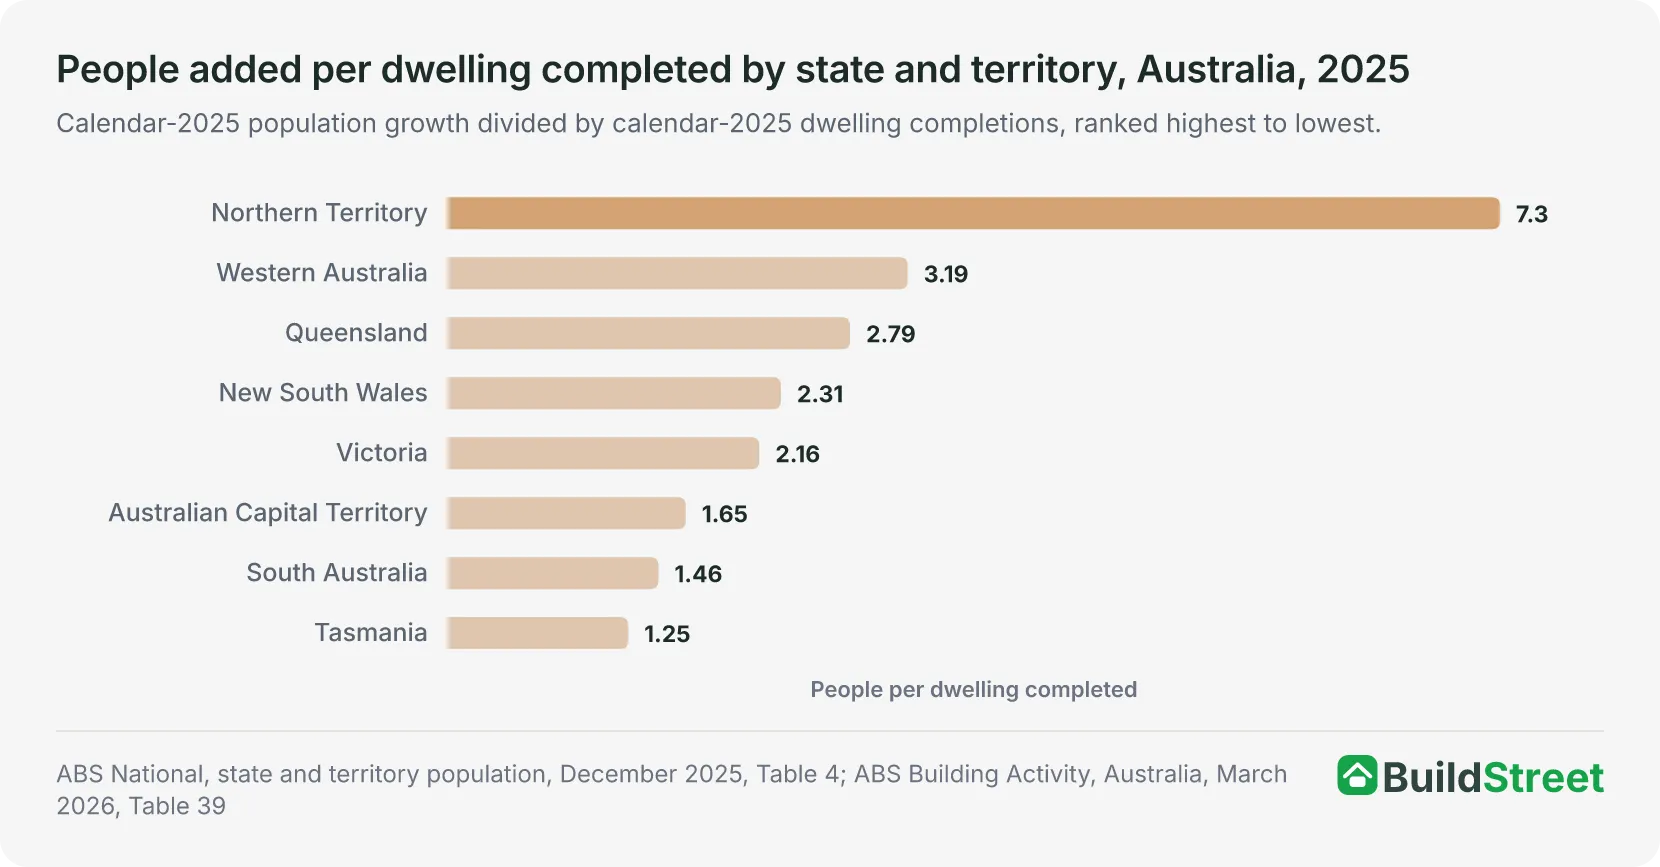
The Northern Territory recorded the highest ratio of any state or territory in 2025, at 7.3 people per dwelling completed, while Western Australia had the highest ratio among the states at 3.19. Western Australia's population grew by 65,465 people in 2025, or 2.17 per cent, the fastest growth rate of any state or territory1. With 20,507 dwellings completed, this equated to 3.19 people per dwelling.
The Northern Territory added 4,240 people while 581 dwellings were completed, equal to 7.3 people per dwelling. It recorded the fewest dwelling completions of any state or territory, and its population increase was the second-smallest after Tasmania, so the annual ratio is sensitive to relatively small changes2. Victoria completed the most dwellings of any state or territory, 54,363, and added the most people, 117,315, equal to 2.16 people per dwelling. New South Wales added 104,611 people while 45,300 dwellings were completed, equal to 2.31 people per dwelling.
The ABS reports that net overseas migration was the major contributor to population change in all states and territories in the year ending 31 December 20251.
Which cities that growth is concentrating in is covered in the fastest growing cities article.
| Population growth and dwelling completions by state and territory, Australia, 2025 | ||||
|---|---|---|---|---|
| State or territory | Population growth | Growth rate % | Dwellings completed | People per dwelling |
| Northern Territory | +4,240 | 1.61 | 581 | 7.30 |
| Western Australia | +65,465 | 2.17 | 20,507 | 3.19 |
| Queensland | +92,162 | 1.64 | 32,977 | 2.79 |
| New South Wales | +104,611 | 1.23 | 45,300 | 2.31 |
| Victoria | +117,315 | 1.67 | 54,363 | 2.16 |
| Australian Capital Territory | +6,033 | 1.25 | 3,663 | 1.65 |
| South Australia | +19,728 | 1.04 | 13,517 | 1.46 |
| Tasmania | +2,908 | 0.50 | 2,318 | 1.25 |
Source · ABS National, state and territory population, December 2025, Table 4; ABS Building Activity, Australia, March 2026, Table 39
Section 06 · The long run
How has population growth compared with home building since 1985?
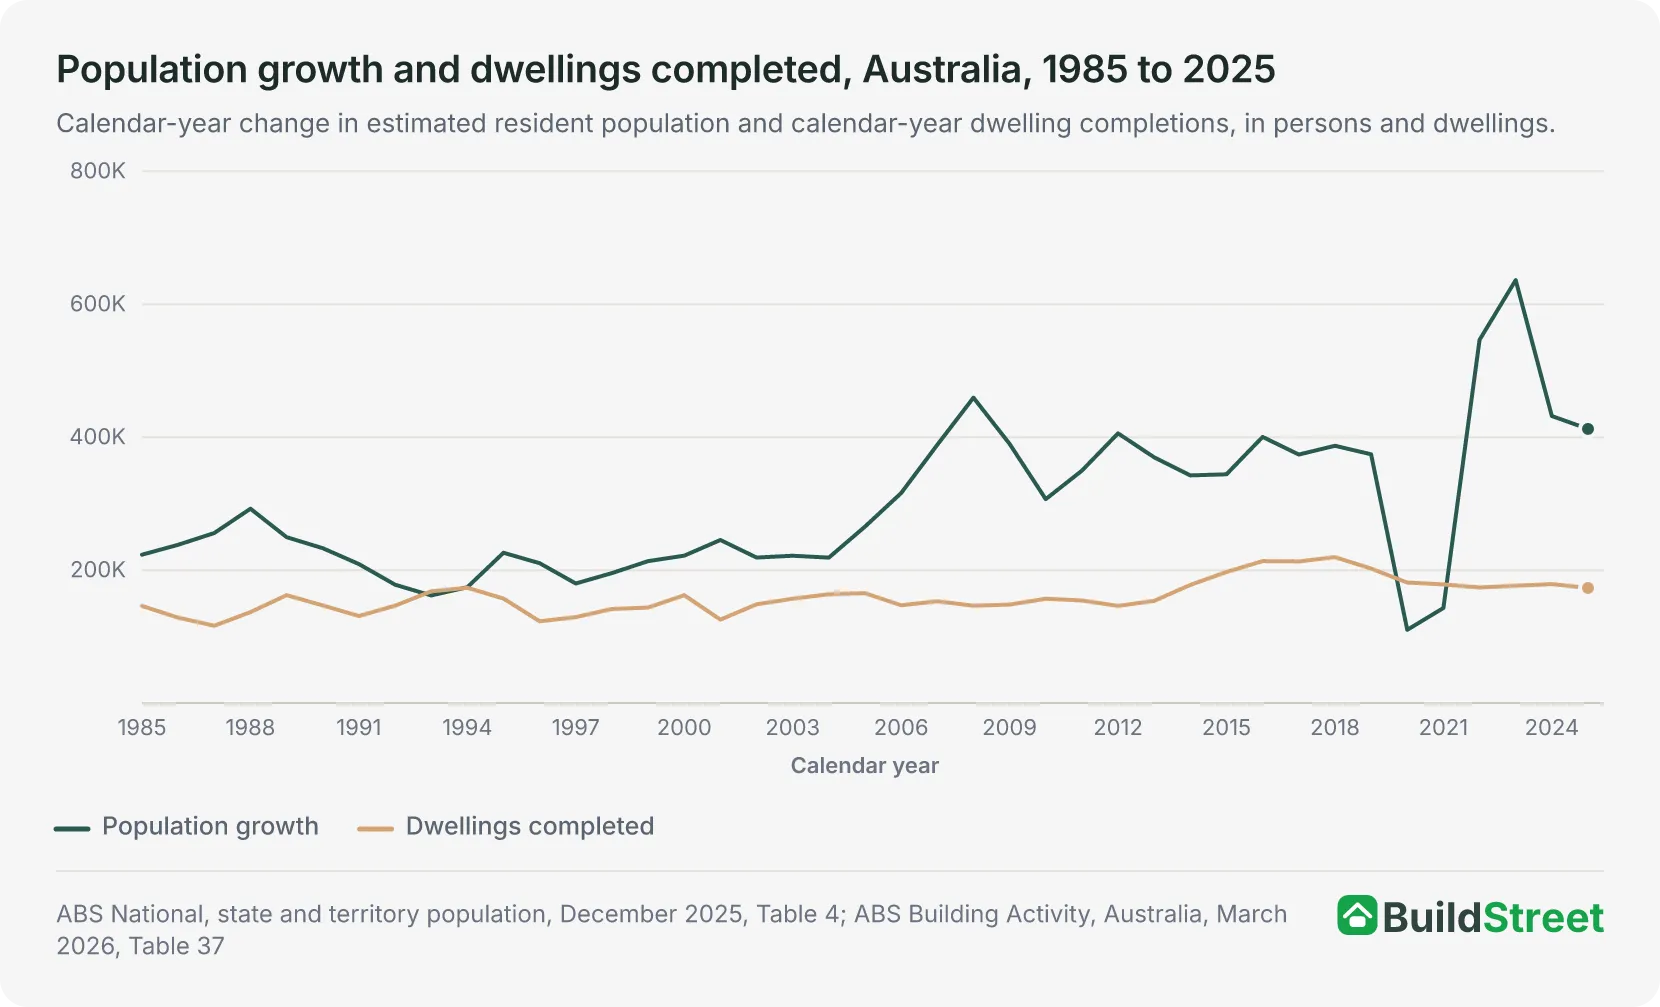
Completions have varied far less than population growth from year to year. Calendar-year completions since 1985 have ranged from 116,384 in 1987 to 219,588 in 2018, less than a doubling between the lowest and highest annual totals, while annual population growth has ranged from 110,230 in 2020 to 636,375 in 2023, close to a sixfold spread2.
Recent changes in population growth coincided with large changes in net overseas migration. In the year ending June 2021, the population grew by 36,164 people. Net overseas migration then rose to a peak of 555,800 in the year ending September 2023 and eased to 301,000 in the year ending 31 December 2025, when natural increase was 111,5001.
The migration series behind those swings is covered in the immigration trends article.
Dwelling completions varied much less over the recent four-year period. Across 2022 to 2025, the population grew by 2,027,228 people while 702,842 dwellings were completed, equal to 2.88 people per dwelling completed against 1.85 across 1985 to 2025 as a whole. Completions in those four years stayed between 173,228 and 179,0762.
| Population growth, dwelling completions and the ratio, Australia, 2016 to 2025 | |||
|---|---|---|---|
| Calendar year | Population growth | Dwellings completed | People per dwelling |
| 2016 | +400,483 | 213,644 | 1.87 |
| 2017 | +373,954 | 213,181 | 1.75 |
| 2018 | +387,122 | 219,588 | 1.76 |
| 2019 | +374,328 | 202,467 | 1.85 |
| 2020 | +110,230 | 181,340 | 0.61 |
| 2021 | +143,097 | 178,560 | 0.80 |
| 2022 | +546,490 | 173,902 | 3.14 |
| 2023 | +636,375 | 176,636 | 3.60 |
| 2024 | +431,869 | 179,076 | 2.41 |
| 2025 | +412,494 | 173,228 | 2.38 |
Source · ABS National, state and territory population, December 2025, Table 4; ABS Building Activity, Australia, March 2026, Table 37
Section 07
Population growth and housing: quick answers
Is Australia building enough homes to keep up with population growth?
In 2025 Australia added 412,500 people and completed 173,228 dwellings, equal to 2.38 people for each dwelling completed. Across the four years 2022 to 2025, the ratio was 2.88, and across 1985 to 2025 as a whole it was 1.85. The comparison is approximate because completions are not the same as net additions to the housing stock.
How many homes does Australia build each year?
Australia completed 173,228 dwellings in the 2025 calendar year. Completions in any four consecutive quarters since the December quarter 2015 have totalled between 172,522 and 223,090. The highest calendar-year total on record was 219,588, in 2018.
How many people does Australia add per new home built?
Australia added 2.38 people for each dwelling completed in 2025, and 1.85 across 1985 to 2025 as a whole. The annual ratio ranged from 0.61 in 2020 to 3.6 in 2023, both within the 2020s.
What is the National Housing Accord target?
The National Housing Accord target is 1.2 million new well-located homes over five years from 1 July 2024, increased by National Cabinet on 16 August 2023 from an initial one million. Completions in the first seven quarters of the period totalled 307,882. In April 2026, the National Housing Supply and Affordability Council estimated that around 980,000 homes would be completed over the Accord period, while its August 2026 Quarterly Report projected that cumulative supply would reach 1.2 million in the December quarter of 2030, about 18 months after the Accord period ends.
Which state or territory has the biggest gap between population growth and home building?
The Northern Territory added 7.3 people for each dwelling completed in 2025, the highest ratio of any state or territory. Its population increased by 4,240 people while 581 dwellings were completed, the fewest completions of any jurisdiction. Among the states, Western Australia's 3.19 was the highest and Tasmania's 1.25 the lowest.
Do dwelling completions equal new housing supply?
No. Dwelling completions count dwellings finished during the period and do not subtract demolitions or other removals from the housing stock, so they do not measure the net change in housing stock. The figures on this page use the ABS total dwelling completions series, the broadest measure of finished supply.
References
- ABS, National, state and territory population, December 2025 · Australian Bureau of Statistics ↑ b c d e f
- ABS, Building Activity, Australia (latest release, Cat. 8752.0) · Australian Bureau of Statistics ↑ b c d e f g h i j k
- ABS 2021 Census of Population and Housing, All persons QuickStats · Australian Bureau of Statistics ↑ b
- NHSAC Quarterly Report – August 2026 · nhsac.gov.au ↑ b
- Treasury, National Housing Accord · treasury.gov.au ↑
- NHSAC State of the Housing System 2026 · nhsac.gov.au ↑
