

Published 25 Aug 2026 · Updated 18 Sept 2026
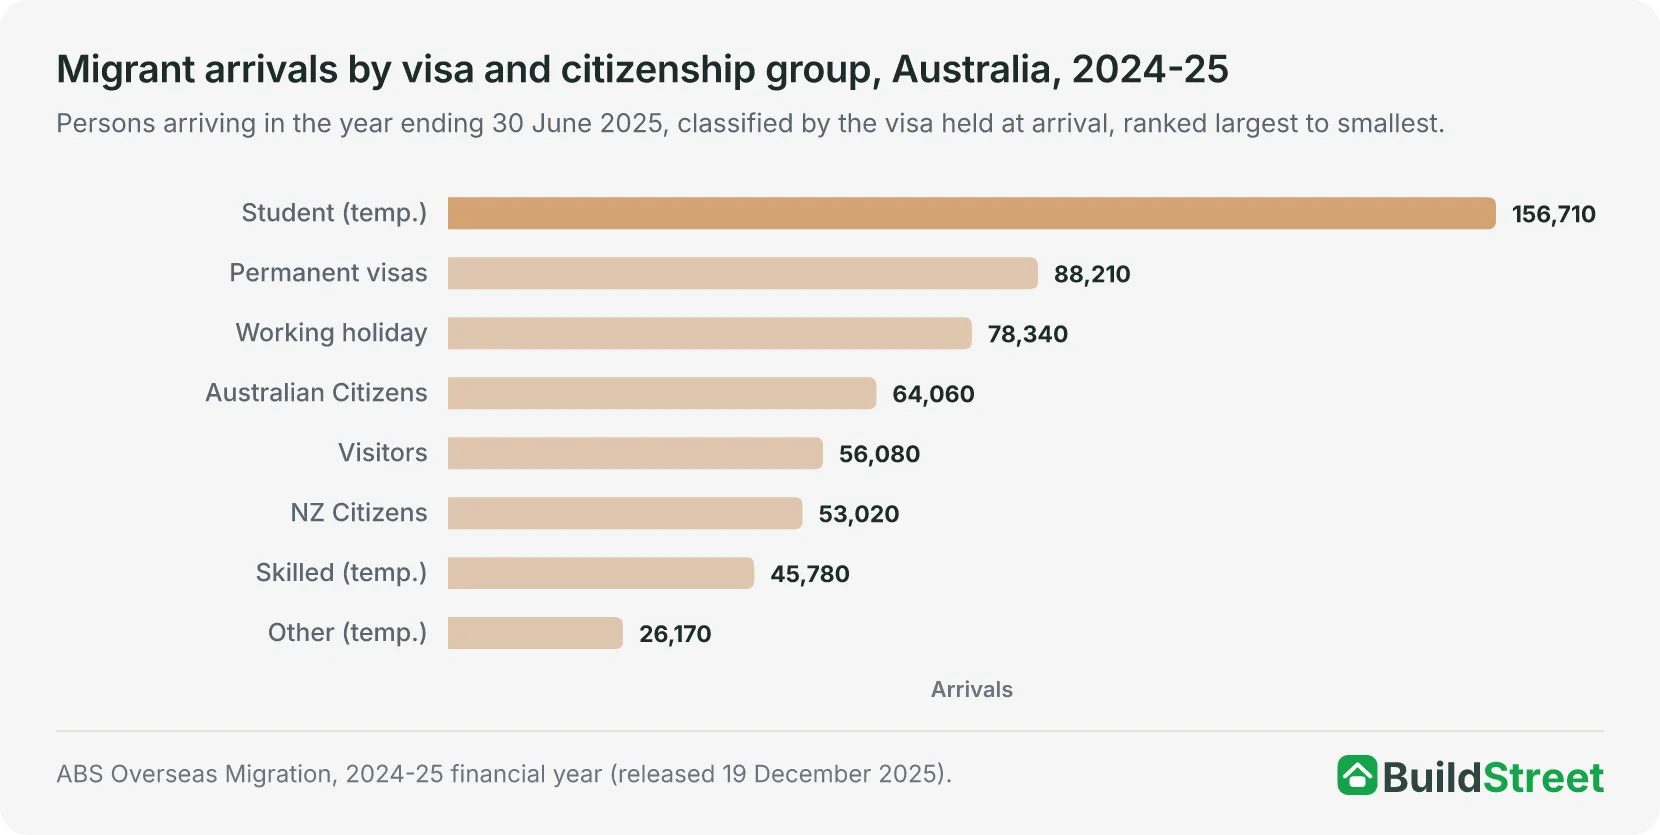 The other migration numberInterstate moves redistribute people between states and territories; overseas migration changes the national total. The companion article covers arrivals, departures, visa groups and source countries behind net overseas migration of 305,570 in 2024-25.
 Australia's population in fullThe population article puts interstate migration alongside births, deaths and overseas migration, the three components that took Australia's population to 27.8 million at the end of 2025.
Section 01 · The headline numbers
How many people move interstate in Australia?
People changed their home state 362,891 times in the 2025 calendar year. That is an average of about 990 moves a day, derived by dividing the annual total by 3651. Each interstate move appears as an arrival in one state or territory and a departure from another, so total arrivals and departures are equal and the net gains and losses across the country sum to zero.
Australia recorded fewer interstate moves in 2025 than in any of the four preceding years. Interstate moves fell from 426,630 in 2021 to 395,968 in 2022, 386,034 in 2023, 383,997 in 2024 and 362,891 in 2025, a decrease of 15 per cent over four years, derived from the 2021 and 2025 totals1.
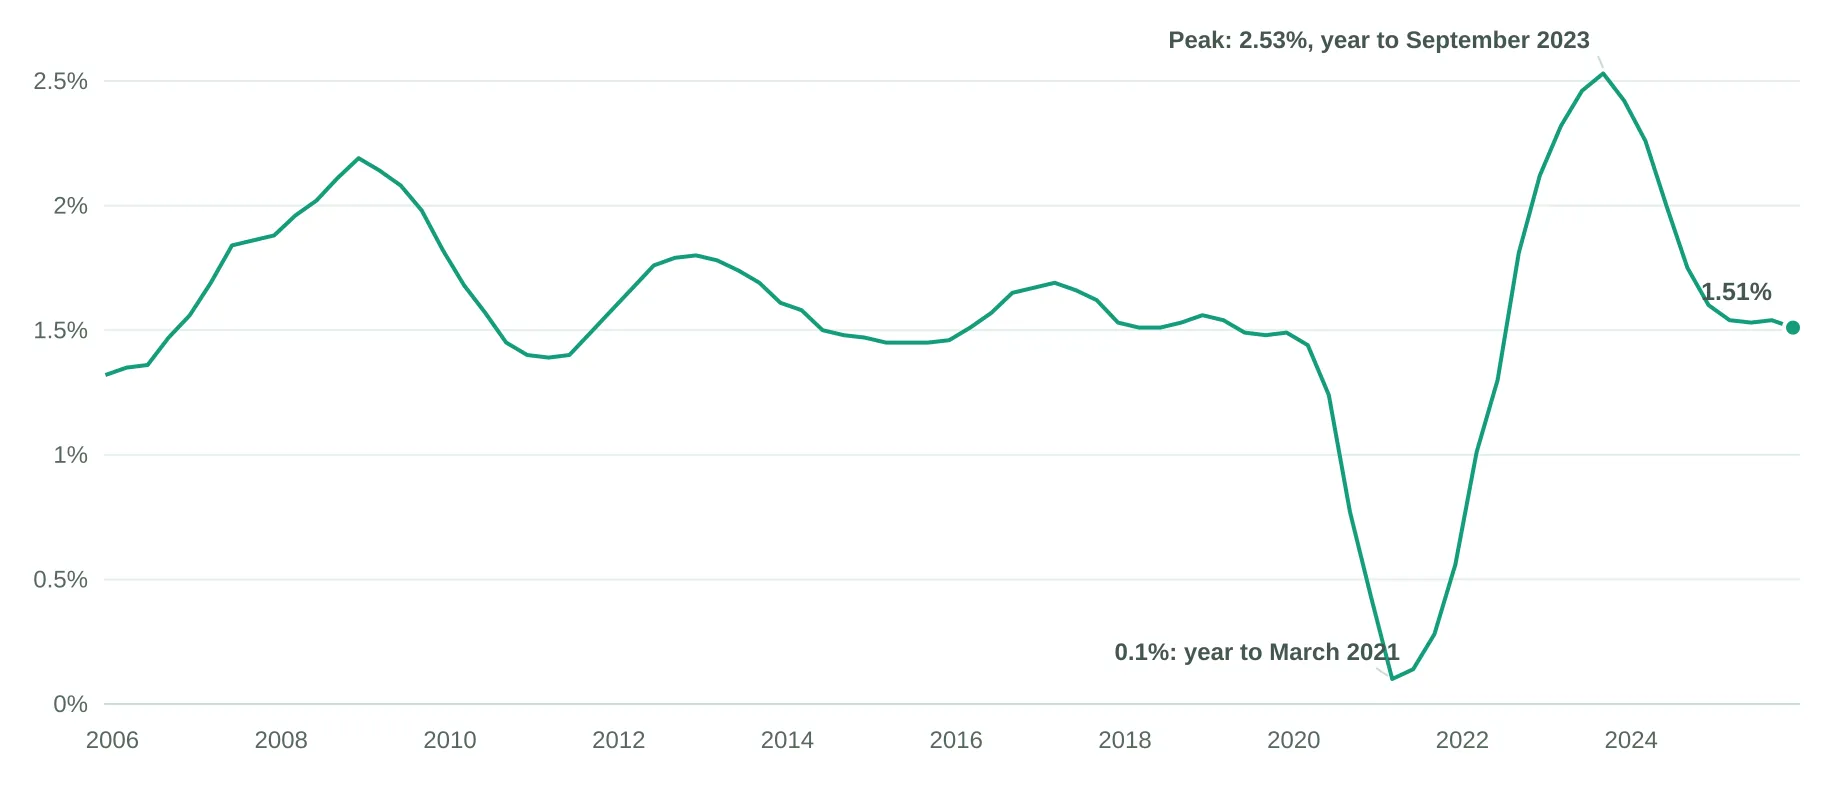
The fall is part of a longer-term decline in interstate mobility. According to the Centre for Population, the share of the population moving interstate each year has been declining since the 1990s, when it averaged around 2 per cent, and it forecasts that 1.5 per cent of the population will move interstate in 2027-282. The Centre links the decline to an older population that is less likely to relocate and a higher share of dual-income households.
The estimates are modelled from administrative data rather than counted from a register. Some people update their address well after moving, which can affect the timing of the estimates3.
Population totals for each state, including the other growth components, are covered in the Australian population statistics article.
| Interstate moves, Australia, 2020 to 2025 | |
|---|---|
| Calendar year | Interstate moves |
| 2020 | 337,992 |
| 2021 | 426,630 |
| 2022 | 395,968 |
| 2023 | 386,034 |
| 2024 | 383,997 |
| 2025 | 362,891 |
Source · ABS National, state and territory population, December 2025, Table 14.
Section 02 · Gains and losses
Which states are gaining people from interstate migration?
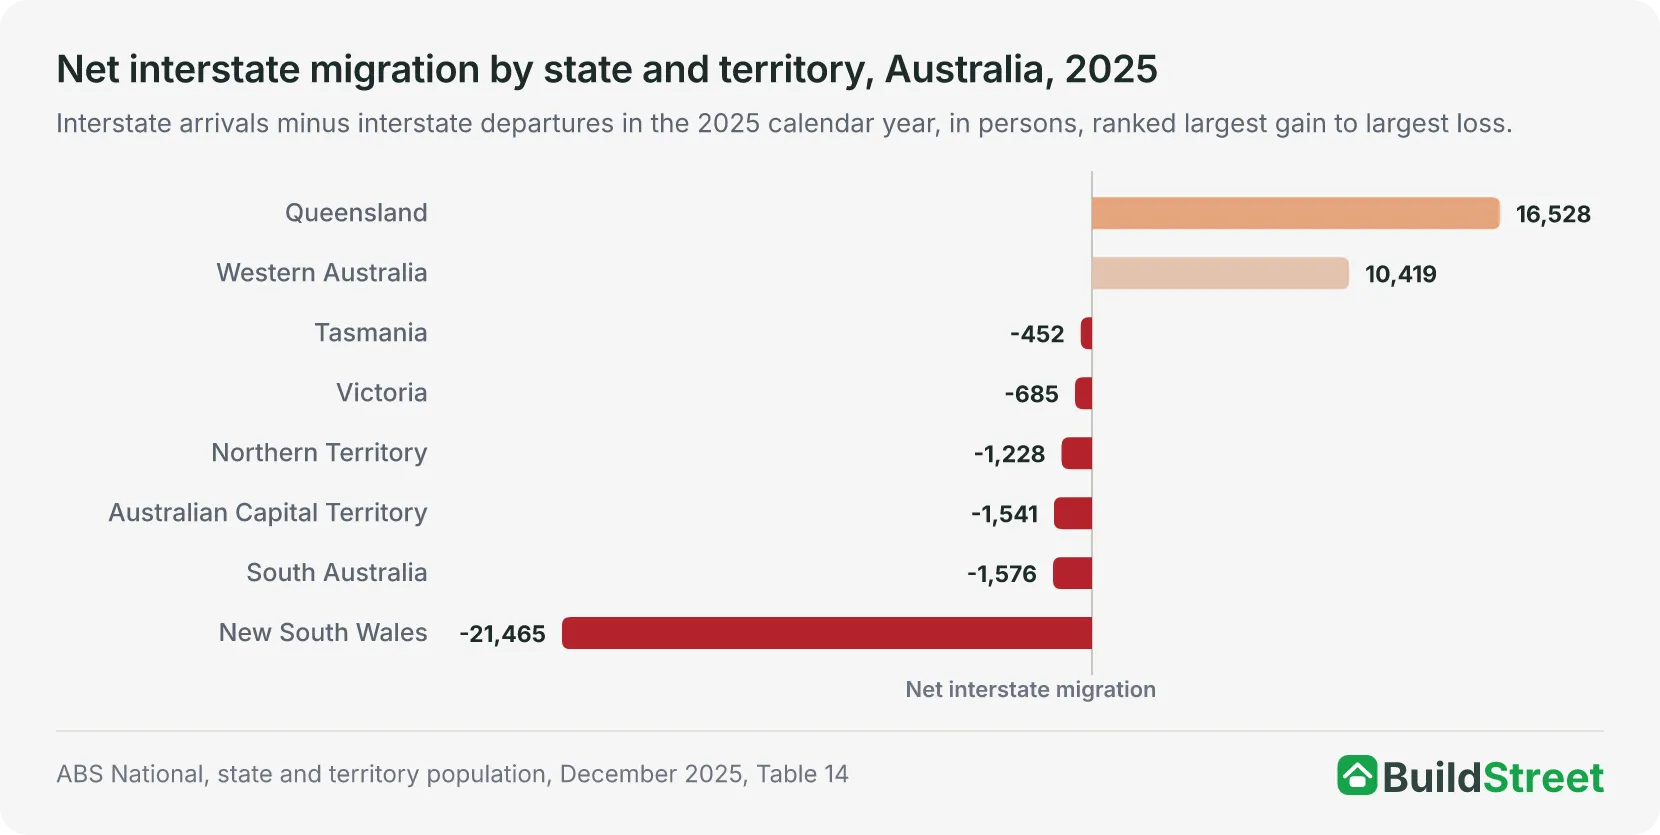
Queensland gained more people from interstate migration than any other state or territory in 2025. The state recorded 97,433 interstate arrivals and 80,905 interstate departures in the calendar year, a net gain of 16,528 people1. Western Australia gained a net 10,419, from 37,796 arrivals and 27,377 departures. Queensland and Western Australia were the only two of the eight states and territories to gain people from interstate moves in 2025.
New South Wales recorded the largest net loss. The state recorded 104,719 interstate departures against 83,254 arrivals in 2025, a net loss of 21,465 people, the largest of any state or territory1. The other net losses were 1,576 people in South Australia, 1,541 in the Australian Capital Territory, 1,228 in the Northern Territory, 685 in Victoria, and 452 in Tasmania.
Victoria's net interstate loss narrowed from 4,764 in 2023 to 4,639 in 2024 and then to 685 in 2025. In the September quarter of 2025, the state recorded a net gain of 115 people, its first quarter with a net gain in the ABS series since the December quarter of 20191.
Interstate migration is one of three components of state population change, alongside natural increase and net overseas migration. In 2025, interstate migration added to population growth in some states and subtracted from it in others. Queensland recorded a net interstate migration gain of 16,528 alongside net overseas migration of 54,604. New South Wales grew overall despite its interstate loss, with net overseas migration of 90,961 and natural increase of 35,115 together more than offsetting it1.
Queensland's population growth is covered in more detail in the Queensland population article.
| Interstate arrivals, departures and net, by state and territory, Australia, 2025 | |||
|---|---|---|---|
| State or territory | Arrivals | Departures | Net |
| New South Wales | 83,254 | 104,719 | -21,465 |
| Victoria | 73,691 | 74,376 | -685 |
| Queensland | 97,433 | 80,905 | +16,528 |
| South Australia | 23,557 | 25,133 | -1,576 |
| Western Australia | 37,796 | 27,377 | +10,419 |
| Tasmania | 13,934 | 14,386 | -452 |
| Northern Territory | 14,258 | 15,486 | -1,228 |
| Australian Capital Territory | 18,968 | 20,509 | -1,541 |
| Australia | 362,891 | 362,891 | 0 |
Source · ABS National, state and territory population, December 2025, Table 14.
Section 03 · State-to-state flows
Which state-to-state moves are the largest?
The largest state-to-state flow in 2025 was from New South Wales to Queensland. In 2025, 44,751 people moved from New South Wales to Queensland and 33,886 moved the other way. The combined flow of 78,637 people was the largest between any two states, and Queensland gained a net 10,865 people from New South Wales alone4. New South Wales accounted for 46 per cent of Queensland's 97,433 interstate arrivals, derived by dividing 44,751 by the state's total arrivals. A further 25,877 arrivals came from Victoria.
New South Wales lost people on its two biggest state-to-state flows. It lost a net 10,865 people to Queensland and a net 3,438 to Victoria, with 26,729 moves from New South Wales to Victoria against 23,291 the other way4. The flow between New South Wales and the Australian Capital Territory was closer to balance, with 10,721 moves into the territory against 10,281 out, a net gain to the territory of 440 people.
Western Australia gained from every other state and territory in 2025. Its largest net inflows came from New South Wales at 4,442, Queensland at 2,327 and Victoria at 2,229, with smaller net gains from South Australia, the Northern Territory, Tasmania and the Australian Capital Territory4.
Section 04 · Who moves
Which age groups move interstate the most?
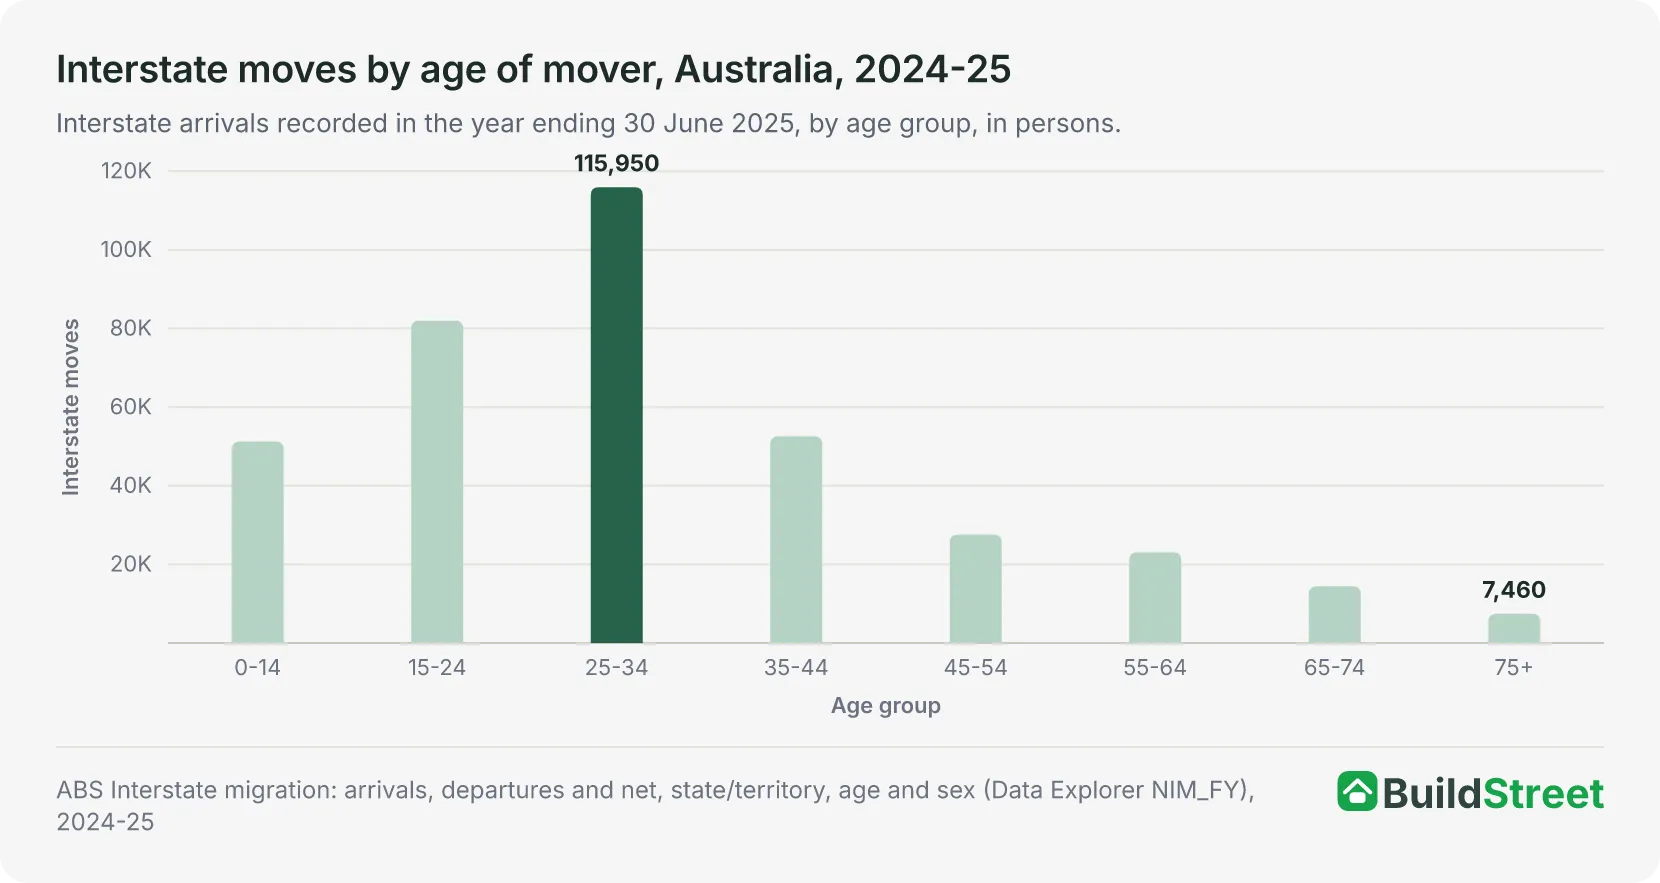
People aged 25 to 34 made 115,950 interstate moves in 2024-25. Of the 374,450 interstate moves the ABS recorded in 2024-25, the 115,950 figure was derived by summing the published 25-29 and 30-34 groups5. The single largest five-year group was people aged 25 to 29, with 67,150 moves.
People aged 20 to 34 made close to half of all interstate moves in 2024-25. The group made 173,660 interstate moves that year, which is 46 per cent of the total, derived by summing the 20-24, 25-29 and 30-34 groups and dividing by the all-ages figure5. The number of moves declined with age beyond that range in 2024-25: people aged 45 to 54 made 27,610 moves, those aged 65 to 74 made 14,450 and those aged 75 and over made 7,460.
The counts include children. The 0-14 age group accounted for 51,270 interstate moves in 2024-25, which is 14 per cent of the total, derived by dividing the age-group total by the all-ages figure5.
Section 05 · Capitals and regions
Are Australia's capital cities losing people to the regions?
Most of Australia's greater capital cities recorded net losses to rest-of-state areas in 2025. Internal migration is a wider measure than interstate migration because it also counts moves within a state, such as a move from Sydney to the New South Wales coast. On the ABS provisional estimates for the four quarters of 2025 combined, Australia's greater capital cities recorded a combined net internal migration loss of 28,015 people6.
Greater Sydney recorded the largest net internal migration loss of any greater capital city in 2025. The city recorded a net internal migration loss of 28,139 people across 2025, split almost evenly between 13,807 lost to regional New South Wales and 14,332 lost interstate6. Greater Melbourne's loss had a different composition. The city lost a net 9,855 people to regional Victoria and gained a net 2,284 from the other states and territories, resulting in a combined net internal loss of 7,571; regional Victoria, in turn, lost a net 2,969 people interstate.
Greater Perth and Greater Brisbane were the only greater capital cities with net internal migration gains in 2025. Greater Perth added a net 8,650 people and Greater Brisbane 6,578. The largest rest-of-state gain was regional Queensland's 9,950, and regional Queensland's net interstate gain of 9,332 exceeded Greater Brisbane's 7,1966.
What these movements mean for dwelling demand is covered in the population growth versus housing supply article.
| Net internal migration, greater capital cities, Australia, 2025 | |||
|---|---|---|---|
| Greater capital city | Net internal | Interstate | Within state |
| Greater Sydney | -28,139 | -14,332 | -13,807 |
| Greater Melbourne | -7,571 | +2,284 | -9,855 |
| Greater Brisbane | +6,578 | +7,196 | -618 |
| Greater Adelaide | -3,480 | -1,731 | -1,749 |
| Greater Perth | +8,650 | +9,336 | -686 |
| Greater Hobart | -1,614 | -1,593 | -21 |
| Greater Darwin | -898 | -1,322 | +424 |
| Australian Capital Territory | -1,541 | -1,541 | n/a |
Source · ABS Regional internal migration estimates, provisional, December 2025, Table 1.
Section 06 · The outlook
What is the outlook for interstate migration?
The Centre for Population expects established interstate migration patterns to continue. It states that net internal migration trends have remained consistent since the 1980s: New South Wales, South Australia and the Northern Territory tend to lose residents, while Queensland gains them2.
Age patterns are also expected to persist. The Australian Capital Territory typically receives inflows of people under 35 and records outflows of those aged 50 to 69, while Tasmania shows the opposite pattern, with inflows of people over 45 and outflows of those aged 15 to 242.
Rest-of-state Queensland is an exception to the broader pattern of capital cities growing faster than regional areas. It is projected to keep pace with Brisbane's growth, partly because of positive net interstate migration2. Over the long run, 72 per cent of Australia's population is projected to live in capital cities by 2065-66, up from 68 per cent at the time of publication.
Section 07 · The long run
How has interstate migration changed over 20 years?
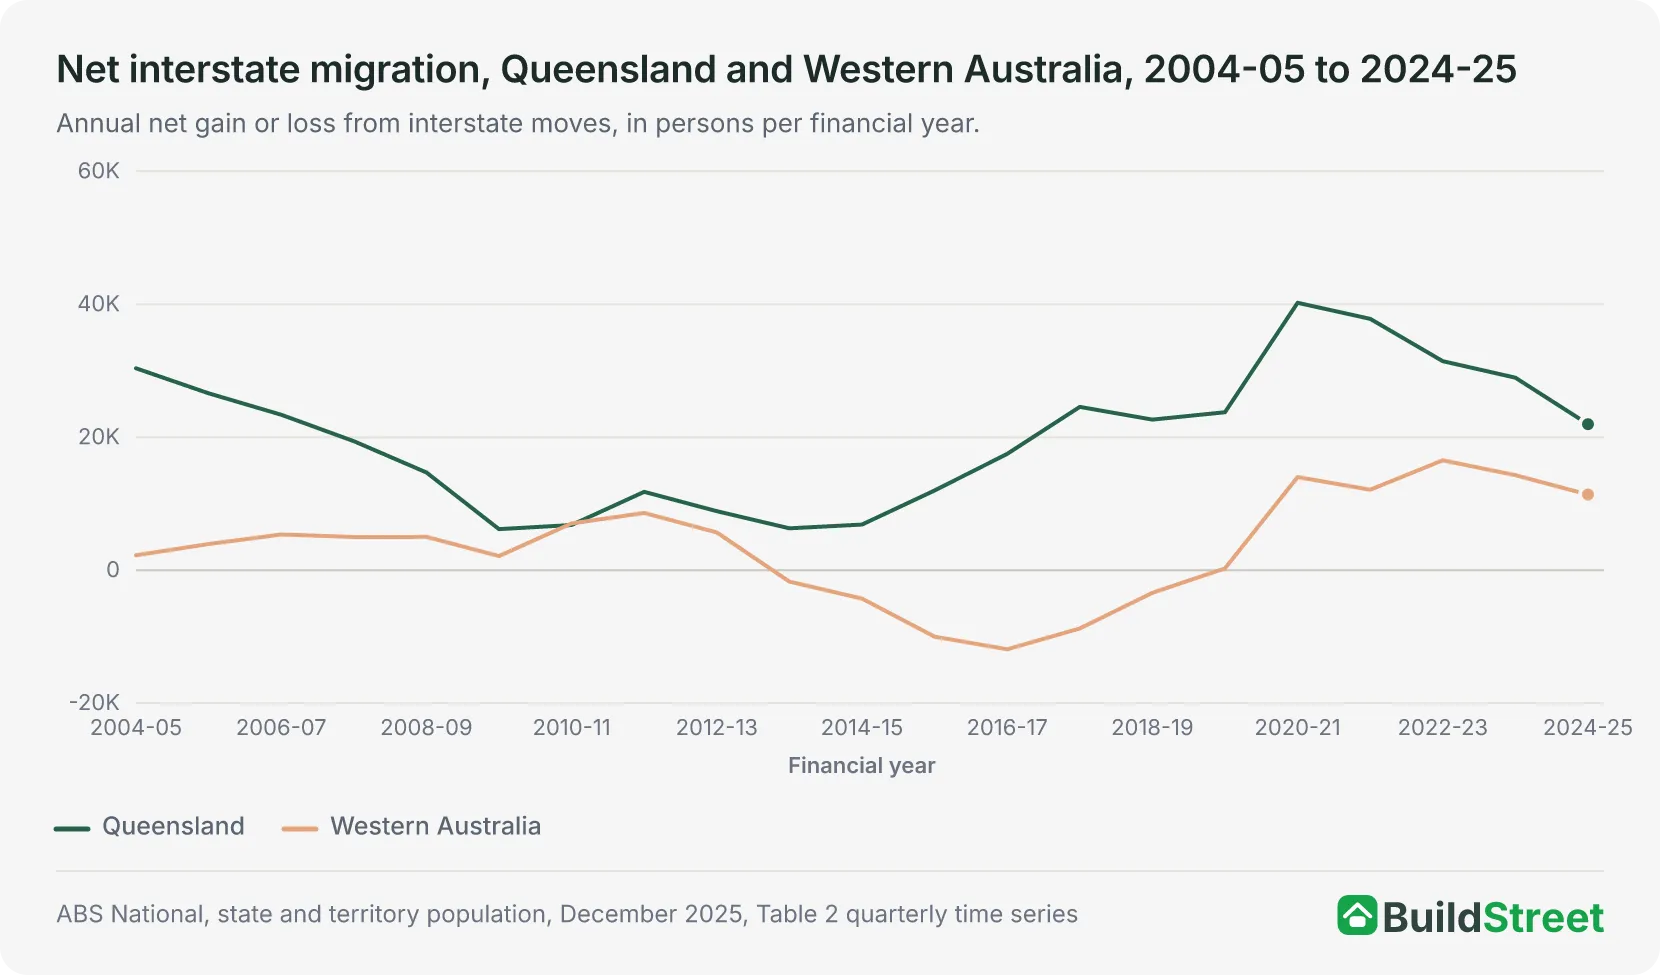
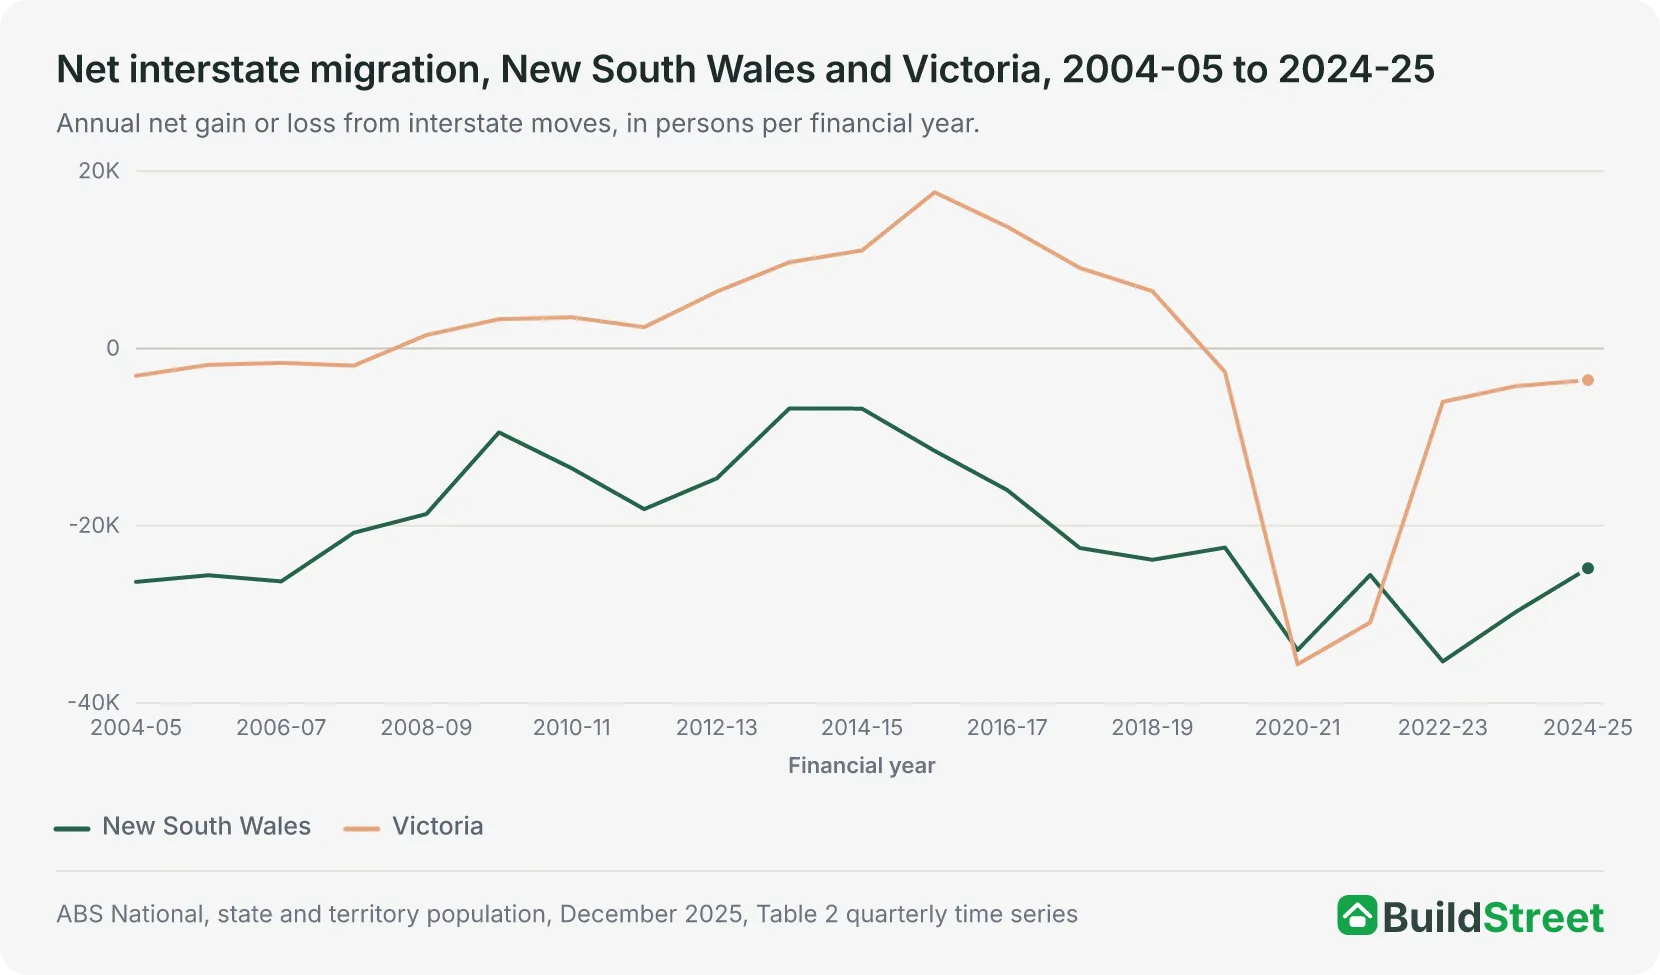
Across the 21 financial years from 2004-05 to 2024-25, Queensland recorded a net interstate migration gain every year, while New South Wales recorded a net loss every year. Western Australia and Victoria both moved between gains and losses.
Two states never changed direction. Queensland recorded a net interstate migration gain in each of the 21 financial years from 2004-05 to 2024-25, ranging from 6,172 in 2009-10 to 40,223 in 2020-21, and New South Wales recorded a net loss in each of the same 21 years, ranging from 6,751 in 2013-14 to 35,299 in 2022-231.
Western Australia moved in both directions across the series. The state gained people in every year from 2004-05 to 2012-13 and lost people in each of the six years from 2013-14 to 2018-19, with its largest loss, 11,901, in 2016-17. It has gained in every year since 2019-20, with its largest gain of 16,527 in 2022-231. The data does not identify the cause of these swings.
Victoria covered the widest range of any state or territory in the series. The state gained people in each of the 11 years from 2008-09 to 2018-19, with a maximum of 17,639 in 2015-16. In 2020-21 it recorded a loss of 35,622, the largest single-year interstate loss by any state or territory in the 21-year series. In the same year, Queensland recorded the largest single-year net gain in the series, at 40,223. By 2024-25 Victoria's loss had narrowed to 3,5581.
| Net interstate migration by state and territory, Australia, 2004-05 to 2024-25 | ||||||||
|---|---|---|---|---|---|---|---|---|
| Financial year | NSW | Vic | Qld | SA | WA | Tas | NT | ACT |
| 2004-05 | -26,321 | -3,070 | +30,371 | -3,226 | +2,241 | +267 | +610 | -842 |
| 2005-06 | -25,576 | -1,831 | +26,607 | -2,711 | +3,933 | -82 | -553 | +258 |
| 2006-07 | -26,271 | -1,617 | +23,381 | -3,371 | +5,362 | -537 | +443 | +2,465 |
| 2007-08 | -20,780 | -1,924 | +19,409 | -4,221 | +4,991 | +730 | +1,389 | +260 |
| 2008-09 | -18,667 | +1,523 | +14,702 | -4,402 | +5,012 | +1,063 | +934 | -309 |
| 2009-10 | -9,458 | +3,314 | +6,172 | -2,709 | +2,119 | +664 | -661 | +427 |
| 2010-11 | -13,496 | +3,534 | +6,795 | -2,614 | +7,033 | -47 | -2,549 | +1,354 |
| 2011-12 | -18,115 | +2,417 | +11,782 | -3,220 | +8,609 | -1,925 | -691 | +1,145 |
| 2012-13 | -14,645 | +6,420 | +8,874 | -4,761 | +5,676 | -1,286 | -481 | +202 |
| 2013-14 | -6,751 | +9,739 | +6,294 | -3,890 | -1,724 | -435 | -2,421 | -812 |
| 2014-15 | -6,776 | +11,079 | +6,861 | -4,570 | -4,278 | +127 | -2,341 | -103 |
| 2015-16 | -11,539 | +17,639 | +11,986 | -7,212 | -10,010 | +760 | -2,029 | +383 |
| 2016-17 | -15,964 | +13,748 | +17,494 | -6,300 | -11,901 | +1,941 | -1,933 | +2,915 |
| 2017-18 | -22,499 | +9,101 | +24,563 | -4,672 | -8,773 | +3,029 | -2,677 | +1,928 |
| 2018-19 | -23,830 | +6,480 | +22,646 | -3,313 | -3,407 | +2,211 | -3,012 | +2,225 |
| 2019-20 | -22,450 | -2,652 | +23,759 | -1,253 | +268 | +888 | -899 | +2,339 |
| 2020-21 | -34,008 | -35,622 | +40,223 | +4,851 | +14,003 | +4,597 | -319 | +6,275 |
| 2021-22 | -25,549 | -30,904 | +37,807 | +3,803 | +12,100 | +789 | -205 | +2,159 |
| 2022-23 | -35,299 | -6,014 | +31,437 | +479 | +16,527 | -3,887 | -2,269 | -974 |
| 2023-24 | -29,745 | -4,242 | +28,957 | -1,766 | +14,288 | -3,409 | -2,516 | -1,567 |
| 2024-25 preliminary | -24,786 | -3,558 | +21,964 | -2,422 | +11,377 | -601 | -851 | -1,123 |
Source · ABS National, state and territory population, December 2025, Table 2 time series.
Section 08
Interstate migration in Australia: quick answers
Which Australian state is gaining the most people from interstate migration?
Queensland gained the most people from interstate migration in the 2025 calendar year, a net 16,528, ahead of Western Australia at 10,419. They were the only two of the eight states and territories to record net gains in 2025.
How many people move interstate in Australia each year?
Australia recorded 362,891 interstate moves in the 2025 calendar year, an average of about 990 moves a day derived by dividing the annual total by 365. Interstate moves fell from 426,630 in 2021 to 362,891 in 2025, a decrease of 15 per cent over four years, derived from those two values.
Where do most of Queensland's interstate migrants come from?
New South Wales was the largest origin of Queensland's interstate arrivals in 2025. Of the 97,433 people who moved to Queensland from another state or territory, 44,751 came from New South Wales, equivalent to 46 per cent of arrivals, derived by dividing that flow by total arrivals. A further 25,877 came from Victoria.
Is Victoria losing people to other states?
Victoria recorded a net interstate migration loss of 685 people in the 2025 calendar year, down from its 35,622 net loss in 2020-21. In the September quarter of 2025 Victoria recorded a net gain of 115 people, its first quarter with a net gain in the ABS series since the December quarter of 2019.
Which age group moves interstate the most?
People aged 25 to 34 made the most interstate moves in 2024-25, accounting for 115,950 of the 374,450 moves the ABS recorded, derived by summing the published 25-29 and 30-34 age groups. People aged 20 to 34 together made 46 per cent of all interstate moves, derived by dividing their 173,660 moves by the total.
What is net interstate migration?
Net interstate migration is interstate arrivals minus interstate departures for a state or territory, and can be positive or negative. Across Australia, net gains and losses sum to zero because every interstate move is a departure from one state or territory and an arrival in another.
References
- ABS, National, state and territory population, December 2025 · Australian Bureau of Statistics ↑ b c d e f g h i
- 2025 Population Statement · population.gov.au ↑ b c d
- ABS, National, state and territory population methodology, December 2025 · Australian Bureau of Statistics ↑
- ABS, Interstate migration by states and territories of arrival and departure by sex, quarterly (ABS_DEM_QIM, SDMX) · dataexplorer.abs.gov.au ↑ b c
- ABS, Interstate migration: arrivals, departures and net, state/territory, age and sex, financial years (NIM_FY, SDMX) · dataexplorer.abs.gov.au ↑ b c
- ABS, Regional internal migration estimates, provisional, December 2025 · Australian Bureau of Statistics ↑ b c
