

Published
 How stamp duty has changed in AustraliaDuty thresholds over time, bracket creep, stamp duty revenue as a share of state and territory taxes and the debate over replacing it with land tax.
 Stamp duty in each state and territoryWhat a home buyer pays in stamp duty at different purchase prices, with first-home buyer concessions and foreign buyer surcharges.
Section 01 · 2026-27 budgets
How much stamp duty and land tax will states and territories collect in 2026-27?
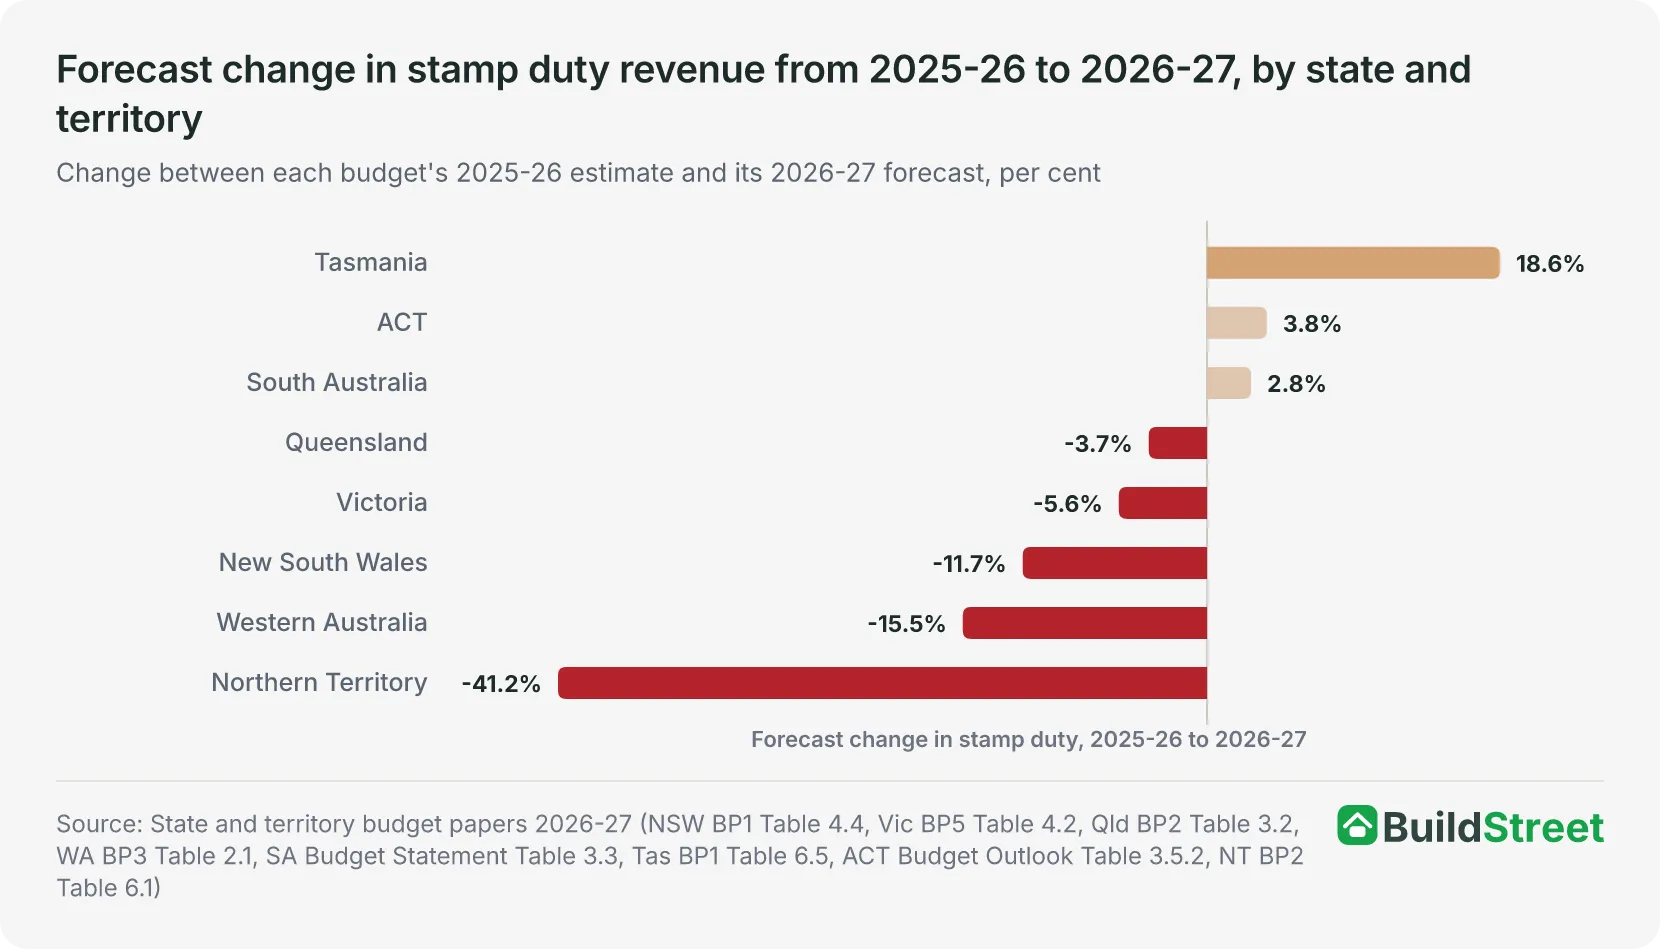
Added together, the eight state and territory budgets forecast $37.5 billion in stamp duty in 2026-27, a fall of $3.2 billion, or 7.9 per cent, from the $40.7 billion estimated for 2025-2612345678. Land tax is forecast at a combined $21.1 billion in 2026-27, an increase of $1.6 billion, or 8.0 per cent, in the seven states and territories that levy it2345678.
State and territory budgets use different names for stamp duty, including transfer duty, land transfer duty or conveyance duty, and definitions vary between jurisdictions.
New South Wales is forecast to record the largest fall in stamp duty revenue of any state or territory in dollar terms, at $1,665 million, from $14,263 million in 2025-26 to $12,598 million in 2026-278.
Western Australia's transfer duty, excluding landholder duty and the foreign buyers surcharge, is forecast to fall 15.5 per cent, from $4,302 million in 2025-26 to $3,637 million in 2026-275. Including those duties, the state's budget forecasts a 19 per cent fall, mainly because of fewer very high value commercial transactions after unusually high collections in 2025-26.
The Northern Territory is forecast to record the largest percentage fall in stamp duty of any state or territory, at 41.2 per cent, from $245 million in 2025-26 to $144 million in 2026-271. Its budget attributes the high 2025-26 estimate partly to strong investor activity and an extended homeowner grants program.
Stamp duty is forecast to increase in 2026-27 in South Australia4, Tasmania3 and the Australian Capital Territory (ACT)2. Tasmania's conveyance duty is forecast to increase 18.6 per cent, from $437.2 million in 2025-26 to $518.5 million in 2026-273. Tasmania's budget expects the end of time-limited duty concessions and exemptions to increase conveyance duty revenue through to 2029-30.
Land tax is forecast to increase in 2026-27 in all seven states and territories that levy it, with increases ranging from 0.1 per cent in Tasmania to 31.1 per cent in Western Australia35. New South Wales is forecast to have the largest land tax revenue of any state or territory in 2026-27, at $8,969 million8. The Northern Territory does not levy land tax1.
| Stamp duty and land tax forecasts by state and territory, 2025-26 and 2026-27 ($ million) | ||||||
|---|---|---|---|---|---|---|
| State or territory | Stamp duty 2025-26 estimate | Stamp duty 2026-27 forecast | Change | Land tax 2025-26 estimate | Land tax 2026-27 forecast | Change |
| New South Wales | 14,263 | 12,598 | −11.7% | 8,462 | 8,969 | +6.0% |
| Victoria | 10,601 | 10,009 | −5.6% | 6,258 | 6,456 | +3.2% |
| Queensland | 8,671 | 8,346 | −3.7% | 2,690 | 3,162 | +17.5% |
| Western Australia | 4,302 | 3,637 | −15.5% | 988 | 1,295 | +31.1% |
| South Australia | 1,784 | 1,834 | +2.8% | 664 | 732 | +10.2% |
| Tasmania | 437.2 | 518.5 | +18.6% | 203.4 | 203.6 | +0.1% |
| Australian Capital Territory | 359.4 | 373.0 | +3.8% | 241.6 | 253.7 | +5.0% |
| Northern Territory | 245 | 144 | −41.2% | No land tax | ||
| Eight budgets combined | 40,663 | 37,460 | −7.9% | 19,507 | 21,071 | +8.0% |
Source · 2026-27 state and territory budget papers.
Section 02 · Revisions
Which states and territories have revised their stamp duty forecasts?
New South Wales and the ACT lowered their 2026-27 stamp duty forecasts compared with their 2025-26 budgets, by $1,428 million and $6.9 million respectively28910. Compared with its more recent December 2025 Half-Yearly Review, New South Wales also reduced its forecasts for transfer duty and land tax by a combined $8.4 billion over the four years to 2029-30, including $5.3 billion in transfer duty and $3.1 billion in land tax8.
NSW Treasury attributes the revision to a weaker property market outlook following interest rate changes since the Half-Yearly Review8.
Victoria's 2026-27 land transfer duty forecast of $10,009 million is $16 million higher than in its May 2025 budget, but $596 million lower than the $10,605 million in its December 2025 Budget Update11127. The Parliament of Victoria's Public Accounts and Estimates Committee attributes the revision to an expected downturn in Victoria's property market11.
Compared with their previous budgets, the 2026-27 stamp duty forecasts are higher in Victoria, Queensland, Western Australia, South Australia, Tasmania and the Northern Territory131415134567121617. Western Australia's transfer duty forecast for 2026-27 increased by $875 million, to $3,637 million514, and Queensland's by $719 million, to $8,346 million615.
Queensland Treasury attributes the upward revision to its tax revenue since its 2025-26 mid-year review mainly to higher-than-expected dwelling prices and more large property transactions in 2025-266.
All eight state and territory budgets were finalised before the Reserve Bank of Australia increased the cash rate target on 29 September 2026. The budgets were published in May and June 2026.
Western Australia recorded transfer duty of $4,221 million in 2025-26, $81 million below the estimate in its 2026-27 budget, according to its 2025-26 Annual Report on State Finances18. The report attributes a $157 million shortfall in total duty on transfers partly to weaker-than-expected property market conditions, particularly in the June quarter.
Victoria recorded land transfer duty of $10,776 million in 2025-26, $175 million above the revised estimate in its 2026-27 budget, according to its 2025-26 Financial Report19.
| Changes in stamp duty and land tax forecasts by state and territory, 2025-26 to 2026-27 budgets ($ million) | |||||||
|---|---|---|---|---|---|---|---|
| State or territory | Previous budget | Stamp duty, previous budget | Stamp duty, 2026-27 budget | Change ($m) | Land tax, previous budget | Land tax, 2026-27 budget | Change ($m) |
| New South Wales | June 2025 | 14,026 | 12,598 | −1,428 | 9,343 | 8,969 | −374 |
| Victoria | May 2025 | 9,993 | 10,009 | +16 | 6,630 | 6,456 | −174 |
| Queensland | June 2025 | 7,627 | 8,346 | +719 | 3,260 | 3,162 | −98 |
| Western Australia | June 2025 | 2,762 | 3,637 | +875 | 1,020 | 1,295 | +275 |
| South Australia | June 2025 | 1,684 | 1,834 | +150 | 675 | 732 | +57 |
| Tasmania | November 2025 | 479.4 | 518.5 | +39.1 | 203.1 | 203.6 | +0.5 |
| Australian Capital Territory | June 2025 | 380.0 | 373.0 | −6.9 | 250.0 | 253.7 | +3.7 |
| Northern Territory | May 2025 | 126 | 144 | +18 | No land tax | ||
Source · 2025-26 and 2026-27 state and territory budget papers.
Section 03 · Revenue by state
Stamp duty and land tax revenue by state and territory, 1999-00 to 2029-30
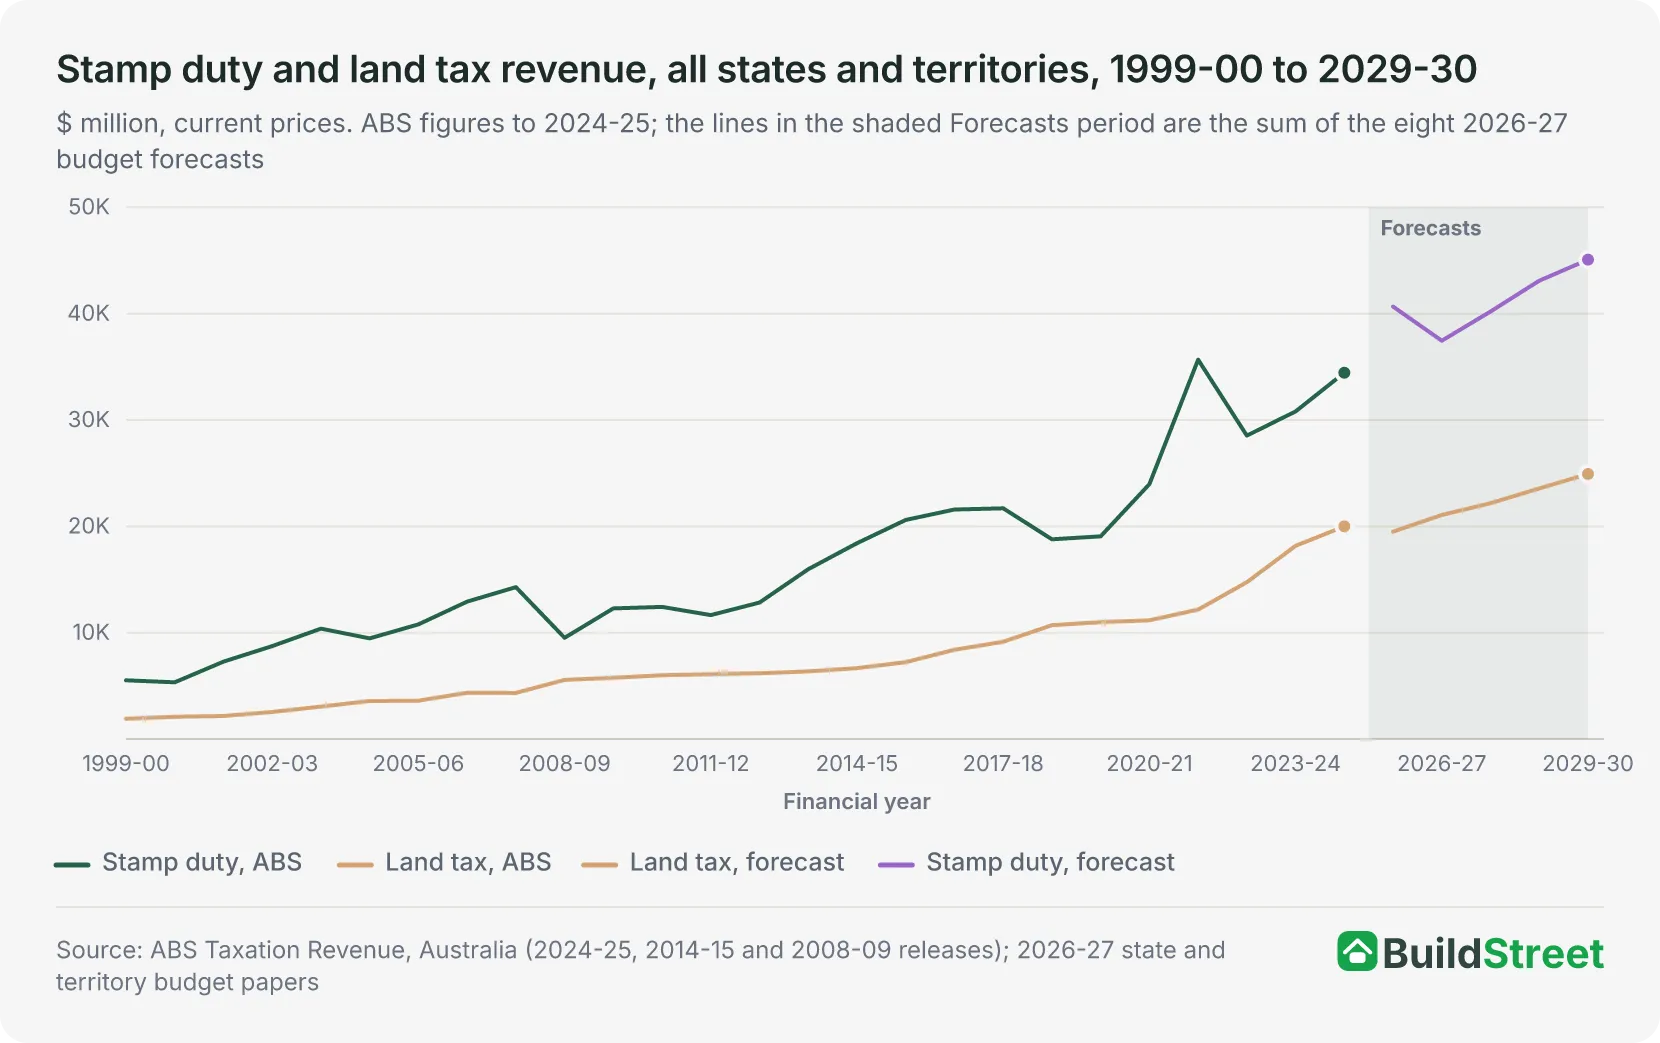
Stamp duty revenue across the states and territories increased from $5.5 billion in 1999-0020 to $34.4 billion in 2024-25, according to ABS Taxation Revenue data21. Land tax revenue increased from $1.9 billion to $20.0 billion over the same period20.
Land tax accounted for a larger share of the combined revenue from both taxes in 2024-25 than in 1999-00. Its share rose by 11.0 percentage points, from 25.7 per cent in 1999-00 to 36.7 per cent in 2024-252120.
The eight state and territory budgets forecast stamp duty revenue of $45.1 billion in 2029-30, while the seven that levy land tax forecast $24.9 billion12345678.
The budget forecasts use each government's own definitions, so in some states and territories the forecasts are not directly comparable with the historical ABS figures. Victoria's ABS land tax of $7,246 million in 2024-2521 includes $1,132 million from the COVID Debt Levy, which its budget reports separately19.
South Australia's ABS land tax includes land tax on public land, which its budget forecasts separately, at $289 million in 2026-274.
- Stamp duty forecast, 2029-30
- $15,164m
- Land tax forecast, 2029-30
- $9,762m
- Stamp duty forecast, 2029-30
- $12,404m
- Land tax forecast, 2029-30
- $7,475m
- Stamp duty forecast, 2029-30
- $10,152m
- Land tax forecast, 2029-30
- $4,826m
- Stamp duty forecast, 2029-30
- $4,220m
- Land tax forecast, 2029-30
- $1,544m
- Stamp duty forecast, 2029-30
- $1,987m
- Land tax forecast, 2029-30
- $801m
- Stamp duty forecast, 2029-30
- $606.2m
- Land tax forecast, 2029-30
- $225.7m
- Stamp duty forecast, 2029-30
- $394.3m
- Land tax forecast, 2029-30
- $295.6m
- Stamp duty forecast, 2029-30
- $151m
- Land tax forecast, 2029-30
- m
| Financial year | Basis | Stamp duty ($m) | Land tax ($m) |
|---|---|---|---|
| 1999-00 | ABS | 5,531 | 1,917 |
| 2000-01 | ABS | 5,341 | 2,103 |
| 2001-02 | ABS | 7,284 | 2,172 |
| 2002-03 | ABS | 8,744 | 2,553 |
| 2003-04 | ABS | 10,387 | 3,059 |
| 2004-05 | ABS | 9,471 | 3,584 |
| 2005-06 | ABS | 10,788 | 3,613 |
| 2006-07 | ABS | 12,926 | 4,357 |
| 2007-08 | ABS | 14,289 | 4,346 |
| 2008-09 | ABS | 9,527 | 5,566 |
| 2009-10 | ABS | 12,292 | 5,768 |
| 2010-11 | ABS | 12,431 | 6,006 |
| 2011-12 | ABS | 11,659 | 6,103 |
| 2012-13 | ABS | 12,841 | 6,193 |
| 2013-14 | ABS | 15,976 | 6,364 |
| 2014-15 | ABS | 18,420 | 6,674 |
| 2015-16 | ABS | 20,607 | 7,237 |
| 2016-17 | ABS | 21,586 | 8,400 |
| 2017-18 | ABS | 21,700 | 9,153 |
| 2018-19 | ABS | 18,785 | 10,713 |
| 2019-20 | ABS | 19,065 | 10,998 |
| 2020-21 | ABS | 23,971 | 11,170 |
| 2021-22 | ABS | 35,674 | 12,179 |
| 2022-23 | ABS | 28,535 | 14,753 |
| 2023-24 | ABS | 30,811 | 18,172 |
| 2024-25 | ABS | 34,448 | 20,002 |
| 2025-26 | Budget estimate | 40,662.6 | 19,507 |
| 2026-27 | Budget forecast | 37,459.5 | 21,071.3 |
| 2027-28 | Budget forecast | 40,203.8 | 22,182.4 |
| 2028-29 | Budget forecast | 43,099.3 | 23,567.8 |
| 2029-30 | Budget forecast | 45,078.5 | 24,929.3 |
Source · ABS figures to 2024-25 are state and territory government revenue in current prices. The 2025-26 figures are each budget's estimate and 2026-27 to 2029-30 its forecasts, on each budget's own definitions. The forecasts for all states and territories are the sum of the eight budgets. ABS Taxation Revenue, Australia, 2024-25, 2014-15 and 2008-09 releases; 2026-27 state and territory budget papers.
| Financial year | Basis | Stamp duty ($m) | Land tax ($m) |
|---|---|---|---|
| 1999-00 | ABS | 2,406 | 900 |
| 2000-01 | ABS | 2,267 | 929 |
| 2001-02 | ABS | 3,119 | 1,001 |
| 2002-03 | ABS | 3,677 | 1,136 |
| 2003-04 | ABS | 3,918 | 1,355 |
| 2004-05 | ABS | 3,282 | 1,646 |
| 2005-06 | ABS | 3,237 | 1,717 |
| 2006-07 | ABS | 4,166 | 2,036 |
| 2007-08 | ABS | 3,938 | 1,937 |
| 2008-09 | ABS | 2,736 | 2,252 |
| 2009-10 | ABS | 3,739 | 2,296 |
| 2010-11 | ABS | 4,045 | 2,289 |
| 2011-12 | ABS | 3,764 | 2,350 |
| 2012-13 | ABS | 4,568 | 2,333 |
| 2013-14 | ABS | 6,045 | 2,335 |
| 2014-15 | ABS | 7,388 | 2,467 |
| 2015-16 | ABS | 8,367 | 2,747 |
| 2016-17 | ABS | 8,968 | 3,171 |
| 2017-18 | ABS | 8,664 | 3,720 |
| 2018-19 | ABS | 6,875 | 4,209 |
| 2019-20 | ABS | 6,955 | 4,453 |
| 2020-21 | ABS | 9,608 | 4,874 |
| 2021-22 | ABS | 13,534 | 4,834 |
| 2022-23 | ABS | 9,712 | 5,961 |
| 2023-24 | ABS | 11,415 | 7,077 |
| 2024-25 | ABS | 12,224 | 8,251 |
| 2025-26 | Budget estimate | 14,263 | 8,462 |
| 2026-27 | Budget forecast | 12,598 | 8,969 |
| 2027-28 | Budget forecast | 13,604 | 9,225 |
| 2028-29 | Budget forecast | 14,802 | 9,483 |
| 2029-30 | Budget forecast | 15,164 | 9,762 |
Source · The New South Wales figures are transfer duty and land tax as published. Land tax in the budget was $8,270 million in 2024-25, compared with $8,251 million in ABS data. The 2025-26 figures are estimates made at budget time. ABS Taxation Revenue, Australia, 2024-25, 2014-15 and 2008-09 releases; New South Wales 2026-27 budget, Budget Paper No. 1, Table 4.4.
| Financial year | Basis | Stamp duty ($m) | Land tax ($m) |
|---|---|---|---|
| 1999-00 | ABS | 1,294 | 411 |
| 2000-01 | ABS | 1,284 | 525 |
| 2001-02 | ABS | 1,885 | 515 |
| 2002-03 | ABS | 2,116 | 655 |
| 2003-04 | ABS | 2,446 | 837 |
| 2004-05 | ABS | 2,337 | 848 |
| 2005-06 | ABS | 2,671 | 780 |
| 2006-07 | ABS | 2,961 | 989 |
| 2007-08 | ABS | 3,706 | 865 |
| 2008-09 | ABS | 2,801 | 1,238 |
| 2009-10 | ABS | 3,604 | 1,178 |
| 2010-11 | ABS | 3,910 | 1,398 |
| 2011-12 | ABS | 3,379 | 1,401 |
| 2012-13 | ABS | 3,332 | 1,589 |
| 2013-14 | ABS | 4,261 | 1,659 |
| 2014-15 | ABS | 5,067 | 1,753 |
| 2015-16 | ABS | 6,008 | 1,771 |
| 2016-17 | ABS | 6,350 | 2,501 |
| 2017-18 | ABS | 7,197 | 2,586 |
| 2018-19 | ABS | 6,292 | 3,509 |
| 2019-20 | ABS | 6,387 | 3,447 |
| 2020-21 | ABS | 6,622 | 3,234 |
| 2021-22 | ABS | 10,722 | 4,135 |
| 2022-23 | ABS | 8,998 | 5,367 |
| 2023-24 | ABS | 8,682 | 7,094 |
| 2024-25 | ABS | 9,433 | 7,246 |
| 2025-26 | Budget estimate | 10,601 | 6,258 |
| 2026-27 | Budget forecast | 10,009 | 6,456 |
| 2027-28 | Budget forecast | 11,002 | 6,651 |
| 2028-29 | Budget forecast | 11,743 | 7,039 |
| 2029-30 | Budget forecast | 12,404 | 7,475 |
Source · ABS land taxes for Victoria include the COVID Debt Levy, which the budget reports separately, at $1,170 million in 2025-26 and $1,197 million in 2026-27. The land tax forecasts therefore start below the ABS figures. The 2025-26 figures are estimates made at budget time. ABS Taxation Revenue, Australia, 2024-25, 2014-15 and 2008-09 releases; Victoria 2026-27 budget, Budget Paper No. 5, Table 4.2.
| Financial year | Basis | Stamp duty ($m) | Land tax ($m) |
|---|---|---|---|
| 1999-00 | ABS | 767 | 220 |
| 2000-01 | ABS | 700 | 230 |
| 2001-02 | ABS | 1,056 | 231 |
| 2002-03 | ABS | 1,382 | 279 |
| 2003-04 | ABS | 1,863 | 313 |
| 2004-05 | ABS | 1,728 | 419 |
| 2005-06 | ABS | 1,949 | 404 |
| 2006-07 | ABS | 2,542 | 485 |
| 2007-08 | ABS | 2,912 | 610 |
| 2008-09 | ABS | 1,806 | 838 |
| 2009-10 | ABS | 1,978 | 1,033 |
| 2010-11 | ABS | 1,933 | 1,042 |
| 2011-12 | ABS | 2,023 | 1,013 |
| 2012-13 | ABS | 1,887 | 990 |
| 2013-14 | ABS | 2,403 | 986 |
| 2014-15 | ABS | 2,698 | 977 |
| 2015-16 | ABS | 3,005 | 1,010 |
| 2016-17 | ABS | 3,278 | 1,082 |
| 2017-18 | ABS | 3,023 | 1,180 |
| 2018-19 | ABS | 3,195 | 1,334 |
| 2019-20 | ABS | 3,041 | 1,406 |
| 2020-21 | ABS | 3,954 | 1,524 |
| 2021-22 | ABS | 6,336 | 1,633 |
| 2022-23 | ABS | 5,240 | 1,732 |
| 2023-24 | ABS | 5,492 | 2,026 |
| 2024-25 | ABS | 6,918 | 2,353 |
| 2025-26 | Budget estimate | 8,671 | 2,690 |
| 2026-27 | Budget forecast | 8,346 | 3,162 |
| 2027-28 | Budget forecast | 8,946 | 3,715 |
| 2028-29 | Budget forecast | 9,553 | 4,322 |
| 2029-30 | Budget forecast | 10,152 | 4,826 |
Source · The Queensland figures are transfer duty and land tax as published, and the budget figures for 2024-25 match the ABS figures. The 2025-26 figures are estimates made at budget time. ABS Taxation Revenue, Australia, 2024-25, 2014-15 and 2008-09 releases; Queensland 2026-27 budget, Budget Paper No. 2, Table 3.2.
| Financial year | Basis | Stamp duty ($m) | Land tax ($m) |
|---|---|---|---|
| 1999-00 | ABS | 585 | 195 |
| 2000-01 | ABS | 624 | 221 |
| 2001-02 | ABS | 647 | 226 |
| 2002-03 | ABS | 833 | 260 |
| 2003-04 | ABS | 1,207 | 280 |
| 2004-05 | ABS | 1,218 | 315 |
| 2005-06 | ABS | 1,907 | 313 |
| 2006-07 | ABS | 2,040 | 386 |
| 2007-08 | ABS | 2,243 | 415 |
| 2008-09 | ABS | 1,008 | 562 |
| 2009-10 | ABS | 1,615 | 519 |
| 2010-11 | ABS | 1,240 | 516 |
| 2011-12 | ABS | 1,342 | 548 |
| 2012-13 | ABS | 1,785 | 559 |
| 2013-14 | ABS | 1,955 | 654 |
| 2014-15 | ABS | 1,686 | 738 |
| 2015-16 | ABS | 1,743 | 941 |
| 2016-17 | ABS | 1,497 | 867 |
| 2017-18 | ABS | 1,448 | 833 |
| 2018-19 | ABS | 1,097 | 799 |
| 2019-20 | ABS | 1,300 | 784 |
| 2020-21 | ABS | 2,090 | 749 |
| 2021-22 | ABS | 2,621 | 749 |
| 2022-23 | ABS | 2,448 | 779 |
| 2023-24 | ABS | 2,919 | 837 |
| 2024-25 | ABS | 3,378 | 893 |
| 2025-26 | Budget estimate | 4,302 | 988 |
| 2026-27 | Budget forecast | 3,637 | 1,295 |
| 2027-28 | Budget forecast | 3,691 | 1,359 |
| 2028-29 | Budget forecast | 3,954 | 1,448 |
| 2029-30 | Budget forecast | 4,220 | 1,544 |
Source · The Western Australian forecast is transfer duty only. ABS stamp duty for Western Australia also includes landholder duty and the foreign buyers surcharge, which the budget forecasts separately, at $283 million and $30 million in 2026-27. The 2025-26 figures are estimates made at budget time. ABS Taxation Revenue, Australia, 2024-25, 2014-15 and 2008-09 releases; Western Australia 2026-27 budget, Budget Paper No. 3, Appendix 2, Table 2.1.
| Financial year | Basis | Stamp duty ($m) | Land tax ($m) |
|---|---|---|---|
| 1999-00 | ABS | 313 | 133 |
| 2000-01 | ABS | 295 | 140 |
| 2001-02 | ABS | 354 | 140 |
| 2002-03 | ABS | 428 | 157 |
| 2003-04 | ABS | 578 | 198 |
| 2004-05 | ABS | 561 | 256 |
| 2005-06 | ABS | 600 | 291 |
| 2006-07 | ABS | 721 | 332 |
| 2007-08 | ABS | 909 | 375 |
| 2008-09 | ABS | 721 | 510 |
| 2009-10 | ABS | 784 | 553 |
| 2010-11 | ABS | 784 | 576 |
| 2011-12 | ABS | 683 | 588 |
| 2012-13 | ABS | 773 | 562 |
| 2013-14 | ABS | 789 | 565 |
| 2014-15 | ABS | 907 | 559 |
| 2015-16 | ABS | 868 | 570 |
| 2016-17 | ABS | 843 | 573 |
| 2017-18 | ABS | 814 | 595 |
| 2018-19 | ABS | 750 | 617 |
| 2019-20 | ABS | 801 | 640 |
| 2020-21 | ABS | 1,012 | 510 |
| 2021-22 | ABS | 1,352 | 533 |
| 2022-23 | ABS | 1,210 | 575 |
| 2023-24 | ABS | 1,432 | 746 |
| 2024-25 | ABS | 1,609 | 829 |
| 2025-26 | Budget estimate | 1,784 | 664 |
| 2026-27 | Budget forecast | 1,834 | 732 |
| 2027-28 | Budget forecast | 1,876 | 755 |
| 2028-29 | Budget forecast | 1,930 | 777 |
| 2029-30 | Budget forecast | 1,987 | 801 |
Source · The South Australian land tax forecast covers private land only. ABS land taxes for South Australia also include land tax on public land, which the budget forecasts separately, at $289 million in 2026-27. The 2025-26 figures are estimates made at budget time. ABS Taxation Revenue, Australia, 2024-25, 2014-15 and 2008-09 releases; South Australia 2026-27 budget, Budget Statement, Table 3.3.
| Financial year | Basis | Stamp duty ($m) | Land tax ($m) |
|---|---|---|---|
| 1999-00 | ABS | 49 | 27 |
| 2000-01 | ABS | 56 | 26 |
| 2001-02 | ABS | 71 | 26 |
| 2002-03 | ABS | 91 | 25 |
| 2003-04 | ABS | 123 | 27 |
| 2004-05 | ABS | 131 | 44 |
| 2005-06 | ABS | 141 | 49 |
| 2006-07 | ABS | 157 | 62 |
| 2007-08 | ABS | 197 | 71 |
| 2008-09 | ABS | 151 | 80 |
| 2009-10 | ABS | 163 | 91 |
| 2010-11 | ABS | 145 | 75 |
| 2011-12 | ABS | 136 | 88 |
| 2012-13 | ABS | 139 | 89 |
| 2013-14 | ABS | 154 | 86 |
| 2014-15 | ABS | 193 | 84 |
| 2015-16 | ABS | 216 | 97 |
| 2016-17 | ABS | 231 | 100 |
| 2017-18 | ABS | 255 | 105 |
| 2018-19 | ABS | 249 | 108 |
| 2019-20 | ABS | 314 | 125 |
| 2020-21 | ABS | 348 | 130 |
| 2021-22 | ABS | 410 | 137 |
| 2022-23 | ABS | 364 | 155 |
| 2023-24 | ABS | 374 | 186 |
| 2024-25 | ABS | 364 | 198 |
| 2025-26 | Budget estimate | 437.2 | 203.4 |
| 2026-27 | Budget forecast | 518.5 | 203.6 |
| 2027-28 | Budget forecast | 562.2 | 210.7 |
| 2028-29 | Budget forecast | 583.8 | 218.1 |
| 2029-30 | Budget forecast | 606.2 | 225.7 |
Source · The Tasmanian figures are conveyance duty and land tax as published. The 2025-26 figures are estimates made at budget time. ABS Taxation Revenue, Australia, 2024-25, 2014-15 and 2008-09 releases; Tasmania 2026-27 budget, Budget Paper No. 1, Table 6.5.
| Financial year | Basis | Stamp duty ($m) | Land tax ($m) |
|---|---|---|---|
| 1999-00 | ABS | 83 | 31 |
| 2000-01 | ABS | 87 | 32 |
| 2001-02 | ABS | 117 | 33 |
| 2002-03 | ABS | 174 | 41 |
| 2003-04 | ABS | 188 | 49 |
| 2004-05 | ABS | 141 | 56 |
| 2005-06 | ABS | 170 | 59 |
| 2006-07 | ABS | 232 | 67 |
| 2007-08 | ABS | 272 | 73 |
| 2008-09 | ABS | 196 | 86 |
| 2009-10 | ABS | 283 | 98 |
| 2010-11 | ABS | 272 | 110 |
| 2011-12 | ABS | 239 | 115 |
| 2012-13 | ABS | 231 | 71 |
| 2013-14 | ABS | 227 | 79 |
| 2014-15 | ABS | 216 | 96 |
| 2015-16 | ABS | 286 | 101 |
| 2016-17 | ABS | 316 | 106 |
| 2017-18 | ABS | 225 | 134 |
| 2018-19 | ABS | 248 | 137 |
| 2019-20 | ABS | 197 | 143 |
| 2020-21 | ABS | 246 | 149 |
| 2021-22 | ABS | 446 | 158 |
| 2022-23 | ABS | 392 | 184 |
| 2023-24 | ABS | 331 | 206 |
| 2024-25 | ABS | 330 | 232 |
| 2025-26 | Budget estimate | 359.4 | 241.6 |
| 2026-27 | Budget forecast | 373 | 253.7 |
| 2027-28 | Budget forecast | 375.6 | 266.7 |
| 2028-29 | Budget forecast | 384.5 | 280.7 |
| 2029-30 | Budget forecast | 394.3 | 295.6 |
Source · The ACT stamp duty forecast is the sum of residential and commercial conveyances. General rates, which replace conveyance duty under the ACT tax reform, are not included. The 2025-26 figures are estimates made at budget time. ABS Taxation Revenue, Australia, 2024-25, 2014-15 and 2008-09 releases; Australian Capital Territory 2026-27 budget, Budget Outlook, Table 3.5.2.
| Financial year | Basis | Stamp duty ($m) |
|---|---|---|
| 1999-00 | ABS | 34 |
| 2000-01 | ABS | 28 |
| 2001-02 | ABS | 35 |
| 2002-03 | ABS | 43 |
| 2003-04 | ABS | 64 |
| 2004-05 | ABS | 73 |
| 2005-06 | ABS | 113 |
| 2006-07 | ABS | 107 |
| 2007-08 | ABS | 112 |
| 2008-09 | ABS | 108 |
| 2009-10 | ABS | 126 |
| 2010-11 | ABS | 102 |
| 2011-12 | ABS | 93 |
| 2012-13 | ABS | 126 |
| 2013-14 | ABS | 142 |
| 2014-15 | ABS | 265 |
| 2015-16 | ABS | 114 |
| 2016-17 | ABS | 103 |
| 2017-18 | ABS | 74 |
| 2018-19 | ABS | 79 |
| 2019-20 | ABS | 70 |
| 2020-21 | ABS | 91 |
| 2021-22 | ABS | 253 |
| 2022-23 | ABS | 171 |
| 2023-24 | ABS | 166 |
| 2024-25 | ABS | 192 |
| 2025-26 | Budget estimate | 245 |
| 2026-27 | Budget forecast | 144 |
| 2027-28 | Budget forecast | 147 |
| 2028-29 | Budget forecast | 149 |
| 2029-30 | Budget forecast | 151 |
Source · The Northern Territory levies no land tax. The forecast is the taxes on property line, which covers conveyance and related duty. The 2014-15 figure includes a very large one-off stamp duty payment, according to the Territory's Department of Treasury and Finance. The 2025-26 figures are estimates made at budget time. ABS Taxation Revenue, Australia, 2024-25, 2014-15 and 2008-09 releases; Northern Territory 2026-27 budget, Budget Paper No. 2, Table 6.1; NT Department of Treasury and Finance Annual Report 2016-17.
Section 04 · Past downturns
How does the forecast stamp duty fall compare with past downturns?
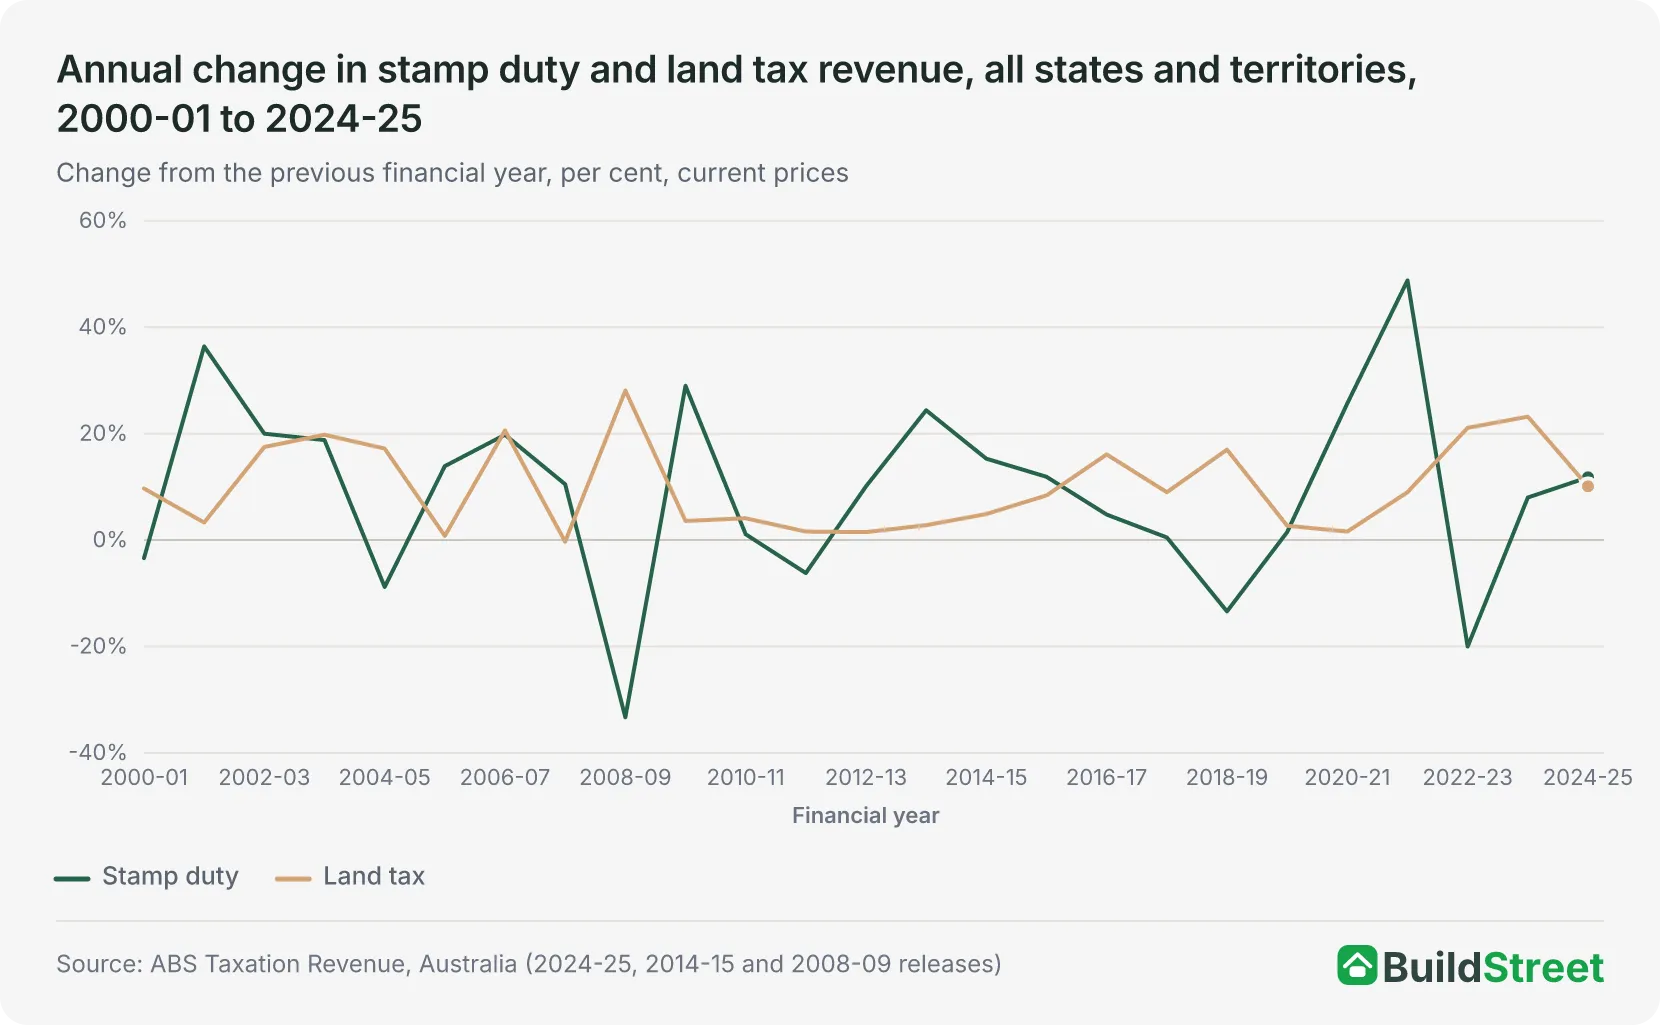
The combined 7.9 per cent fall in stamp duty revenue forecast in the eight budgets for 2026-27 is smaller than four of the six annual falls in ABS figures from 2000-01 to 2024-25232022. The two smaller falls were 3.4 per cent in 2000-0120 and 6.2 per cent in 2011-1223. The budget forecasts and the ABS figures use different definitions, so the comparison is approximate.
Stamp duty revenue recorded its largest annual fall from 2000-01 to 2024-25 in 2008-09, at 33.3 per cent, from $14,289 million in 2007-08 to $9,527 million in 2008-0923.
Western Australia recorded the largest percentage fall in stamp duty revenue of any state or territory in 2008-09, at 55.1 per cent, while revenue fell 38.0 per cent in Queensland and 30.5 per cent in New South Wales23.
Stamp duty revenue did not exceed its 2007-08 level of $14,289 million again until 2013-14, when it reached $15,976 million23.
Stamp duty revenue last fell in 2022-23, by 20.0 per cent, from $35,674 million in 2021-22 to $28,535 million in 2022-2321. That fall followed an increase of 48.8 per cent in 2021-22. Revenue in 2024-25, at $34,448 million, was still below its 2021-22 level in current prices.
| Years in which stamp duty revenue fell, all states and territories, 1999-00 to 2024-25 | |||
|---|---|---|---|
| Financial year | Previous year ($m) | Year ($m) | Change |
| 2000-01 | 5,531 | 5,341 | −3.4% |
| 2004-05 | 10,387 | 9,471 | −8.8% |
| 2008-09 | 14,289 | 9,527 | −33.3% |
| 2011-12 | 12,431 | 11,659 | −6.2% |
| 2018-19 | 21,700 | 18,785 | −13.4% |
| 2022-23 | 35,674 | 28,535 | −20.0% |
Source · ABS Taxation Revenue, Australia, 2024-25, 2014-15 and 2008-09 releases.
Section 05 · Land tax
Why is land tax revenue more stable than stamp duty?
Land tax revenue across the states and territories fell in only one year from 1999-00 to 2024-25, by 0.3 per cent in 2007-08, while stamp duty revenue fell in six years212023.
Annual changes in stamp duty revenue ranged from a fall of 33.3 per cent in 2008-0923 to an increase of 48.8 per cent in 2021-2221. Annual changes in land tax revenue ranged from a fall of 0.3 per cent in 2007-08 to an increase of 28.1 per cent in 2008-092322.
The ABS defines land taxes as taxes on the ownership of land, based on the assessed value of the land24. Stamp duty is charged when property is transferred, including real estate, businesses and other property25. The e61 Institute, an Australian economic research organisation, describes stamp duty as more likely to fluctuate because revenue depends on the number of property sales and their prices26.
South Australia estimates that residential land values will increase by around 16 per cent for its 2026-27 land tax assessments, and assumes annual growth of around 3 per cent from 2027-284. Queensland's land tax is forecast to increase by 17.5 per cent in 2026-27 and 11.7 per cent in 2029-306.
Land tax rates, thresholds and exemptions in each state and territory are set out in Land tax in Australia: rates, thresholds and exemptions by state and territory.
Section 06 · Risks
What could cause stamp duty and land tax revenue to fall below forecasts?
If property sales or prices are weaker than the budgets assume, transfer duty revenue would fall short of the forecasts, according to the sensitivity estimates in the New South Wales and Queensland budgets68.
The New South Wales budget estimates that a one percentage point increase in residential property sales would add $98 million to transfer duty revenue in 2026-27, while the same increase in average prices would add $122 million8.
Queensland estimates that a one percentage point change in either the average value or the number of property transactions would change transfer duty revenue by about $85 million in 2026-276.
Home sales over the three months to September 2026 were 19.1 per cent lower than a year earlier across Australia, according to Cotality estimates published after all eight budgets27. The national Home Value Index fell 1.1 per cent in September 2026 and 3.7 per cent over the September quarter.
The Reserve Bank of Australia increased the cash rate target by 0.25 percentage points to 4.60 per cent on 29 September 2026, its fourth increase in 202628.
The New South Wales forecasts assume that the property market will recover from the second half of 2027, following expected interest rate reductions8. The ACT's budget identifies changes to property tax arrangements announced in the 2026-27 federal budget as a potential risk to its land tax revenue forecast2.
In May 2026, the federal government announced that it would limit negative gearing for residential property investments to newly built dwellings from 1 July 2027, with properties held before the announcement exempt29.
Victoria's Public Accounts and Estimates Committee found in August 2026 that the change may reduce property prices over the following two years11. NSW Treasury describes the effect of the federal changes as small compared with recent changes in monetary policy8.
Section 07 · Reform
What are Australia's plans to replace stamp duty with land tax?
The Organisation for Economic Co-operation and Development (OECD) recommended replacing state stamp duty with ongoing land taxes in its 2026 Economic Survey of Australia, arguing that the change would bring property taxation more closely into line with taxes on other assets30.
The Grattan Institute's March 2026 submission to the Senate Select Committee on Productivity in Australia described replacing state stamp duties with general property taxes as the biggest tax reform prize in Australia31. It also recommended that the federal government encourage the states and territories to make the change.
The ACT began phasing out conveyance duty in 2012-13, with the aim of replacing the revenue through general rates over 20 years32. In 2026-27, the ACT forecasts general rates of $944.2 million and residential and commercial conveyance duty of $373.0 million2.
New South Wales offered first-home buyers a choice between transfer duty and an annual property tax from 16 January to 30 June 202333. The annual tax was set at $400 plus 0.3 per cent of land value for owner-occupiers. The scheme closed to new applications on 1 July 2023.
Victoria began replacing stamp duty on commercial and industrial property with an annual commercial and industrial property tax from 1 July 202434. Under the reform, an eligible property generally attracts stamp duty one final time when it is next sold. The annual tax of 1 per cent of unimproved land value then applies 10 years after that sale.
The history of stamp duty thresholds and the debate over land tax is covered in How stamp duty has changed in Australia: bracket creep and the land tax debate.
Section 08
Frequently asked questions
Is stamp duty revenue forecast to fall in Australia?
Stamp duty revenue is forecast to fall by 7.9 per cent in 2026-27, from the $40.7 billion estimated for 2025-26 to $37.5 billion, according to the eight 2026-27 state and territory budgets. Revenue is then expected to increase each year from 2027-28 to 2029-30. These forecasts were prepared before the September 2026 interest rate increase.
How much land tax do the states and territories collect?
The states and territories collected $20.0 billion in land tax in 2024-25, according to ABS data, and the seven that levy it forecast $21.1 billion in 2026-27 using their own budget definitions. The Northern Territory does not levy land tax.
Which state collects the most stamp duty?
New South Wales recorded the highest stamp duty revenue of any state or territory in 2024-25, at $12,224 million according to ABS data. Its 2026-27 budget forecasts transfer duty revenue of $12,598 million in 2026-27.
When did stamp duty revenue last fall?
Stamp duty revenue across the states and territories last fell in 2022-23, by 20.0 per cent to $28,535 million, according to ABS data. The largest annual fall between 2000-01 and 2024-25 was 33.3 per cent in 2008-09.
Why do state and territory budget figures differ from ABS stamp duty and land tax figures?
Each state and territory budget reports stamp duty and land tax using its own definitions, which can differ from the ABS categories. For example, Western Australia's transfer duty forecast excludes landholder duty, and South Australia's land tax forecast covers private land only.
References
- Northern Territory Budget 2026-27, Budget Paper No. 2, Fiscal Outlook · budget.nt.gov.au ↑ b c d e
- ACT Budget 2026-27, Budget Outlook · treasury.act.gov.au ↑ b c d e f g
- Tasmanian Budget 2026-27, Budget Paper No. 1, Budget Strategy and Estimates · treasury.tas.gov.au ↑ b c d e f g
- South Australian Budget 2026-27, Budget Statement · treasury.sa.gov.au ↑ b c d e f g
- Western Australia State Budget 2026-27, Budget Paper No. 3, Economic and Fiscal Outlook · ourstatebudget.wa.gov.au ↑ b c d e f g
- Queensland Budget 2026-27, Budget Paper No. 2, Budget Strategy and Outlook · budget.qld.gov.au ↑ b c d e f g h i
- Victorian Budget 2026-27, Budget Paper No. 5, Statement of Finances · s3.ap-southeast-2.amazonaws.com ↑ b c d e
- NSW Budget 2026-27, Budget Paper No. 1, Budget Statement · nsw.gov.au ↑ b c d e f g h i j k l
- NSW Budget 2025-26, Budget Paper No. 1, Budget Statement · nsw.gov.au ↑
- ACT 2025-26 Budget Outlook · treasury.act.gov.au ↑
- Parliament of Victoria, Public Accounts and Estimates Committee, Report on the 2026–27 Budget Estimates · parliament.vic.gov.au ↑ b c
- Victorian Budget 2025-26, Budget Paper No. 5, Statement of Finances · s3.ap-southeast-2.amazonaws.com ↑ b
- Tasmania, The Budget, Budget Paper No. 1, 2025-26 · treasury.tas.gov.au ↑
- Western Australia 2025-26 Budget, Budget Paper No. 3, Economic and Fiscal Outlook · ourstatebudget.wa.gov.au ↑ b
- Queensland Budget 2025-26, Budget Paper No. 2, Budget Strategy and Outlook · treasury.qld.gov.au ↑ b
- South Australia, State Budget 2025-26, Budget Statement (Budget Paper 3) · treasury.sa.gov.au ↑
- Northern Territory 2025-26 Budget, Budget Paper No. 2, Budget Strategy and Outlook · budget.nt.gov.au ↑
- Western Australia, 2025-26 Annual Report on State Finances · wa.gov.au ↑
- Victoria, 2025-26 Financial Report (incorporating Quarterly Financial Report No. 4) · dtf.vic.gov.au ↑ b
- ABS, Taxation Revenue, Australia, 2008-09 (cat. 5506.0) · Australian Bureau of Statistics ↑ b c d e f
- ABS, Taxation Revenue, Australia, 2024–25, data cube 55060DO001 · Australian Bureau of Statistics ↑ b c d e f g
- ABS, Taxation Revenue, Australia, 2024-25 · Australian Bureau of Statistics ↑ b c
- ABS, Taxation Revenue, Australia, 2014-15 (cat. 5506.0) · Australian Bureau of Statistics ↑ b c d e f g h i
- ABS, Australian System of Government Finance Statistics: Concepts, Sources and Methods, Appendix 1, Taxes on property (Land taxes, TC 311) · Australian Bureau of Statistics ↑
- ABS, Australian System of Government Finance Statistics: Concepts, Sources and Methods, Appendix 1, Taxes on provision of goods and services (Stamp duties on conveyances, TC 463) · Australian Bureau of Statistics ↑
- e61 Institute, NSW state budget preview: the property tax canary in the coal mine · e61.in ↑
- Cotality, Home Value Index, October 2026 · discover.cotality.com ↑
- Reserve Bank of Australia, Monetary Policy Decision, Media Release 2026-27 · Reserve Bank of Australia ↑
- Australian Government, Budget 2026–27 factsheet: Negative Gearing and Capital Gains Tax Reform · budget.gov.au ↑
- OECD Economic Surveys: Australia 2026 · oecd.org ↑
- Grattan Institute, A productivity agenda for Australia: submission to the Senate Select Committee on Productivity · grattan.edu.au ↑
- ACT Treasury, Budget 2016-17 fact sheet: Taxation reform (general rates) · treasury.act.gov.au ↑
- Revenue NSW, First Home Buyer Choice · revenue.nsw.gov.au ↑
- Department of Treasury and Finance, Victoria, Commercial and Industrial Property Tax Reform information sheet · dtf.vic.gov.au ↑
- Northern Territory Department of Treasury and Finance, Annual Report 2016-17 · treasury.nt.gov.au
