


Published 30 Sept 2026
 What stamp duty costs in every stateCurrent stamp duty rates and thresholds in each state and territory, with worked amounts at four purchase prices and the concessions for first home buyers.
 Land tax in Australia explainedHow land tax is charged, the thresholds and rates in each state and territory, and the principal place of residence exemption.
Section 01 · Thresholds
How have stamp duty thresholds changed over time in Australia?
New South Wales did not change its transfer duty brackets from 1986 until 1 July 2019, apart from an additional duty on residential property valued over $3 million introduced in 2004, according to the NSW Budget Statement 2019-201. Since 1 July 2019, the thresholds have been indexed each year to the Sydney Consumer Price Index.
Under the scale in force before 1 July 2019, the $4.50 rate for every $100 applied to the value between $300,000 and $1 million, and the $5.50 rate applied to the value over $1 million2. For agreements from 1 July 2026, the same two rates start at $387,000 and $1,290,000, respectively, which are 29 per cent higher than the 1986 thresholds3. The rates, from $1.25 to $5.50 for every $100, are the same in both scales.
A Victorian Legislative Council committee found in August 2023 that indexing stamp duty rates could minimise bracket creep, and recommended that the Department of Treasury and Finance regularly review the rates to adjust for it4.
| New South Wales transfer duty thresholds before and after indexation, 1986 scale to 2026-27 | |||
|---|---|---|---|
| Rate for every $100 | Before 1 July 2019 | From 1 July 2019 | From 1 July 2026 |
| $1.25 | $0 to $14,000 | $0 to $14,000 | $0 to $18,000 |
| $1.50 | $14,001 to $30,000 | $14,001 to $30,000 | $18,001 to $38,000 |
| $1.75 | $30,001 to $80,000 | $30,001 to $81,000 | $38,001 to $103,000 |
| $3.50 | $80,001 to $300,000 | $81,001 to $304,000 | $103,001 to $387,000 |
| $4.50 | $300,001 to $1,000,000 | $304,001 to $1,013,000 | $387,001 to $1,290,000 |
| $5.50 | Over $1,000,000 | Over $1,013,000 | Over $1,290,000 |
Source · Revenue NSW, Past thresholds and rates for transfer duty; Revenue NSW, How to calculate transfer duty.
Section 02 · Bracket creep
How does bracket creep increase the stamp duty home buyers pay?
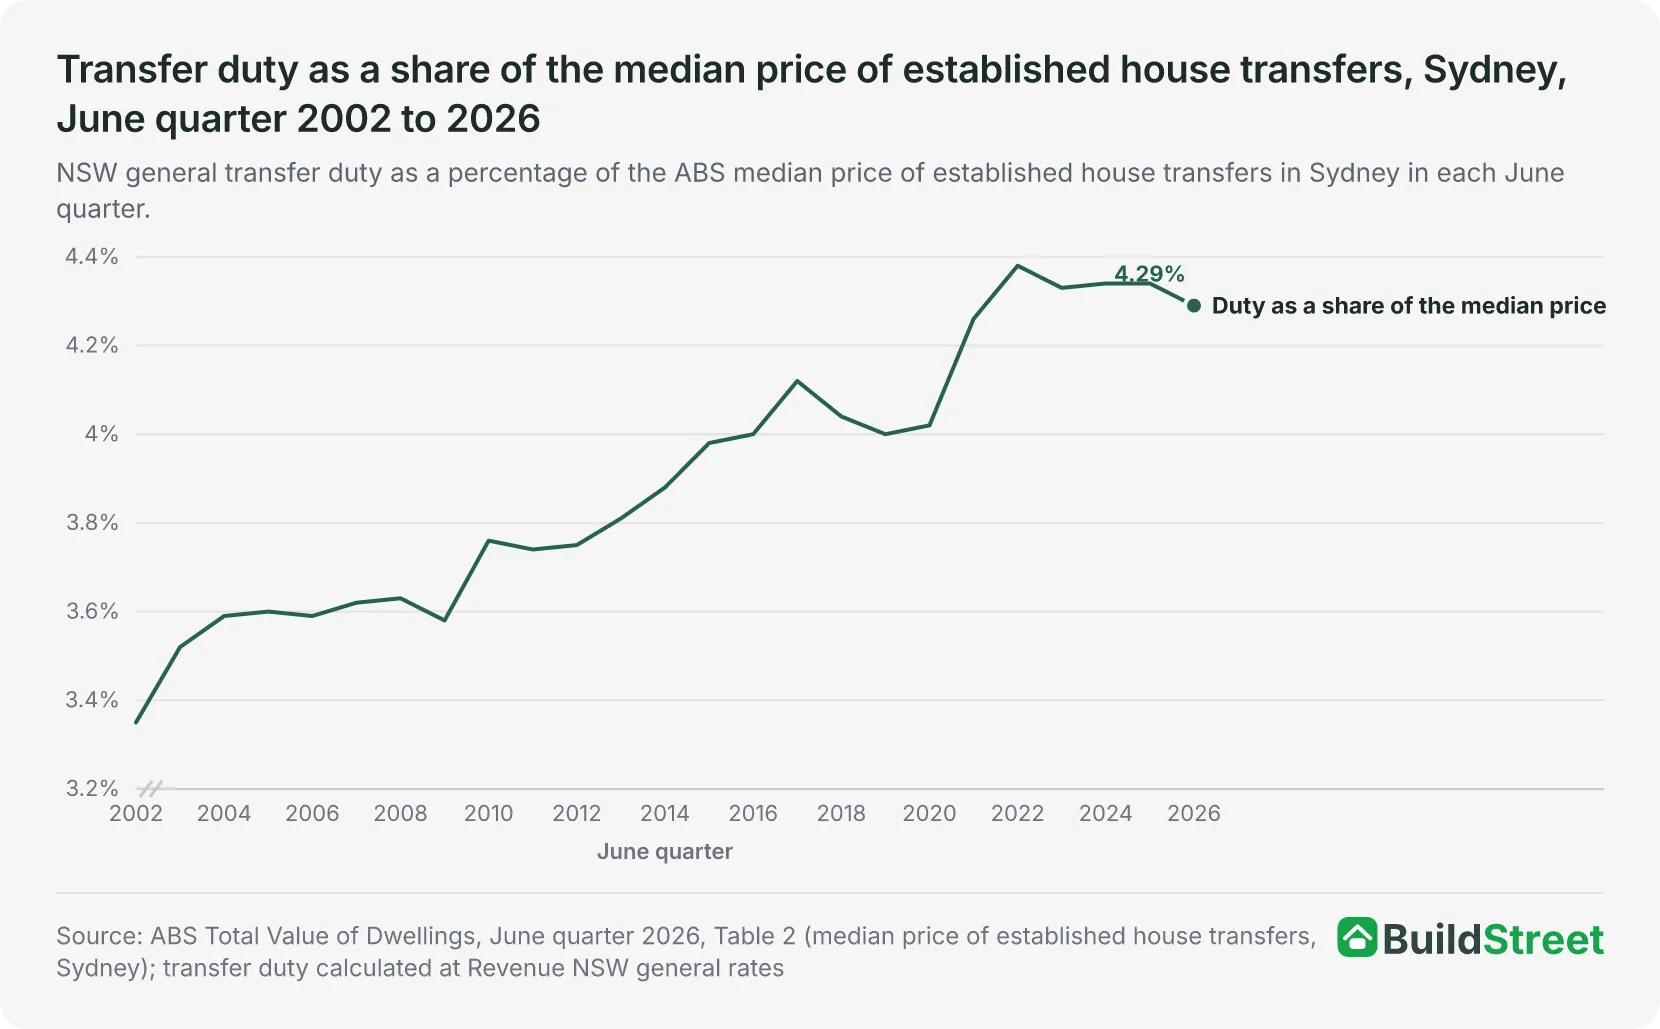
Transfer duty on the median price of established house transfers in Sydney increased from $13,197 in the June quarter of 2002 to $63,830 in the June quarter of 2026, calculated at New South Wales general rates52. Over the same period, the median price rose from $393,500 to $1,487,6005.
Bracket creep occurs when duty thresholds stay fixed while prices rise, so a growing part of each purchase price falls above the thresholds and is charged at higher marginal rates. The Victorian committee found that bracket creep had made stamp duty a much larger cost than originally intended4.
The Sydney median price was 3.8 times its June quarter 2002 level in the June quarter of 2026, while the duty on it was 4.8 times its 2002 level. In 2002, the median of $393,500 sat in the 4.5 per cent bracket of the 1986 scale. In the June quarter of 2017, the median of $1,050,000 was above the $1 million threshold for the 5.5 per cent rate, and it was above the indexed threshold for that rate in every June quarter from 2021 to 202652.
The ABS median for the June quarter of 2026 is preliminary and subject to revision5.
Section 03 · Share of price
How has stamp duty changed as a share of the median house price?
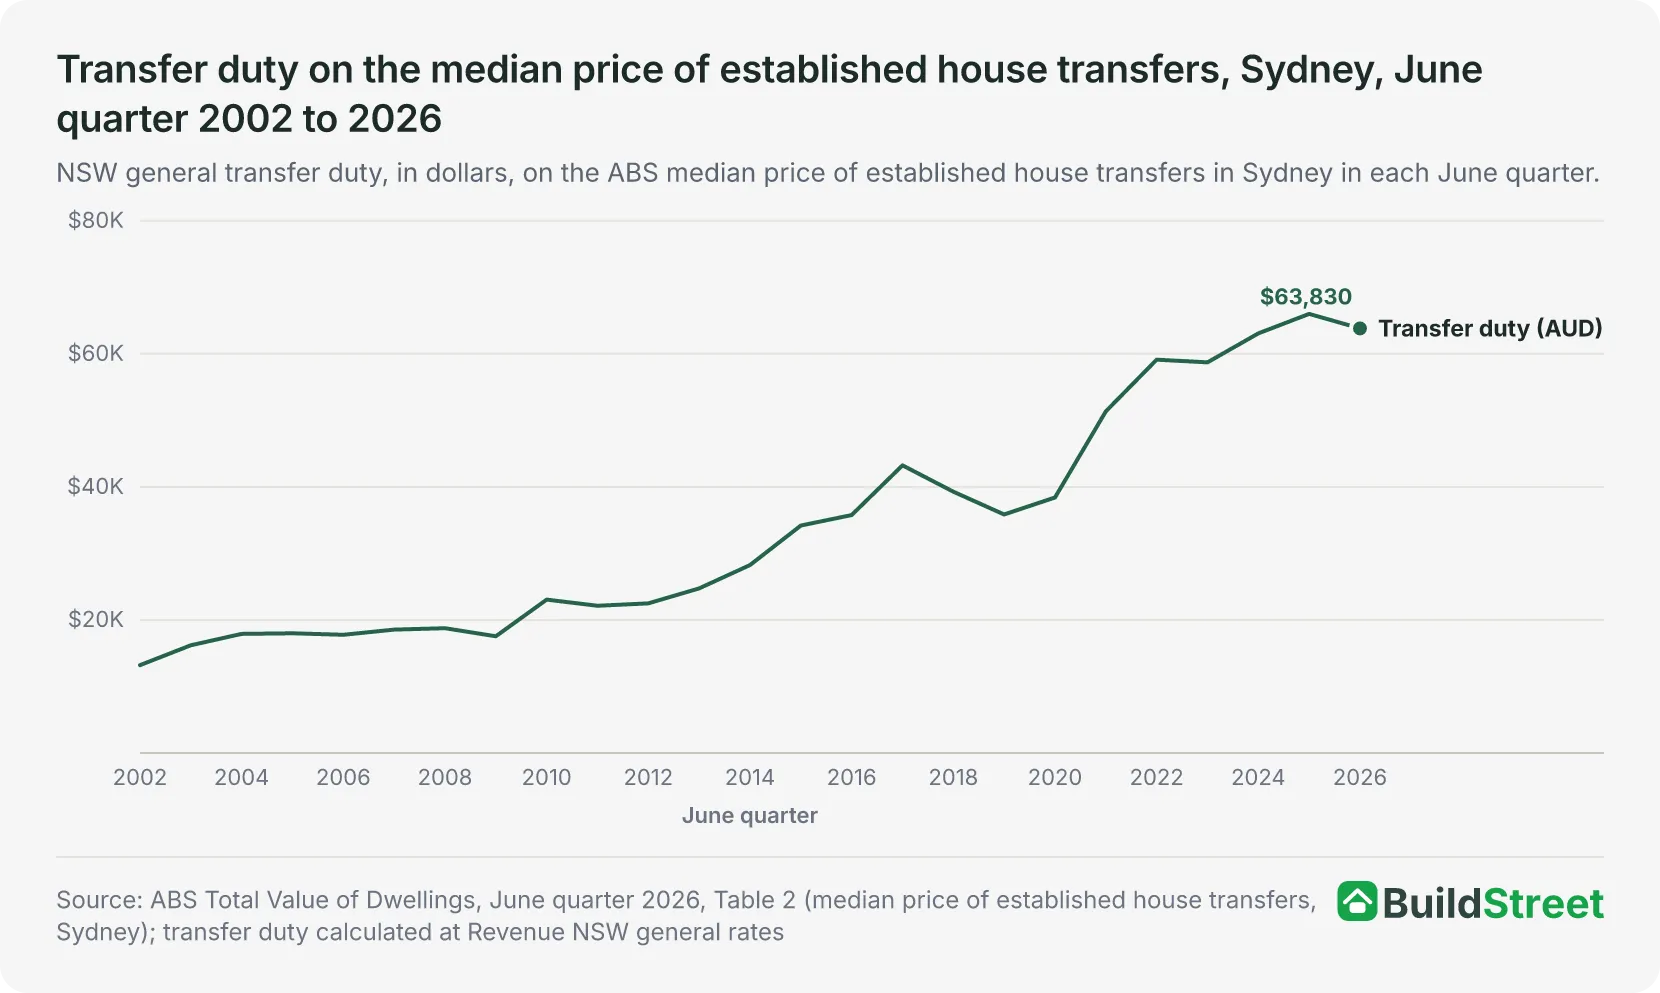
Transfer duty was equal to 4.29 per cent of the median price of established house transfers in Sydney in the June quarter of 2026, compared with 3.35 per cent in the June quarter of 2002, at New South Wales general rates5.
The share was above 4 per cent in every June quarter from 2020 to 2026. The June quarter of 2022 recorded the highest share among the June quarters from 2002 to 2026, at 4.38 per cent5.
In Victoria, the Parliamentary Budget Office estimated that land transfer duty on the Melbourne median house price of around $390,000 in 2008 was $18,470, an effective rate of 4.7 per cent4. It estimated duty on the 2022 median of around $930,000 at $50,870, or 5.5 per cent, assuming no surcharge or concession.
What stamp duty costs at $500,000, $750,000, $1 million and $1.5 million in each state and territory is set out in the article on stamp duty costs in every Australian state.
| Stamp duty on the median house price, Sydney and Melbourne, selected years | |||
|---|---|---|---|
| City and period | Median house price | Duty at general rates | Duty as % of price |
| Sydney, June quarter 2002 | $393,500 | $13,197 | 3.35% |
| Sydney, June quarter 2019 | $897,000 | $35,855 | 4.00% |
| Sydney, June quarter 2026 | $1,487,600 | $63,830 | 4.29% |
| Melbourne, 2008 | about $390,000 | $18,470 | 4.7% |
| Melbourne, 2022 | about $930,000 | $50,870 | 5.5% |
Source · ABS Total Value of Dwellings, June quarter 2026, Table 2; Revenue NSW; Parliament of Victoria, Inquiry into land transfer duty fees.
Section 04 · Revenue
How much stamp duty revenue do states and territories collect each year?
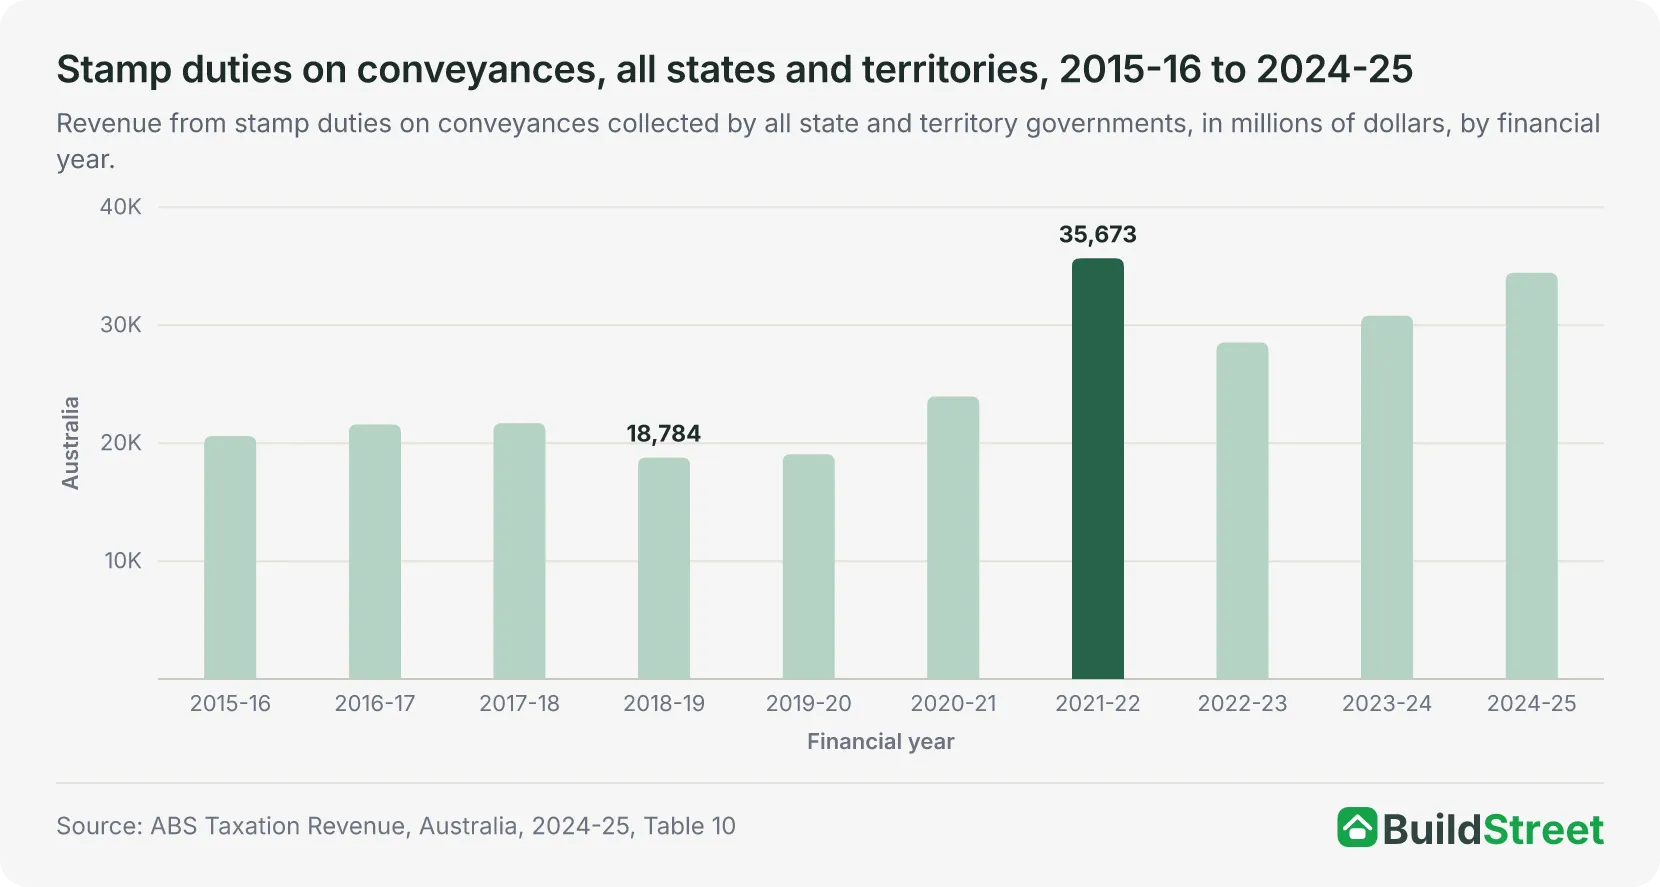
States and territories collected $34.4 billion in stamp duties on conveyances in 2024-25, up from $30.8 billion in 2023-24, according to the ABS taxation revenue data6. The total was equal to 24.5 per cent of the $140.7 billion in taxation revenue collected by state governments in 2024-25.
Conveyance duty revenue rose and fell over the ten years from 2015-16. It was $20.6 billion in 2015-16, fell to $18.8 billion in 2018-19, rose to $35.7 billion in 2021-22 and fell to $28.5 billion in 2022-236.
New South Wales recorded the highest conveyance duty revenue of any state or territory in 2024-25, at $12.2 billion, followed by Victoria, at $9.4 billion, and Queensland, at $6.9 billion6.
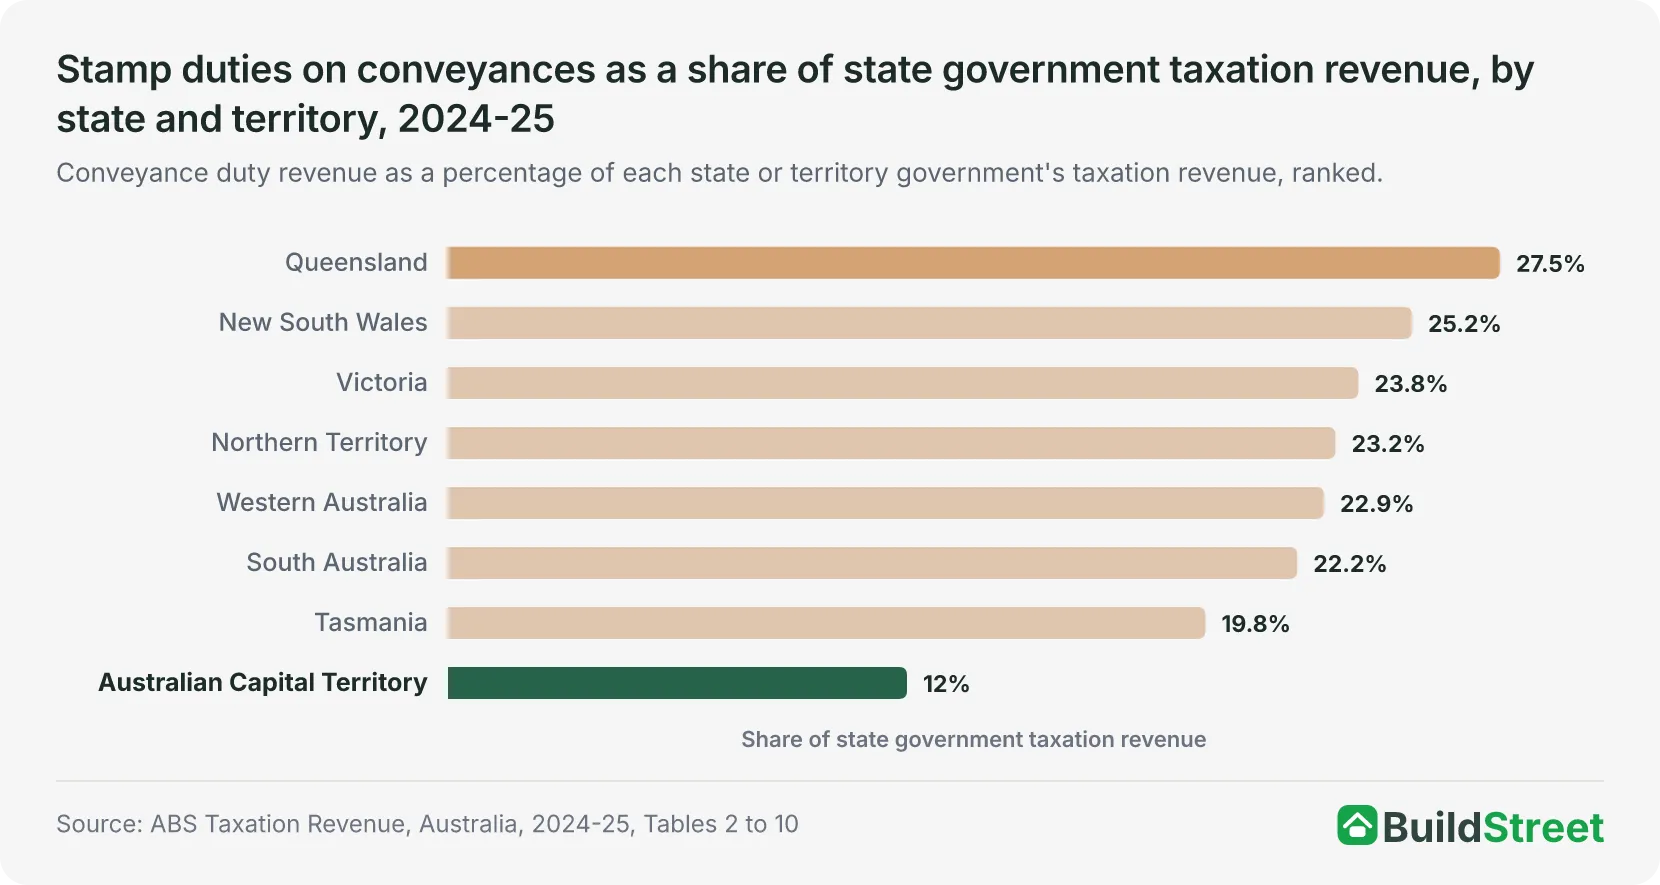
Queensland recorded the highest share of state government taxation revenue from conveyance duty among the states and territories in 2024-25, at 27.5 per cent6. The Australian Capital Territory recorded the lowest share, at 12.0 per cent.
| Stamp duties on conveyances by state and territory, 2015-16 and 2024-25 | ||||
|---|---|---|---|---|
| State or territory | Conveyance duty 2015-16 ($m) | Conveyance duty 2024-25 ($m) | State government taxation 2024-25 ($m) | Conveyance duty share 2024-25 |
| New South Wales | 8,367 | 12,224 | 48,441 | 25.2% |
| Victoria | 6,008 | 9,433 | 39,642 | 23.8% |
| Queensland | 3,005 | 6,918 | 25,178 | 27.5% |
| South Australia | 868 | 1,609 | 7,241 | 22.2% |
| Western Australia | 1,743 | 3,378 | 14,739 | 22.9% |
| Tasmania | 216 | 364 | 1,843 | 19.8% |
| Northern Territory | 114 | 192 | 826 | 23.2% |
| Australian Capital Territory | 286 | 330 | 2,754 | 12.0% |
| All states and territories | 20,607 | 34,447 | 140,664 | 24.5% |
Source · ABS Taxation Revenue, Australia, 2024-25, Tables 2 to 10 and taxation revenue by jurisdiction.
Section 05 · The debate
What are the arguments in the stamp duty versus land tax debate?
Australia's Future Tax System review, known as the Henry Review, recommended in its 2010 final report that stamp duties, including conveyancing stamp duties, be removed through a switch to more efficient taxes, such as those on broad consumption or land bases7. Supporters and critics of that switch have set out their positions in state inquiries and reviews since.
Three arguments are made for replacing stamp duty:
- Stamp duty discourages people from moving house for work or to downsize, a finding of the Victorian committee in 20234.
- Stamp duty is paid only by the share of the community that buys property in a given year, and its revenue depends on the property market, according to the ACT Revenue Office, which describes rates as a broad-based land tax and a stable source of revenue8.
- Stamp duty's economic cost is high, according to Australian Treasury modelling reported by the Productivity Commission in 2017. The modelling estimated that each additional dollar of stamp duty reduced household living standards by 72 cents in the long run9.
Four concerns are raised about a switch:
- Recent buyers could pay both stamp duty and a new land tax during a gradual transition, which the Victorian committee described as a risk of double taxation4.
- The Victorian Farmers Federation told the committee it had strong reservations about a broad-based land tax on farmland4.
- The Productivity Commission identified cash-flow concerns for low-income retirees living in high-value family homes, and pointed to deferring payment until sale as one option10.
- Consultation in New South Wales raised concerns about unpredictable tax bills and a temporary fall in government revenue during a transition4.
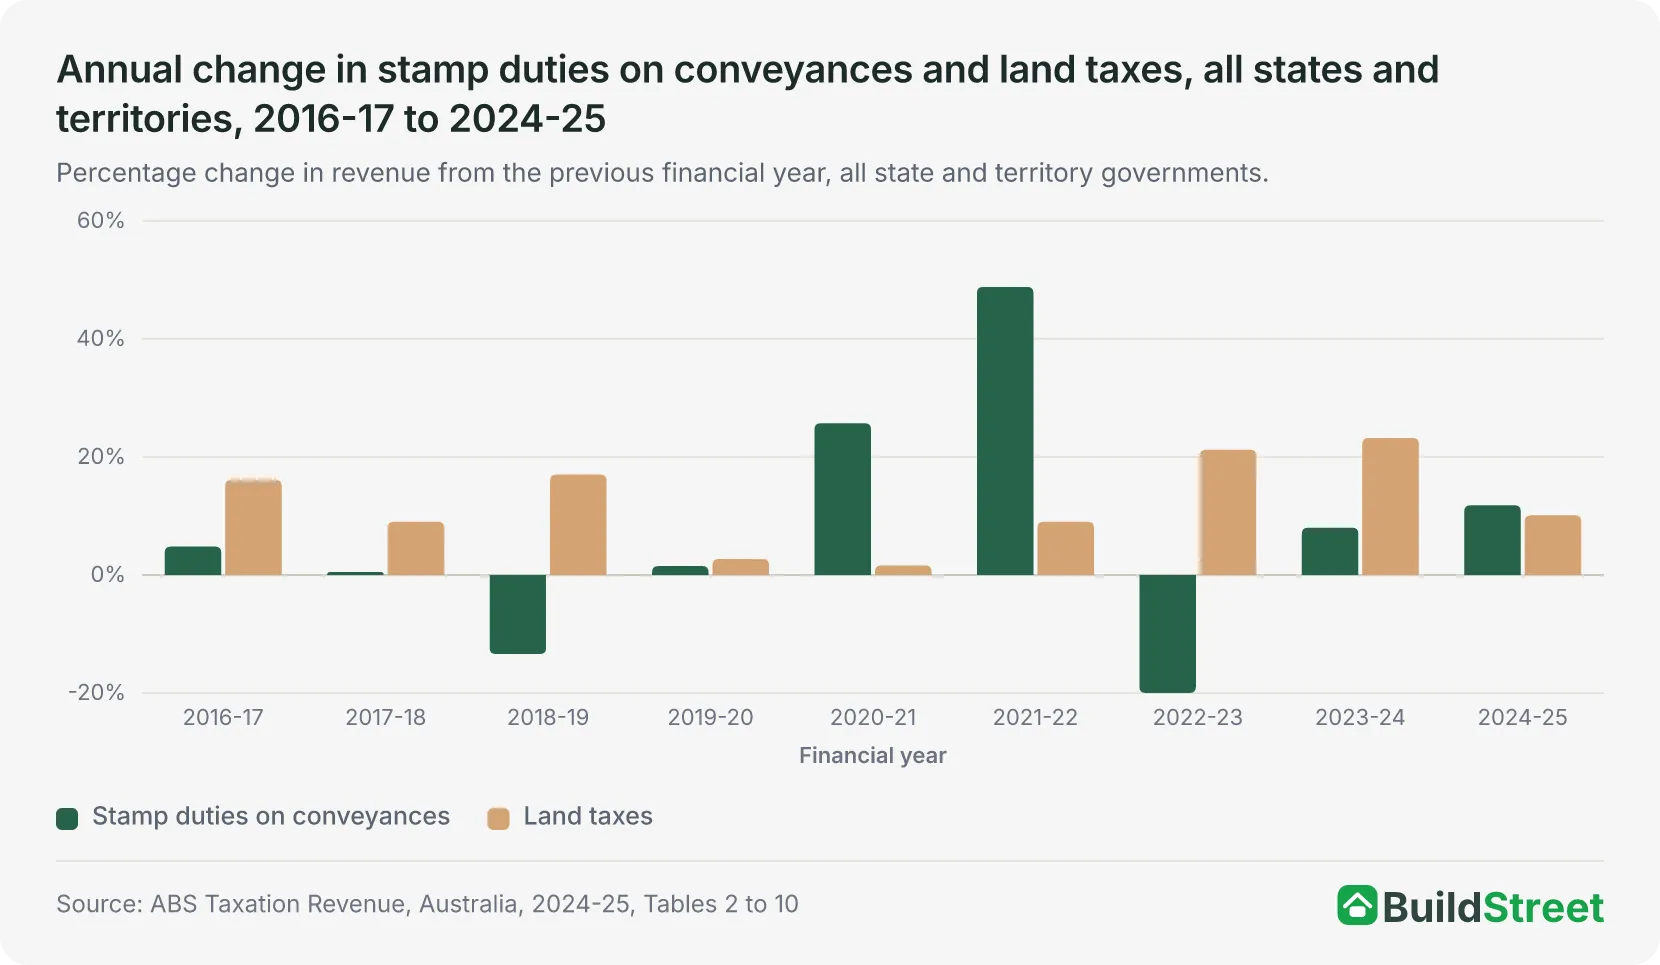
Across all states and territories, land tax revenue increased in every year from 2016-17 to 2024-25, rising from $7.2 billion in 2015-16 to $20.0 billion in 2024-256. Over the same period, conveyance duty revenue fell by 13.4 per cent in 2018-19 and by 20.0 per cent in 2022-23.
How land tax works in each state and territory, and who pays it, is covered in the article on land tax in Australia.
Section 06 · Reforms
Where have Australian governments started replacing stamp duty with an annual tax?
The Australian Capital Territory began a 20-year program in 2012 to abolish conveyance duty and replace the revenue through general rates8. According to ACT Treasury, the purchaser of a $500,000 property in 2020-21 paid $9,100, or 44 per cent, less duty than before the reform began11. Duty on commercial property transactions of $1.5 million or less was abolished from 1 July 20188.
ACT Treasury's review of the first seven years found the program broadly revenue neutral, with cumulative general rates revenue up $793 million and $855 million of stamp duty and insurance duty revenue forgone11. ACT municipal rates revenue rose from $423 million in 2015-16 to $812 million in 2024-25, while conveyance duty revenue was $286 million and $330 million in those years6.
In New South Wales, first home buyers could choose between transfer duty and an annual property tax from 16 January 2023 to 30 June 2023, on homes valued at up to $1.5 million and vacant land valued at up to $800,00012. For an owner-occupied home, the annual tax was $400 plus 0.3 per cent of land value in 2022-23 and 2023-244.
The option closed from 1 July 2023, when the first home buyer duty exemption threshold for homes rose from $650,000 to $800,000. Buyers who opted in continue to pay the property tax for as long as they own that property13.
In Victoria, a commercial or industrial property enters a 10-year transition to the commercial and industrial property tax after an eligible transaction, such as a dutiable sale, on or after 1 July 2024. The tax is generally 1 per cent of site value a year, and later transactions in that property may be exempt from duty14.
| Stamp duty replacement measures in Australia, 2012 to 2026 | |||
|---|---|---|---|
| Jurisdiction | Measure | Start | Status |
| ACT | Conveyance duty phased down over 20 years, revenue replaced through general rates | 2012 | In progress |
| ACT | Duty abolished on commercial transactions of $1.5 million or less | 1 July 2018 | In force |
| New South Wales | First Home Buyer Choice: annual property tax instead of transfer duty for eligible first home buyers | 16 January 2023 | Closed to new purchases from 1 July 2023 |
| Victoria | Commercial and industrial property tax of generally 1% of site value after a 10-year transition | 1 July 2024 | In force |
Source · ACT Revenue Office; Revenue NSW; State Revenue Office Victoria.
Section 07 · Mobility
What does the evidence show about stamp duty and housing mobility?
The Productivity Commission reported in 2017 that one Australian study found a 10 per cent increase in stamp duty lowered housing turnover by 3 per cent in the first year, and by 6 per cent if sustained over three years9.
The Commission also cited a study from the United Kingdom, where an 8 per cent increase in property transactions followed a 16-month suspension of stamp duty on lower-value transactions9.
The Reserve Bank of Australia reported in 2017 that the rate of housing turnover had trended lower since the early 2000s, partly because households were moving less often and fewer owned their homes15. The same article noted that Australian data had not shown strong evidence that transaction costs reduced household mobility.
The Grattan Institute described rising stamp duty rates as a likely material factor in national housing turnover falling from 8 per cent a year in the early 2000s to below 5 per cent16. It also noted that an ageing population and lower interstate migration could have reduced turnover.
For older Australians, the Productivity Commission found in 2015 that stamp duty is a potential impediment to moving out of the family home, but that surveys indicate it is a relatively minor factor compared with the supply of suitable housing and a strong preference to avoid moving10.
The ACT Treasury's analysis of the territory's reform found that residential property turnover increased following the duty cuts11.
Section 08
Frequently asked questions
What is stamp duty bracket creep?
Stamp duty bracket creep is the increase in the share of a purchase price paid as duty when prices rise but duty thresholds stay fixed, so more of each price is charged at higher rates. At New South Wales general rates, duty on the median Sydney established house price rose from 3.35 per cent of the price in the June quarter of 2002 to 4.29 per cent in the June quarter of 2026.
Are NSW stamp duty thresholds indexed to inflation?
New South Wales transfer duty thresholds have been indexed each year to the Sydney Consumer Price Index since 1 July 20191. Before that date, apart from an additional duty on residential property valued at more than $3 million introduced in 2004, the brackets had not changed since 1986.
How much stamp duty do Australian states collect?
States and territories collected $34.4 billion in stamp duties on conveyances in 2024-25, according to the Australian Bureau of Statistics17. That was equal to 24.5 per cent of state government taxation revenue, ranging from 12.0 per cent in the Australian Capital Territory to 27.5 per cent in Queensland6.
Which Australian governments have started replacing stamp duty?
The Australian Capital Territory began a 20-year program in 2012 to phase out conveyance duty and replace the revenue through general rates8. New South Wales let first home buyers choose an annual property tax instead of transfer duty from 16 January 2023 to 30 June 202312, and Victoria began moving commercial and industrial property to an annual tax from 1 July 202414.
Does stamp duty stop people from moving house?
Research suggests stamp duty can reduce housing turnover, although the evidence is mixed. One Australian study reported by the Productivity Commission found that a 10 per cent increase in stamp duty lowered housing turnover by 3 per cent in the first year and 6 per cent over three years9. The Reserve Bank of Australia noted in 2017 that Australian data had not shown strong evidence that transaction costs reduced household mobility15.
References
- NSW Budget Statement 2019-20, Budget Paper No. 1 · budget.nsw.gov.au ↑ b
- Revenue NSW — Transfer Duty Past Thresholds and Rates · revenue.nsw.gov.au ↑ b c
- Revenue NSW — Calculate Transfer Duty · revenue.nsw.gov.au ↑ b
- Parliament of Victoria, Inquiry into land transfer duty fees (final report, August 2023) · parliament.vic.gov.au ↑ b c d e f g h i j
- ABS Total Value of Dwellings, June quarter 2026 (Cat. 6432.0), Table 1 · Australian Bureau of Statistics ↑ b c d e f
- ABS, Taxation Revenue, Australia, 2024-25 · Australian Bureau of Statistics ↑ b c d e f g
- Australia's Future Tax System, Final Report, Part 1 (Henry Review) · treasury.gov.au ↑
- ACT Revenue Office, Tax reform · revenue.act.gov.au ↑ b c d
- Productivity Commission, Realising the Productive Potential of Land (Shifting the Dial, Supporting Paper No. 10) · assets.pc.gov.au ↑ b c d
- Productivity Commission, Housing Decisions of Older Australians (Commission Research Paper, December 2015) · assets.pc.gov.au ↑ b
- ACT Treasury, Tax Reform · treasury.act.gov.au ↑ b c
- Revenue NSW, First Home Buyer Choice · revenue.nsw.gov.au ↑ b
- Revenue NSW, Support for first home buyers is changing · revenue.nsw.gov.au ↑
- State Revenue Office Victoria, Understanding commercial and industrial property tax · sro.vic.gov.au ↑ b
- Reserve Bank of Australia, Housing Market Turnover (RBA Bulletin, March quarter 2017) · Reserve Bank of Australia ↑ b
- Grattan Institute, NSW should swap stamp duties for a broad-based property tax (submission, December 2019) · grattan.edu.au ↑ b
- ABS, Taxation Revenue, Australia, 2024–25, data cube 55060DO001 · Australian Bureau of Statistics ↑
