

Published 26 June 2026 · Updated 29 Sept 2026
Greater Adelaide added 18,647 residents in 2024–251, while South Australia approved 14,526 dwellings over the same period. Building approvals remained elevated through to July 2026, but completions were more uneven, rising to 3,977 in the December quarter of 2025 before easing to 3,081 in the March quarter of 2026. Adelaide's rental vacancy rate was 0.6% in August 2026, placing it among the tightest capital city rental markets. Annual advertised rent growth eased to 3.4%, below the national average and behind every capital except Canberra. Playford accounted for almost one in six dwelling approvals across South Australia, while water and sewerage capacity constraints affecting major northern release areas are now being addressed.
 Australia’s 1.2 million homes target: progress, funding, and who is responsibleAustralia is behind the straight-line pace needed to build 1.2 million new homes by June 2029. The target requires an average of 60,000 completions per quarter over five years. Over the first six quar…
 Can Victoria meet its housing target? Approvals, completions and supply gapsVictoria completed 56,383 dwellings in 2024–25, the lowest annual total in a decade and about 4,800 below the 61,200 a year needed to meet its Housing Accord share. Since the Accord began in July 2024…
Section 01 · Where Adelaide is growing
Where are new homes being approved in Adelaide?
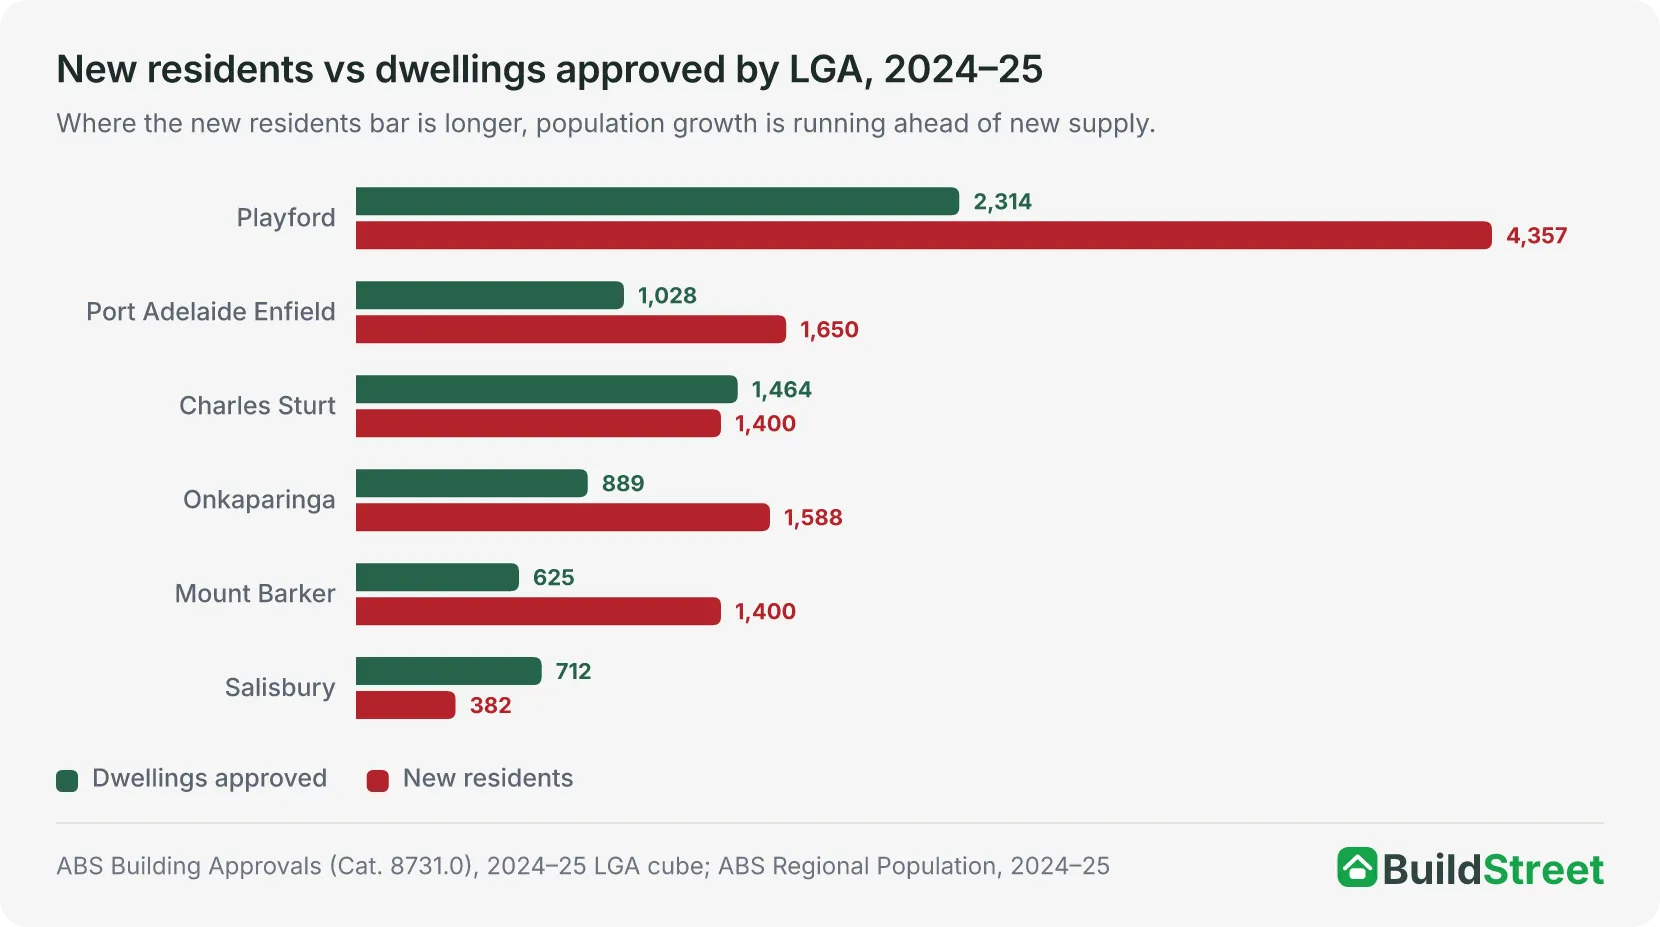
Playford approved 2,314 dwellings in 2024–25, the highest total of any local government area in South Australia and equivalent to 15.9% of all dwelling approvals in the state. The LGA also added 4,357 residents over the same period, growing by 3.9%, the fastest rate of any South Australian council area2. New approvals across Greater Adelaide remain concentrated in a small number of outer-fringe and middle-ring locations.
Salisbury, one of the state's larger established council areas with about 151,000 residents, approved 712 dwellings while adding 382 residents. Charles Sturt recorded a different approval mix, with 919 apartments and townhouses compared with 539 houses, making it the strongest inner-ring example of medium-density approval activity in this dataset.
| LGA | New residents 2024–25 | Dwellings approved | New houses | Other residential |
|---|---|---|---|---|
| Playford | 4,357 | 2,314 | 2,125 | 180 |
| Port Adelaide Enfield | 1,650 | 1,028 | 773 | 250 |
| Charles Sturt | 1,400 | 1,464 | 539 | 919 |
| Onkaparinga | 1,588 | 889 | 647 | 235 |
| Mount Barker | 1,400 | 625 | 586 | 36 |
| Salisbury | 382 | 712 | 554 | 153 |
| Marion | 1,220 | 767 | 344 | 420 |
| Tea Tree Gully | 530 | 531 | 388 | 142 |
| SA total | 20,501 | 14,526 | 10,404 | 4,017 |
| Note: LGA-level completion data is not publicly available from the ABS. Approvals are used as the closest available proxy for local housing delivery activity. | ||||
Source · ABS Building Approvals (Cat. 8731.0), LGA data cube 87310DO016 for 2024–25, June 2026 release; ABS Regional Population, 2024–25. SA total new residents covers the whole state; Greater Adelaide growth was 18,647. New houses and other residential approvals do not sum to total approvals because conversion dwellings are recorded separately.
| LGA | New houses | Other residential | Total dwellings |
|---|---|---|---|
| Playford | 1,980 | 255 | 2,241 |
| Charles Sturt | 625 | 748 | 1,377 |
| Onkaparinga | 767 | 510 | 1,285 |
| Port Adelaide Enfield | 582 | 556 | 1,144 |
| Salisbury | 709 | 313 | 1,030 |
| Marion | 318 | 551 | 874 |
| Mount Barker | 590 | 73 | 669 |
| Tea Tree Gully | 392 | 146 | 543 |
| SA total | 10,280 | 4,830 | 15,244 |
Source · ABS Building Approvals (Cat. 8731.0), LGA data cube 87310DO016, July 2026 release. Figures cover the full 2025–26 financial year, from July 2025 to June 2026. SA total includes all LGAs statewide.
Section 02 · Approvals vs completions
South Australia building approvals and dwelling completions
South Australia approved 14,526 dwellings in 2024–25. Dwelling completions remained lower, with about 12,800 new residential dwellings completed over the four quarters to June 2025. ABS Building Activity data show 3,977 new residential completions in the December quarter of 2025 and 3,081 in the March quarter of 2026.
On a total-approvals basis, this leaves a gap of about 1,700 dwellings. Excluding the 105 conversion dwellings included in the approvals total, the new-build gap is closer to 1,600 dwellings.
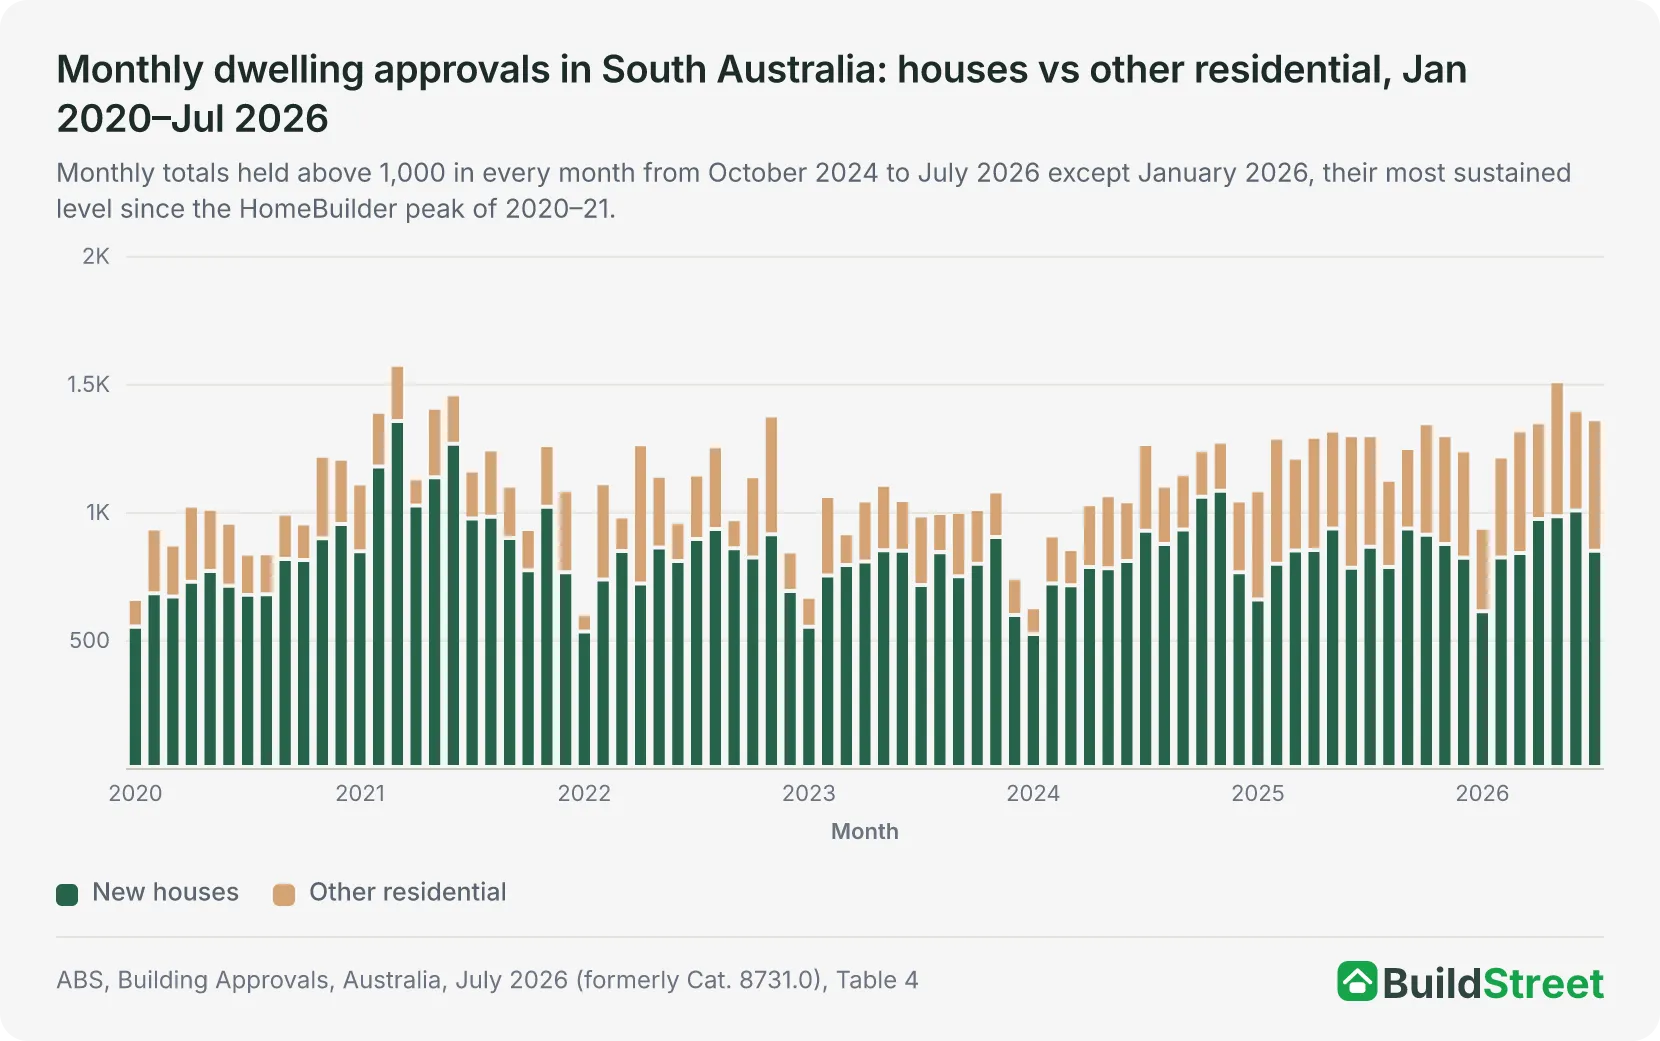
Monthly total approvals stayed above 1,000 in every month from October 2024 to July 2026 except January 2026. House approvals exceeded 800 in 16 of those 22 months. An approval represents planning permission, while a completion represents a finished dwelling. The difference between approvals and completions shows how much approved supply has not yet converted into completed housing.
New dwellings approved, 2024–25
14,526
10,404 houses + 4,017 other residential + 105 conversions ABS Building Approvals (Cat. 8731.0)
New residential completed, 2024–25
12,800
Estimated sum of four quarters to Jun 2025 ABS Building Activity (Cat. 8752.0)
Source · ABS Building Approvals (Cat. 8731.0), LGA data cube 87310DO016 for 2024–25, June 2026 release; ABS Building Activity (Cat. 8752.0). The 14,526 approvals figure includes 105 conversion dwellings. Houses plus other residential approvals total 14,421. Completions cover the four quarters to June 2025, new residential dwellings and total sectors.
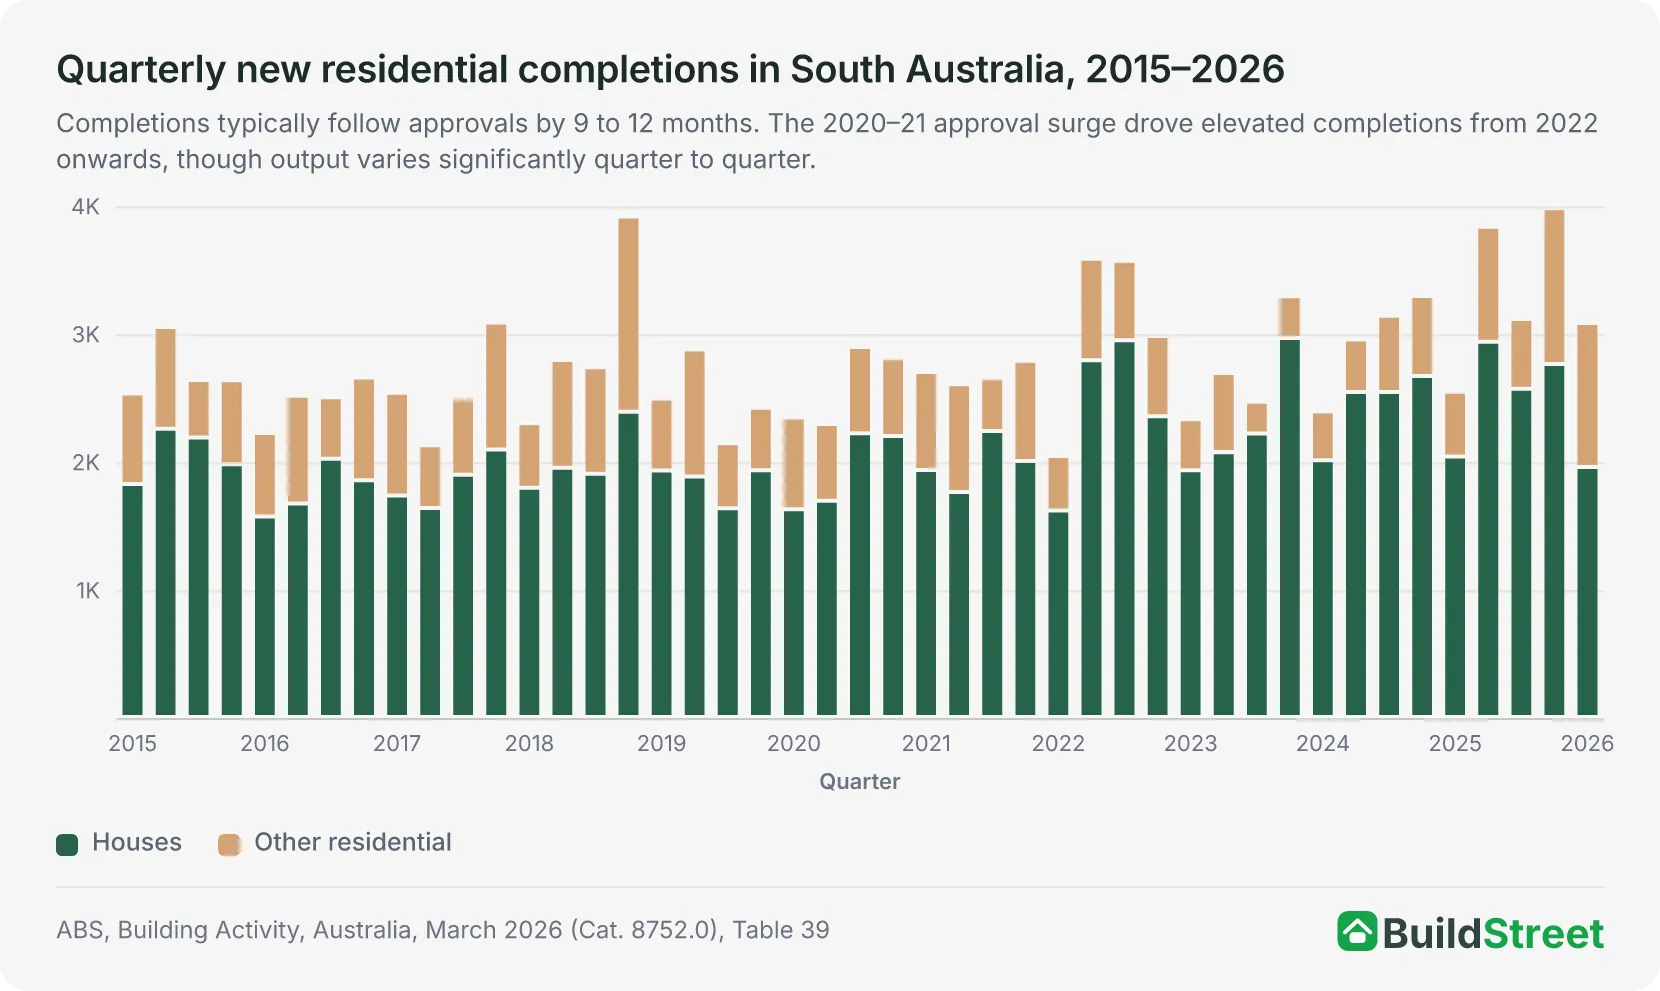
Completions remained below approvals throughout 2024–25, with quarterly completions staying within a range of about 2,500 to 4,000 dwellings. While the gap was modest in individual quarters, it shows that approved dwellings were not being completed at the same pace as new approvals.
Section 03 · Growth corridors
How is infrastructure shaping Adelaide's growth corridors?
A $1.5 billion SA Water infrastructure package is intended to support tens of thousands of allotments across Adelaide's growth areas, including the northern corridor. The main constraint was not only planning policy, but physical servicing capacity. The Bolivar Wastewater Treatment Plant in the outer north had reached full capacity, while the Salisbury trunk main was also under pressure. Until both were upgraded, major releases could not proceed at the planned scale and Development Agreements for Infrastructure could not be issued. The Greater Adelaide Regional Plan identifies these corridors as key areas for future housing growth.
Key northern release areas, including Riverlea, Concordia and Two Wells, were therefore constrained by water and wastewater servicing capacity as well as the broader planning process. These areas could not proceed at their planned scale until the infrastructure constraints were addressed.
Northern corridor
Playford · Angle Vale · Concordia · Riverlea · Two Wells
Major growth corridor. Playford is projected to reach 166,334 residents by 2041, up 50,544 (43.7%) from its 2025 population of 115,790. Water and wastewater capacity, rather than planning policy, was the main constraint resolved by the SA Water package.
Southern corridor
Hackham · Aldinga · Sellicks Beach · Onkaparinga Heights
2,000+ — Onkaparinga Heights (Hackham) is planned for 2,000+ allotments, backed by $30.5 million in state funding. The GARP notes that southern greenfield land will run out in the medium term at current demand rates.
Seaton (inner west)
Renewal SA, master-planned infill
1,315 — $425.3 million state-funded. Includes 388 social and 197 affordable dwellings. A flagship government-backed project designed to show that inner-city infill can work at scale.
Southwark (inner north)
Renewal SA, master-planned infill
1,300 — $104.7 million state-funded on former industrial land. Designed as a model for medium-density infill on government-owned urban sites, though the level of public investment in both projects suggests infill doesn't yet stack up financially without government support.
Source: SA 2025–26 Budget Statement; Housing Roadmap 2024; PlanSA Local Area Population Projections; Greater Adelaide Regional Plan, current version.
Section 04 · Supply vs demand
Why is Adelaide's rental vacancy rate still so low?
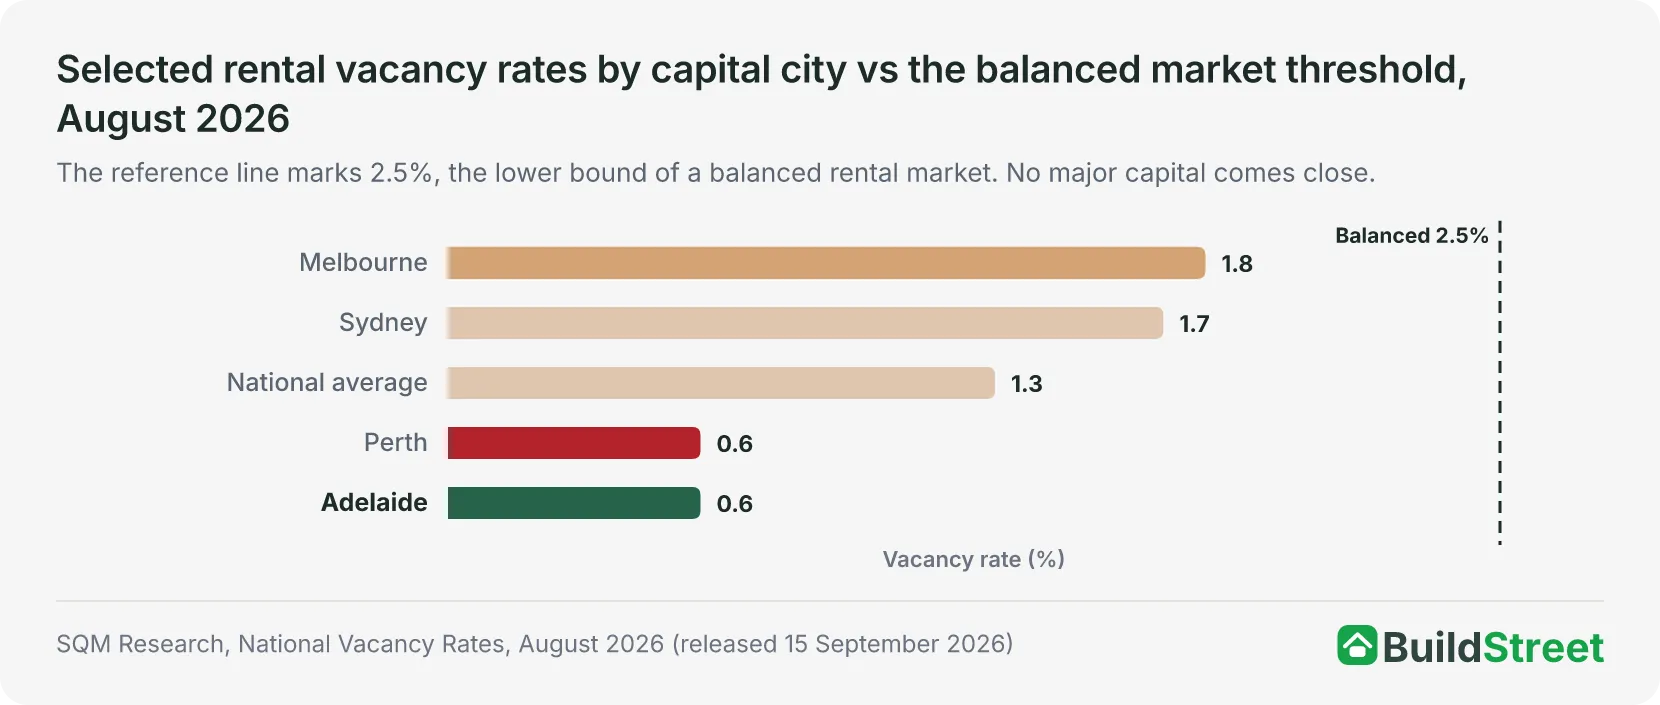
Adelaide's rental vacancy rate was 0.6% in August 2026, unchanged from July, with 1,019 rental properties listed across metro Adelaide3. This placed Adelaide among the tightest capital city rental markets, level with Perth and Hobart and behind only Darwin at 0.4%. Combined advertised rents rose 3.4% over the year to the week ending 4 September 2026, below the national average of 7.3% and behind Hobart at 10.4%, Darwin at 8.7% and Brisbane at 7.7%. SQM's three-week vacancy measure indicates a constrained rental market, with available rental stock well below the 2.5% to 3.0% range often used to indicate a more balanced market.
Fastest rent growth (Hobart)
- +10.4%
Hobart recorded the highest annual rent growth of any capital city in the year to early September 2026. Adelaide’s annual rent growth eased to 3.4%, placing it among the slowest-growing capital city markets.
COMPLETIONS, MAR Q 2026
- 3,081
New residential completions eased to 3,081 in the March quarter of 2026, from 3,977 in the December quarter of 2025.
SHARE OF SA ACCORD TARGET MET
- 78%
South Australia is projected to deliver 78% of its 84,000-dwelling Accord allocation, with full delivery not expected until March 2031.
South Australia is projected to fall 18,000 homes short of its Accord target
South Australia is projected to deliver 66,000 dwellings against its 84,000-home National Housing Accord allocation, leaving an estimated shortfall of 18,000 homes4. At the current projected pace, full delivery is not expected until March 2031, which is 21 months after the June 2029 deadline.
The National Housing Accord targets 1.2 million new homes across Australia over the five years from mid-2024. South Australia's 84,000-home allocation reflects its roughly 7% share of the national population. Nationally, WA and the ACT are the only jurisdictions projected to meet their targets by June 2029. Australia as a whole is tracking at 82% of the Accord target, while NSW has the largest estimated shortfall, at 118,000 homes below its 376,000-dwelling allocation4.
South Australia: dwelling approvals vs Accord pace
Dwellings approved each financial year against 16,800 a year, the average pace needed to reach SA's 84,000-home Accord allocation by June 2029.
- FY202514,526
- FY202615,244
— Benchmark: 16,800
| State/territory | Supply 2019–24 | Est. supply 2024–29 | Accord target | % of target met | Est. completion date |
|---|---|---|---|---|---|
| ACT | 24,000 | 22,000 | 21,000 | 103% | Jun-29 |
| WA | 75,000 | 129,000 | 129,000 | 100% | Jun-29 |
| VIC | 306,000 | 287,000 | 306,000 | 94% | Dec-29 |
| QLD | 166,000 | 204,000 | 246,000 | 83% | Sep-30 |
| SA | 54,000 | 66,000 | 84,000 | 78% | Mar-31 |
| NSW | 251,000 | 258,000 | 376,000 | 69% | Jun-31 |
| TAS | 16,000 | 13,000 | 26,000 | 51% | Dec-33 |
| NT | 3,000 | 4,000 | 11,000 | 34% | After 2034 |
| Australia | 896,000 | 980,000 | 1,200,000 | 82% | Sep-30 |
Source · NHSAC, Table 4.1, early 2026 outlook. SA highlighted. WA and the ACT are the only jurisdictions projected to meet their Accord targets by June 2029.
| Capital city | Vacancy rate (Aug 2026) | Available properties | Annual rent growth | Status |
|---|---|---|---|---|
| Adelaide | 0.6% | 1,019 | +3.4% | Severely constrained |
| Perth | 0.6% | 1,192 | +7.1% | Severely constrained |
| Sydney | 1.7% | 12,821 | +5.4% | Loosening |
| Melbourne | 1.8% | 9,534 | +6.1% | Most balanced |
| National average | 1.3% | 41,039 | +7.3% | Under-supplied |
Source · SQM Research, National Vacancy Rates and Weekly Rents, August 2026 (released 15 September 2026).
Section 05 · Infill vs greenfield
How are infill targets and greenfield land prices reshaping Adelaide housing?
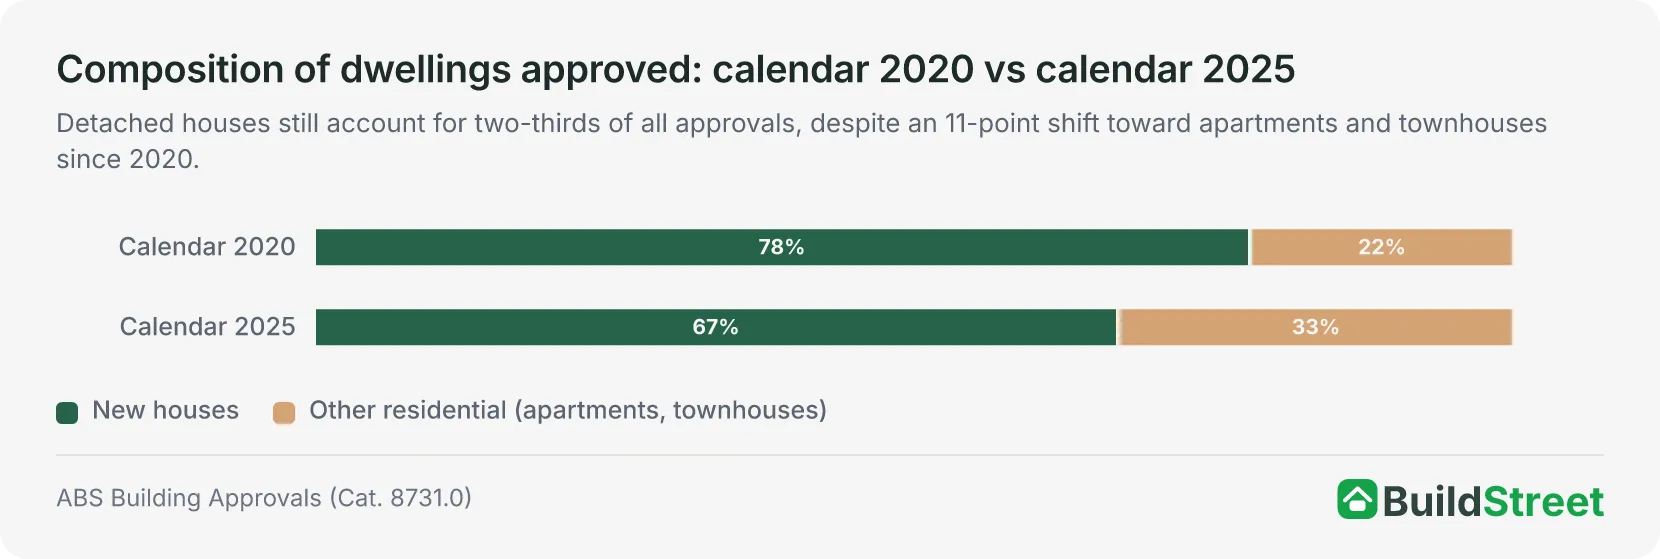
Detached houses made up 78% of South Australian dwelling approvals in calendar 2020. By 2025, that share had fallen to 67%, while apartments and townhouses rose from 22% to 33% over the same period. Despite this shift, detached houses still accounted for about two-thirds of all dwelling approvals, with much of that supply concentrated on the urban fringe.
Greater Adelaide greenfield lot prices rose 23% in 2025 as sales fell
Greater Adelaide's median greenfield lot price rose 23% in 2025 to $377,135, the largest annual increase of any capital city, following an 18% rise the year before5. Over the same period, greenfield lot sales fell 15% to 2,535. This indicates that price growth occurred while sales volumes declined, pointing to tighter development-ready land supply rather than stronger sales activity. Median lot sizes also fell below 400 sqm for the first time on record, which increased the land rate per square metre faster than the headline lot price.
| Planning document | Infill target | Greenfield target | What happened |
|---|---|---|---|
| 30-Year Plan (2010) | ~70% | ~30% | Partially met |
| 30-Year Plan update (2017) | 85% | 15% | Target missed |
| GARP draft scenarios (2024) | 50–70% | 30–50% | Range tested |
| Current GARP | No fixed target | No fixed target | Rolling 15-yr land supply |
Source · Greater Adelaide Regional Plan, current version; PlanSA; UDIA.
Infill development in established suburbs can involve land assembly across fragmented private ownership, along with local infrastructure upgrades such as stormwater and power networks. Seaton and Southwark, which together represent $530 million in state investment, show the scale of public funding attached to some major infill precincts. These projects indicate that large-scale infill can require substantial upfront investment, particularly where government-owned land, infrastructure works and affordable housing commitments are involved.
References
- ABS: Regional Population, 2024–25 · Australian Bureau of Statistics ↑
- ABS Regional population, 2024-25: population estimates and components by LGA, 2024 to 2025 (datacube 32180DS0002) · Australian Bureau of Statistics ↑
- SQM Research, National Vacancy Rate Steady at 1.3% as Sydney and Canberra Loosen, 15 September 2026 · sqmresearch.com.au ↑
- NHSAC State of the Housing System 2026 · nhsac.gov.au ↑ b
- Urban Development Institute of Australia, State of the Land 2026, released March 2026 · udia.com.au ↑
- ABS Building Approvals, Australia (latest release, Cat. 8731.0) · Australian Bureau of Statistics
- ABS, Building Activity, Australia (latest release, Cat. 8752.0) · Australian Bureau of Statistics
- PlanSA, Greater Adelaide Regional Plan · plan.sa.gov.au
- PlanSA, Local Area Population Projections for South Australia, 2021 to 2041 · plan.sa.gov.au
- South Australian Government, Housing Roadmap, June 2024 · dhud.sa.gov.au
- Premier of South Australia, More Homes for South Australians · premier.sa.gov.au
- Premier of South Australia, Water investment delivering new homes for South Australian families · premier.sa.gov.au
- InDaily, SA water bills to jump under state government plan, 25 June 2024 · indailysa.com.au
- South Australian Department of Treasury and Finance, 2025–26 Budget Statement · treasury.sa.gov.au
- South Australian Department of Treasury and Finance, Building Activity December 2025 · South Australian Department of Treasury and Finance
- Researchfour, Greater Adelaide Greenfield Market Performance data, calendar year 2025, cited in UDIA State of the Land 2026 · Researchfour
