

Published 11 May 2026 · Updated 21 Sept 2026
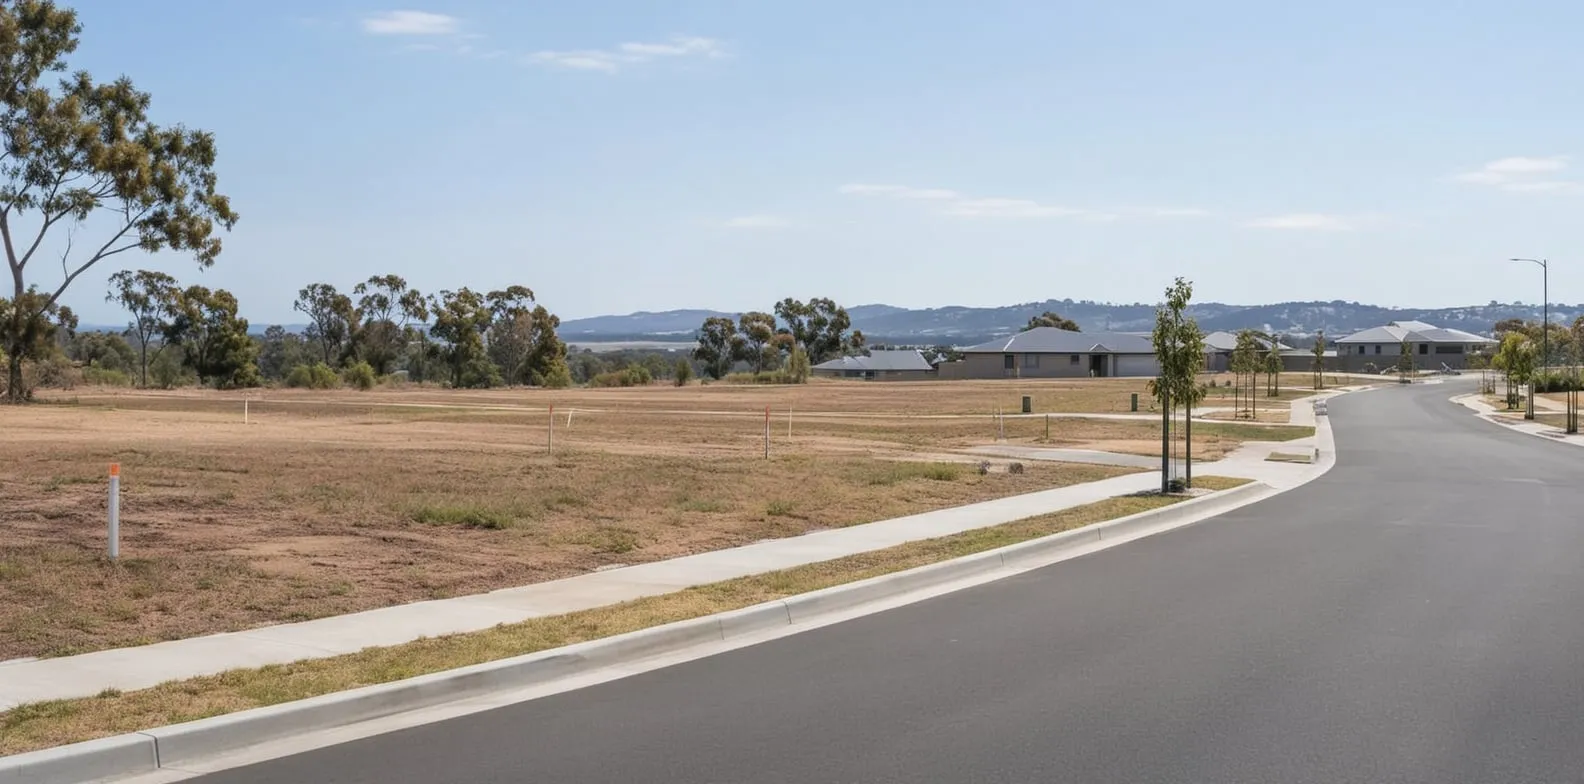
Australia has large volumes of land zoned for housing across every state, but much of it is not yet ready to build on. In New South Wales, for example, 59% of zoned residential land in the Sydney Mega-Region is constrained, while in Queensland more than half of greenfield land is still waiting on infrastructure. This gap between zoned land and development-ready land is a key factor limiting how quickly new homes can be delivered.
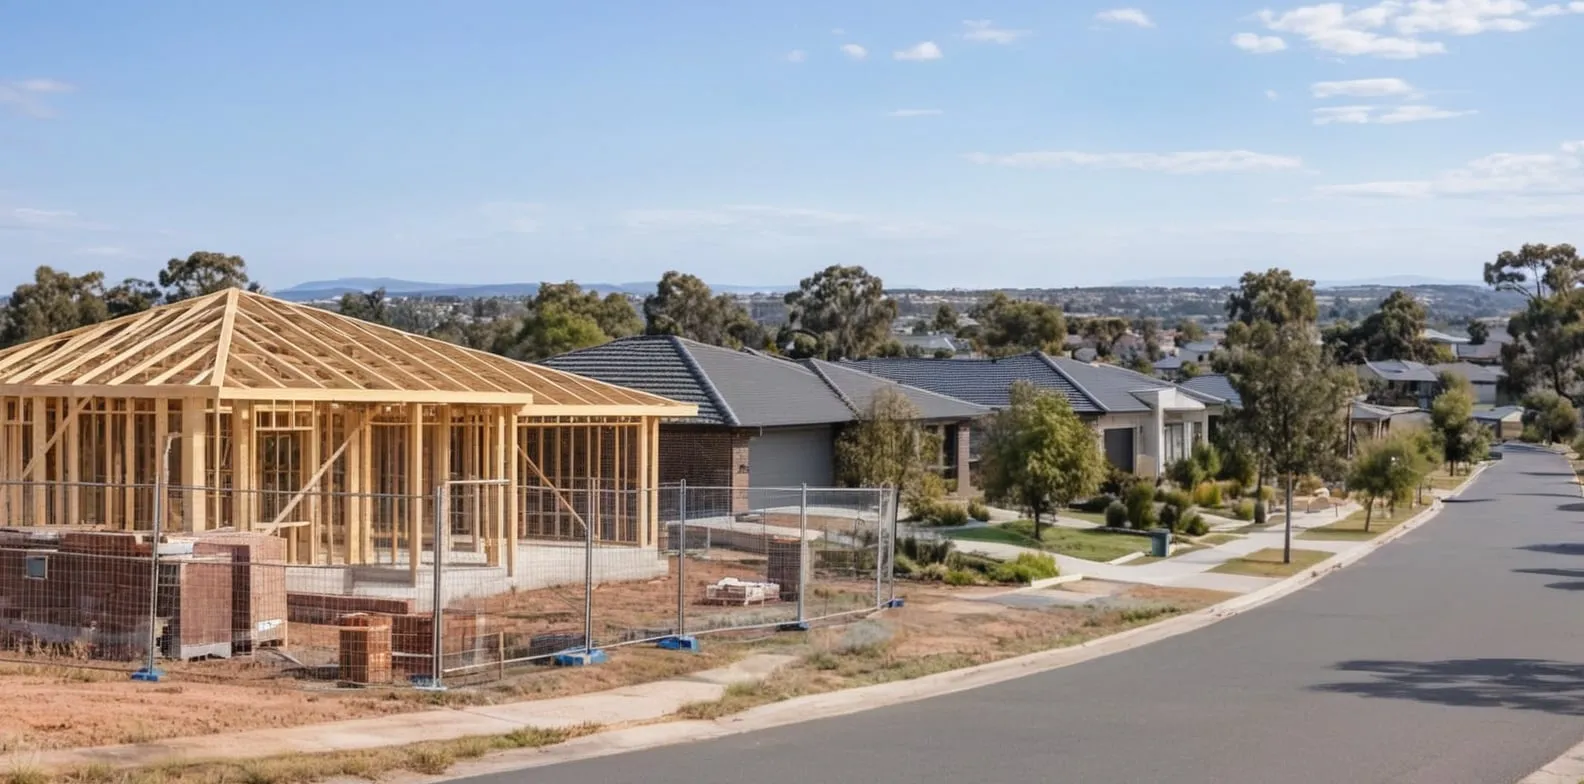 Is it cheaper to build or buy in Australia?Building a new home is cheaper than buying an established one in four of Australia's eight capital cities. However, the comparison is more complex than the headline result suggests, because the outcom…
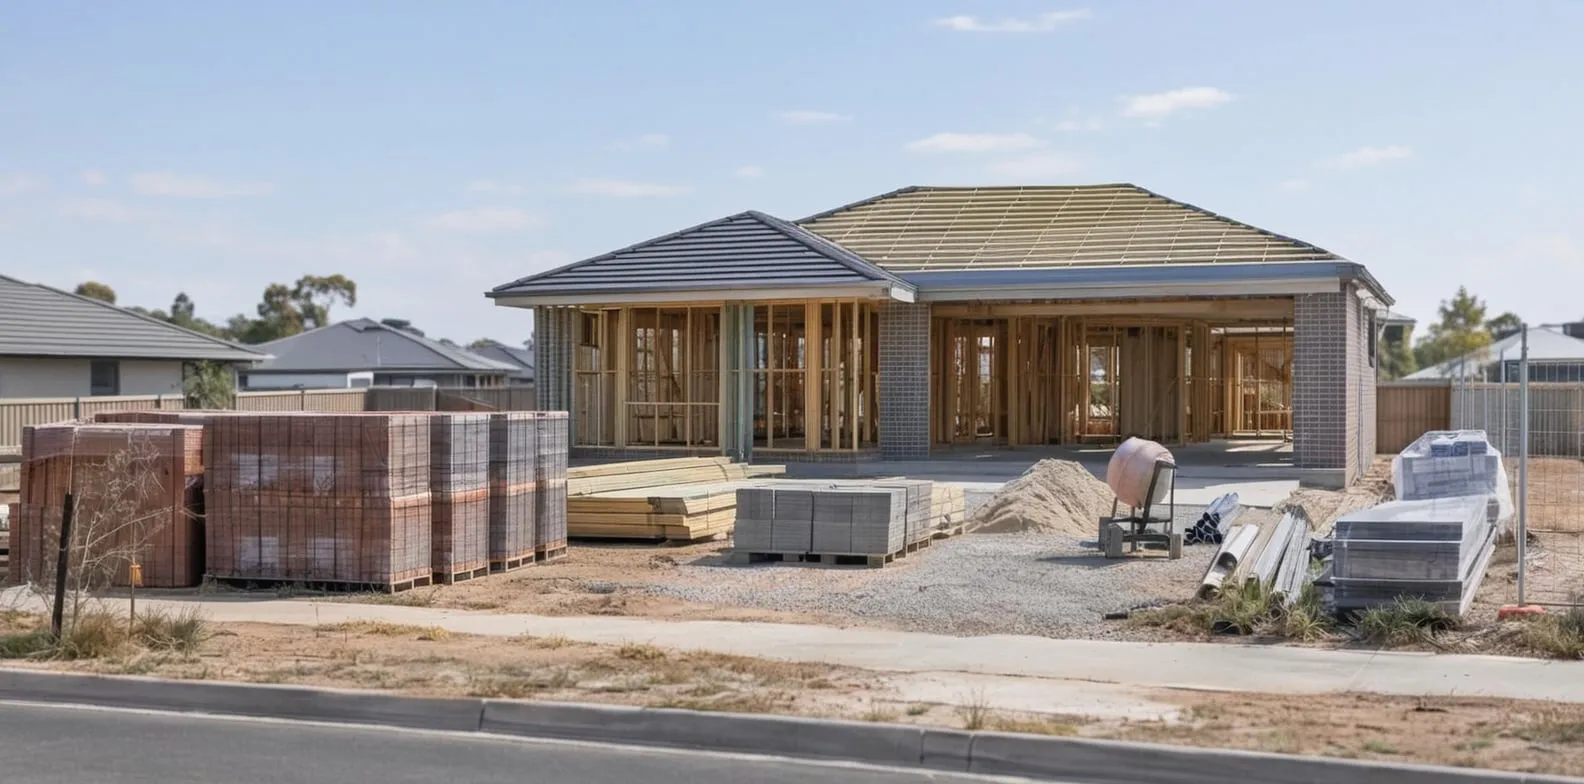 What does it cost to build a house in Australia? (2026)Building a new house in Australia costs $474,939 on average for the structure alone, based on the latest ABS completion data. Add land, and the national total sits around $847,000 at the median, climb…
Section 01
Development-ready land by region
Land supply is measured differently across states, and definitions and reporting cycles are not consistent. The figures below provide a state-by-state view of available land, based on the most recent data.
New South Wales
NSW has completed 55,625 new homes since July 2024, but the pipeline ahead is tight. Within the Sydney Mega-Region, 59% of zoned residential land is constrained and cannot deliver housing as planned. Only 3.2 years of greenfield supply remain at current rates, and 89% of lots expected over the next eight years aren't development-ready. The main constraints are infrastructure funding gaps and biodiversity requirements.
In the Lower Hunter alone, 22,800 homes are delayed due to unfunded road upgrades1. UDIA NSW estimates a further $237 million in government funding could bring around 14,000 of those forward.
| Metric | Data |
|---|---|
| Zoned broadhectare land | 16,700 ha (Sydney Mega-Region); 11,275 ha (greenfield) |
| Constrained land | 59% of total zoned; 45% of greenfield land |
| Years of supply | 6.4 years (Sydney Mega-Region); 3.2 years (greenfield) |
| Strategic direction | Transport-Oriented Development (TOD) and Low and Mid Rise (LMR) policies |
Victoria
Victoria is running greenfield estates on the outer fringe alongside denser infill in established suburbs. As of January 2025, Melbourne's growth corridors held over 294,000 lots across zoned and unzoned englobo land, with 39,812 actively in subdivision2. But delivery is slowing. Only 18,543 greenfield lots were titled in 2024, down from 22,727 the year before. The apartment pipeline holds 158,533 dwellings at various stages.
| Regional Centre | Titled 2023 | Titled H1 2024 | Proposed Lots | Zoned Lots |
|---|---|---|---|---|
| Geelong | 2,111 | 1,167 | 4,791 | 9,799 |
| Ballarat | 1,183 | 300 | 1,567 | 8,926 |
| Bendigo | 491 | 168 | 699 | 5,288 |
| Shepparton | 277 | 167 | 634 | 2,267 |
| Mildura | 572 | N/A* | 1,830 | 4,598 |
| Wangaratta | 71 | 83 | 143 | 2,291 |
Source · Victorian Urban Development Program 2025.
| Metric | Data |
|---|---|
| Active subdivision pipeline | 39,812 proposed greenfield lots |
| Lots titled in 2024 | 18,543 (down from 22,727 in 2023) |
| Infill pipeline | 158,533 dwellings at various stages |
| Years of supply (regional) | Up to 31 years (e.g., Horsham) |
Queensland
Queensland has zoned capacity for nearly 580,000 greenfield homes and over 1,000,000 infill homes. The bottleneck is infrastructure, not zoning. More than half of existing greenfield land is idle, waiting on roads, water and sewerage. EDQ approved 8,003 dwellings in Priority Development Areas in 2024–25 and committed $100.5 million to unlock 3,500+ homes. South East Queensland needs 104,000 more homes by 2029.
| Metric | Data |
|---|---|
| Zoned broadhectare capacity | ~580,000 homes (greenfield); ~1,000,000 homes (infill) |
| Infrastructure constraint | Over half of greenfield land awaits infrastructure |
| EDQ approvals (2024–25) | 8,003 dwellings in Priority Development Areas |
| Target supply balance | 70% infill / 30% greenfield (ShapingSEQ 2023) |
| Years of supply | Minimum 15 years (planned); 4 years (approved) |
Western Australia
WA has one of the largest raw land supplies in the country, with roughly 117,770 hectares of zoned land across Perth, Peel and Greater Bunbury, and over 26,000 hectares still undeveloped3. It also filters supply by environmental constraint groups (A, B and C), making its figures more reliable than most states. Lot approvals surged 38% to nearly 24,000 in the year to June 2025. The weak spot is infill, sitting at just 39% against a much higher long-term target.
| Region | Urbanised Area (ha) | Undeveloped Area (ha) | Total Zoned (ha) |
|---|---|---|---|
| Perth Metropolitan | 78,510 | 19,790 | 98,300 |
| Peel Region | 6,550 | 2,580 | 9,140 |
| Greater Bunbury | 6,640 | 3,700 | 10,340 |
| Metric | Data |
|---|---|
| Total zoned land | 117,770 ha across Perth, Peel, and Greater Bunbury |
| Undeveloped zoned land | 26,070 ha |
| Residential lot approvals (2025) | ~24,000 (38% increase year-on-year) |
| Actual infill rate | 39% (below long-term strategic targets) |
| Years of supply | 20–26 years (Perth/Peel); 55 years (Greater Bunbury) |
South Australia
SA law requires the government to hold at least 15 years of residential land supply before unlocking new greenfield land. Greater Adelaide has 139,000 allotments already zoned and ready, well above that threshold. SA is also rolling out the largest land release in state history: 25,000 homes across Dry Creek, Concordia and Hackham. Infill historically dominates, making up 67% of new supply between 2017 and 2021.
| Metric | Data |
|---|---|
| Zoned allotments | ~139,000 (Greater Adelaide) |
| Total lots identified | 203,759+ |
| New mega land release | 25,000+ homes (Dry Creek, Concordia, Hackham) |
| Infill vs greenfield | 67% infill / 33% greenfield (2017–2021) |
| Years of supply | 15+ years (statutory minimum maintained) |
Tasmania
Tasmania focuses on building within its existing urban boundary rather than expanding outward. Spatial analysis found capacity for over 34,000 dwellings inside that boundary, enough to meet the 30-year forecast demand of 30,000 homes4. However, areas like Scottsdale carry 35 to 40 years of theoretical supply on paper that doesn't hold up in reality. Steep terrain means many lots can't connect to standard sewerage, making them too expensive to develop.
| Metric | Data |
|---|---|
| Identified dwelling capacity | 34,000+ within existing urban boundary |
| Target supply split | 70% infill / 30% greenfield |
| Demand forecast (30 years) | ~30,000 new homes |
| Key constraint | Topography (downslope sewerage limitations) |
| Years of supply (some areas) | 35–40 years on paper (e.g., Scottsdale) |
Australian Capital Territory
The ACT releases all residential land through the Housing Supply and Land Release Program (HSLRP), whose Indicative Land Release Program (ILRP) sets a rolling five-year release schedule. The 2025–26 to 2029–30 program plans 25,948 new homes5, with at least 70% of new housing inside the existing urban footprint and at least 15% of suitable residential land each year going to public, community and affordable housing — 20% in 2025–26. In practice, slow land servicing and rising construction costs have pushed prices up. On the developer's price list at 21 September 2026, the 39 blocks on offer in Denman Prospect ranged from $549,000 to $1,450,000, with a median asking price of $765,0006.
| Metric | Data |
|---|---|
| New homes targeted (2025–26 to 2029–30) | 25,948 via ILRP |
| Infill target | At least 70% of new housing within the existing urban footprint (program principle under the ACT Planning Strategy) |
| Public, community and affordable housing | At least 15% of suitable annual releases; 20% in 2025–26 |
| Block asking prices (Denman Prospect, 21 Sep 2026) | $549,000–$1,450,000; median $765,000 (39 blocks listed) |
Northern Territory
The NT has struggled to get land to market efficiently. A government review led to 23 recommendations; 15 have been actioned, cutting red tape and speeding up approvals. The Land Development Corporation (LDC) delivers residential land in Zuccoli, Kilgariff and Fannie Bay. Commencements fell below 100 per quarter in late 2023, the lowest in 30 years, but are forecast to recover to 730 in 2024–25 and peak at 990 in 2026–27.
| Metric | Data |
|---|---|
| Land pipeline | 20-year forward forecast via Land Development Strategy |
| Development-ready land | "Land Under Development": developer-held with connected services |
| Forecast commencements | 730 in 2024–25; 990 in 2026–27 |
| Key delivery body | Land Development Corporation (LDC) |
Section 02
Greenfield and infill housing targets by state
Several states and territories have set targets to increase the share of housing delivered through infill development, including apartments and townhouses in established suburbs. These policies are designed to reduce reliance on outer-fringe greenfield estates, where new roads, schools, water and sewerage infrastructure are often required.
| Jurisdiction | Target Ratio (Infill : Greenfield) | Status |
|---|---|---|
| ACT | At least 70% : 30% | ACT Planning Strategy target (program principle) |
| Tasmania | 70% : 30% | Greater Hobart Plan mandate |
| Queensland | 70% : 30% | ShapingSEQ 2023 target |
| South Australia | ~67% : 33% | Historically achieved |
| Western Australia | Higher target; 39% achieved | Below long-term target |
| NSW | Focus on TOD & LMR policies | Policy-driven shift |
Apartment and townhouse projects can be more difficult to deliver where construction costs, planning requirements, labour availability and project feasibility affect development timelines. In some markets, these factors may limit how quickly infill housing can be added compared with greenfield estates.
Section 03
Years of supply: what do the numbers actually mean?
Years of supply figures vary sharply between states and are calculated differently. They measure theoretical zoned capacity, not land that's actually ready to build on. Three structural problems explain why decades of supply on paper can shrink to just a few usable years in practice.
| Jurisdiction | Reported Years of Supply | How It's Calculated |
|---|---|---|
| WA | 20–26 yrs (Perth / Peel); 55 yrs (Greater Bunbury) | Undeveloped urban-zoned land divided by the 20-year historical annual consumption rate. |
| SA | 15+ yrs (Greater Adelaide — statutory minimum) | 139,000 zoned allotments measured against average demographic growth rates. |
| VIC (Regional) | Up to 31 yrs (e.g., Horsham) | Zoned capacity under current land use settings divided by upside demand scenarios (e.g., 82 dwellings/year). |
| TAS | 35–40 yrs (e.g., Scottsdale) | Identified residential lots measured against localised population forecasts. |
| NSW | 6.4 yrs (Sydney Mega-Region); 3.2 yrs (Greenfield only) | Unconstrained zoned land measured against annual delivery rates required by the Housing Accord. |
| QLD | Min. 15 yrs (Planned supply); Min. 4 yrs (Approved supply) | Statutory minimums tracked by the Growth Monitoring Unit against projected demand under ShapingSEQ. |
| ACT | Rolling 5 yrs (Overall supply); ~12 yrs (Multi-unit infill) | Managed via the ILRP rolling release plan, with infill capacity modelled against current demographics. |
| NT | 11 yrs (Greater Darwin); 8 yrs (Katherine); 27 yrs (Tennant Creek) | "Land Under Development" (developer-held, infrastructure connected) measured against NT Treasury demand forecasts. |
Infrastructure funding gaps
Land generally needs roads, water and sewerage before housing can be delivered. In Sydney's Mega-Region, 59% of zoned land is constrained because supporting infrastructure has not yet been funded. Until funding and delivery arrangements are resolved, some zoned land may remain unavailable for development.
Environmental and biodiversity rules
Broad zoning maps do not always capture environmental constraints. Western Australia adjusts its land supply figures using environmental constraint groups, while other states report these constraints differently. In some areas, biodiversity requirements can reduce the amount of zoned land that is practical or feasible to develop.
Land fragmentation and difficult terrain
Some large residential land parcels are split across multiple owners, which can slow land assembly and subdivision. Site conditions can also affect delivery. In Tasmania, for example, steep terrain can make standard sewerage connections difficult, reducing the amount of land that is practically development-ready.
References
- UDIA NSW, Lower Hunter Building Blocks 2025 Refresh · udiansw.com.au ↑
- Victorian Urban Development Program 2025 · planning.vic.gov.au ↑
- WA Urban Growth Monitor Report 17 · dplh.wa.gov.au ↑
- 30-Year Greater Hobart Plan · hobartcity.com.au ↑
- ACT Housing Supply and Land Release Program 2025-26 to 2029-30 · act.gov.au ↑
- Denman Prospect price list, 21 September 2026 · denmanprospect.com.au ↑
- NSW Urban Development Program (UDP) · planning.nsw.gov.au
- Queensland Growth Monitoring Unit / QGSO Broadhectare Studies · qgso.qld.gov.au
- SA PlanSA — Land Supply Monitoring · plan.sa.gov.au
- NT Land Development Strategy · ldc.nt.gov.au
- NHSAC State of the Housing System 2026 · nhsac.gov.au
- Urban Development Institute of Australia, State of the Land 2026, released March 2026 · udia.com.au
