

Published 25 June 2026 · Updated 28 Sept 2026
Victoria completed 56,383 dwellings in 2024–25, the lowest annual total in a decade and about 4,800 below the 61,200 a year needed to meet its Housing Accord share. Since the Accord began in July 2024, Victoria has completed about 98,200 homes to March 2026, 32% of its 306,000 allocation with 35% of the five-year period gone: close to the required pace, but not yet on it.
Approvals over the same period were 56,657, almost level with completions, and eased to 55,798 in 2025–26, so the pipeline of approved homes is still below the Accord pace. Construction costs, longer build times, and a weaker apartment pipeline have slowed the flow of new housing into the market.
 Is Australia on track to build 1.2 million homes by June 2029?Australia has completed 307,635 homes in the first seven quarters of the National Housing Accord, leaving the country 112,365 homes behind the pace needed to reach 1.2 million by June 2029. Australia…
 The states with the fastest and slowest home build times in AustraliaBuilding a new home in Australia involves two key waiting periods: approval to commencement (the time from receiving planning approval to breaking ground), and commencement to completion (the time fro…
Section 01 · The housing target
How many homes does Victoria need to build?
The federal National Housing Accord sets a national target of 1.2 million new homes over five years from 2024–25 to 2028–291. Each state and territory's share is allocated based on population. Victoria, with a 25.5% share of Australia's population, is responsible for 306,000 of those homes. This is the second-largest allocation nationally, behind New South Wales (376,000). Meeting that target requires Victoria to deliver approximately 61,200 dwellings a year across the five-year Accord period.
Victoria's long-term housing needs are larger. The state's population is projected to reach 10.3 million by 2051, up from around 7.1 million today, requiring 2.24 million additional dwellings over that period2. The Accord covers only the first five years of that challenge.
- homes needed every single day
- 168
- 365 days a year, to meet Victoria's Accord target
- per week
- 1,177
- including weekends and public holidays
- per month
- 5,100
- every month across the five-year Accord period to June 2029
| Accord objective | Target figure | Timeframe |
|---|---|---|
| Victoria's Accord allocation | 306,000 new homes | 2024–25 to 2028–29 |
| Required annual delivery | 61,200 dwellings/year | 2024–25 to 2028–29 |
| National Accord target (all states) | 1,200,000 new homes | 2024–25 to 2028–29 |
| Victoria's population share | 25.5% | Based on Dec 2022 ERP |
| Long-term state requirement | 2.24 million new homes | By 2051 |
| Regional Victoria target | 425,600 homes | By 2051 |
| Surplus government land target | 9,000 homes (min. 10% affordable) | Progressive delivery |
| Spatial distribution goal | At least 70% in established areas | Progressive delivery |
Source · National Housing Supply and Affordability Council, State of the Housing System 2025; Victorian Government, Plan for Victoria targets, February 2025.
Victoria's housing targets also depend on where new homes are built. Under the 70/30 distribution requirement, at least 70% of new homes must be delivered within existing urban areas2. The remaining 30% is directed to growth corridors and new precincts, including areas linked to the Suburban Rail Loop East.
The Victorian Government has also formed an Affordability Partnership with industry groups, including the Property Council of Australia, Master Builders Victoria, the Urban Development Institute of Australia and the Housing Industry Association. The partnership links planning reform and permit backlog clearance to private-sector delivery commitments. As part of this process, more than 1,400 applications that had been stalled in council planning for over six months were cleared.
How Victoria compares with other states
Victoria is one of the stronger-performing states under current Housing Accord projections, although it is still expected to fall slightly short of its allocation. Early 2026 estimates suggest the state will deliver around 287,000 homes over the five-year Accord period, equal to 94% of its target of 306,000 homes.
That is one of the highest projected delivery rates nationally, behind only the ACT and Western Australia. By comparison, Australia as a whole is projected to deliver around 980,000 homes against the national target of 1.2 million, equal to about 82% of the target.
Performance varies significantly between states. Western Australia is projected to meet its allocation by June 2029, while New South Wales is expected to miss its target by a wide margin. The Northern Territory has the largest proportional shortfall, with projected supply equal to only 34% of its target and no projected completion date before 2034.
| State / territory | Supply 2019–20 to 2023–24 | Est. supply 2024–25 to 2028–29 | Population share (%) | Accord target (homes) | Est. supply as % of target | Est. completion quarter |
|---|---|---|---|---|---|---|
| New South Wales | 251,000 | 258,000 | 31.4% | 376,000 | 69% | Jun 2031 |
| Victoria | 306,000 | 287,000 | 25.5% | 306,000 | 94% | Dec 2029 |
| Queensland | 166,000 | 204,000 | 20.5% | 246,000 | 83% | Sep 2030 |
| Western Australia | 75,000 | 129,000 | 10.8% | 129,000 | 100% | Jun 2029 |
| South Australia | 54,000 | 66,000 | 7.0% | 84,000 | 78% | Mar 2031 |
| Tasmania | 16,000 | 13,000 | 2.2% | 26,000 | 51% | Dec 2033 |
| Australian Capital Territory | 24,000 | 22,000 | 1.8% | 21,000 | 103% | Jun 2029 |
| Northern Territory | 3,000 | 4,000 | 1.0% | 11,000 | 34% | After 2034 |
| Australia (total) | 896,000 | 980,000 | 100% | 1,200,000 | 82% | Sep 2030 |
Source · National Housing Supply and Affordability Council, State of the Housing System 2025. Population share based on December 2022 ERP. Supply estimates cover gross new dwellings; figures are rounded to the nearest 1,000.
Section 02 · Approvals
Victoria housing approvals remain below target
Victoria approved 55,798 dwellings in 2025–26, down about 1.5% from 56,657 in 2024–25. Both years remained below the 61,200 homes a year needed to meet Victoria's Accord allocation.
Across the two years, approvals were about 9,900 dwellings below that annual pace.
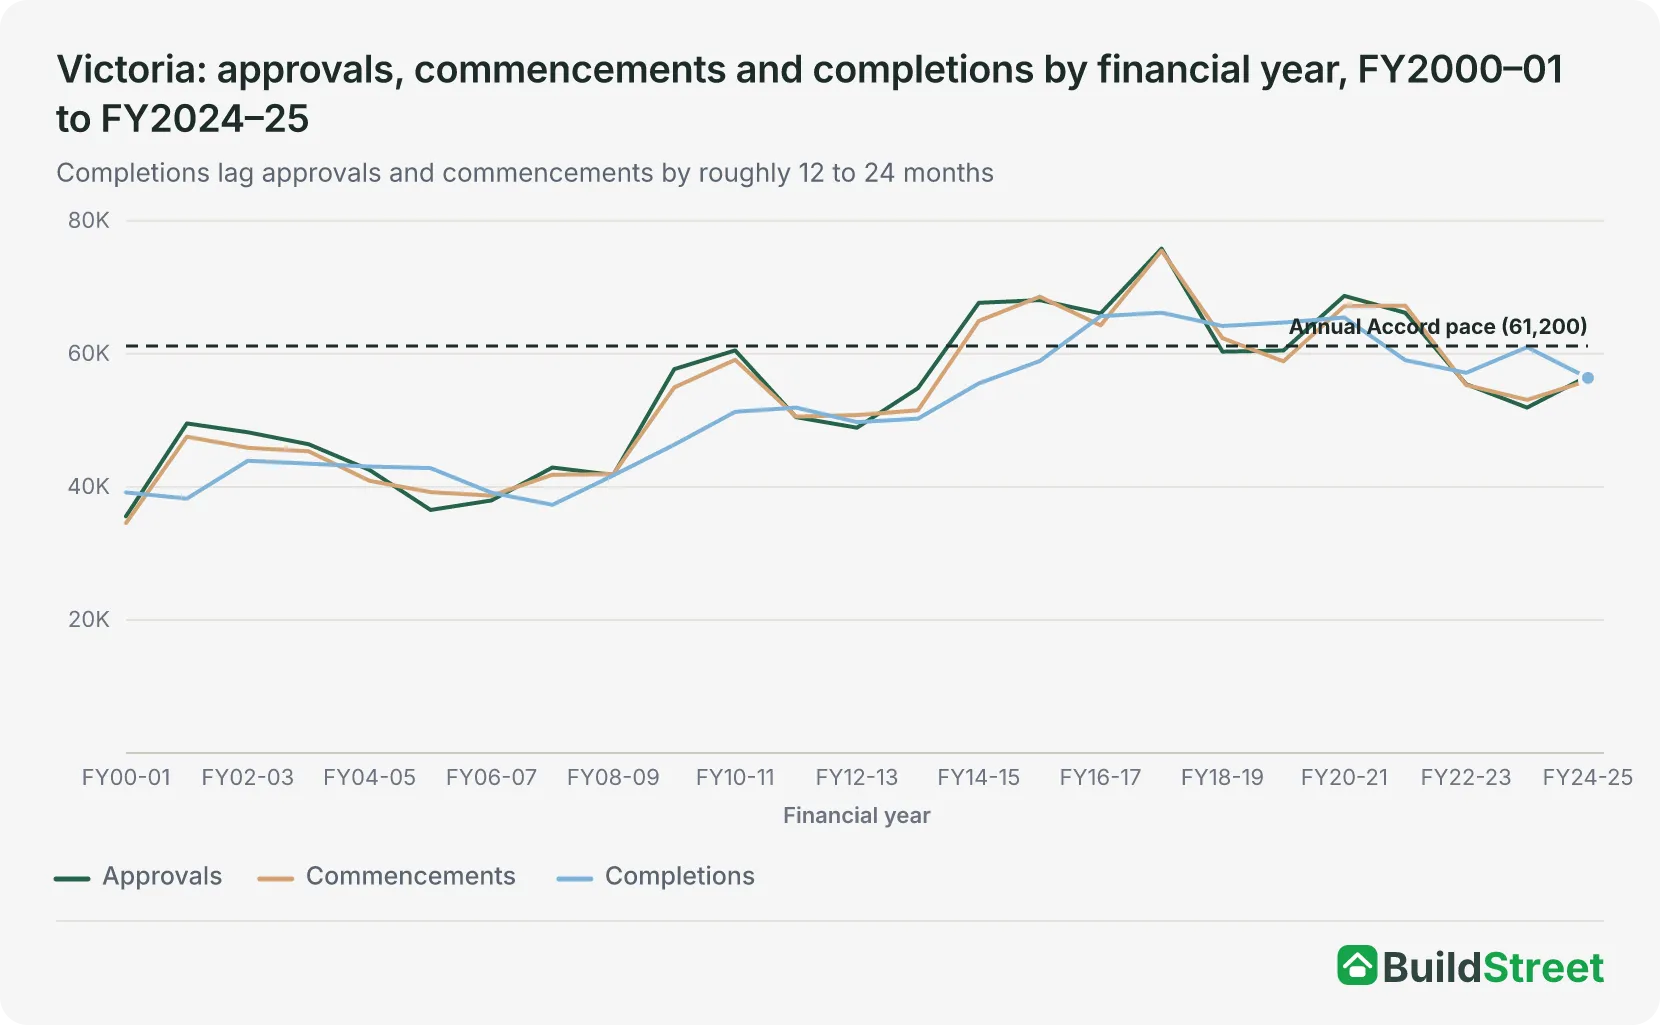
Building approvals show how many dwellings have received permission to be built. They are an early indicator of future supply because homes usually take 12 to 24 months to move from approval to completion. When approvals remain below the required pace, future completions are also likely to remain under pressure.
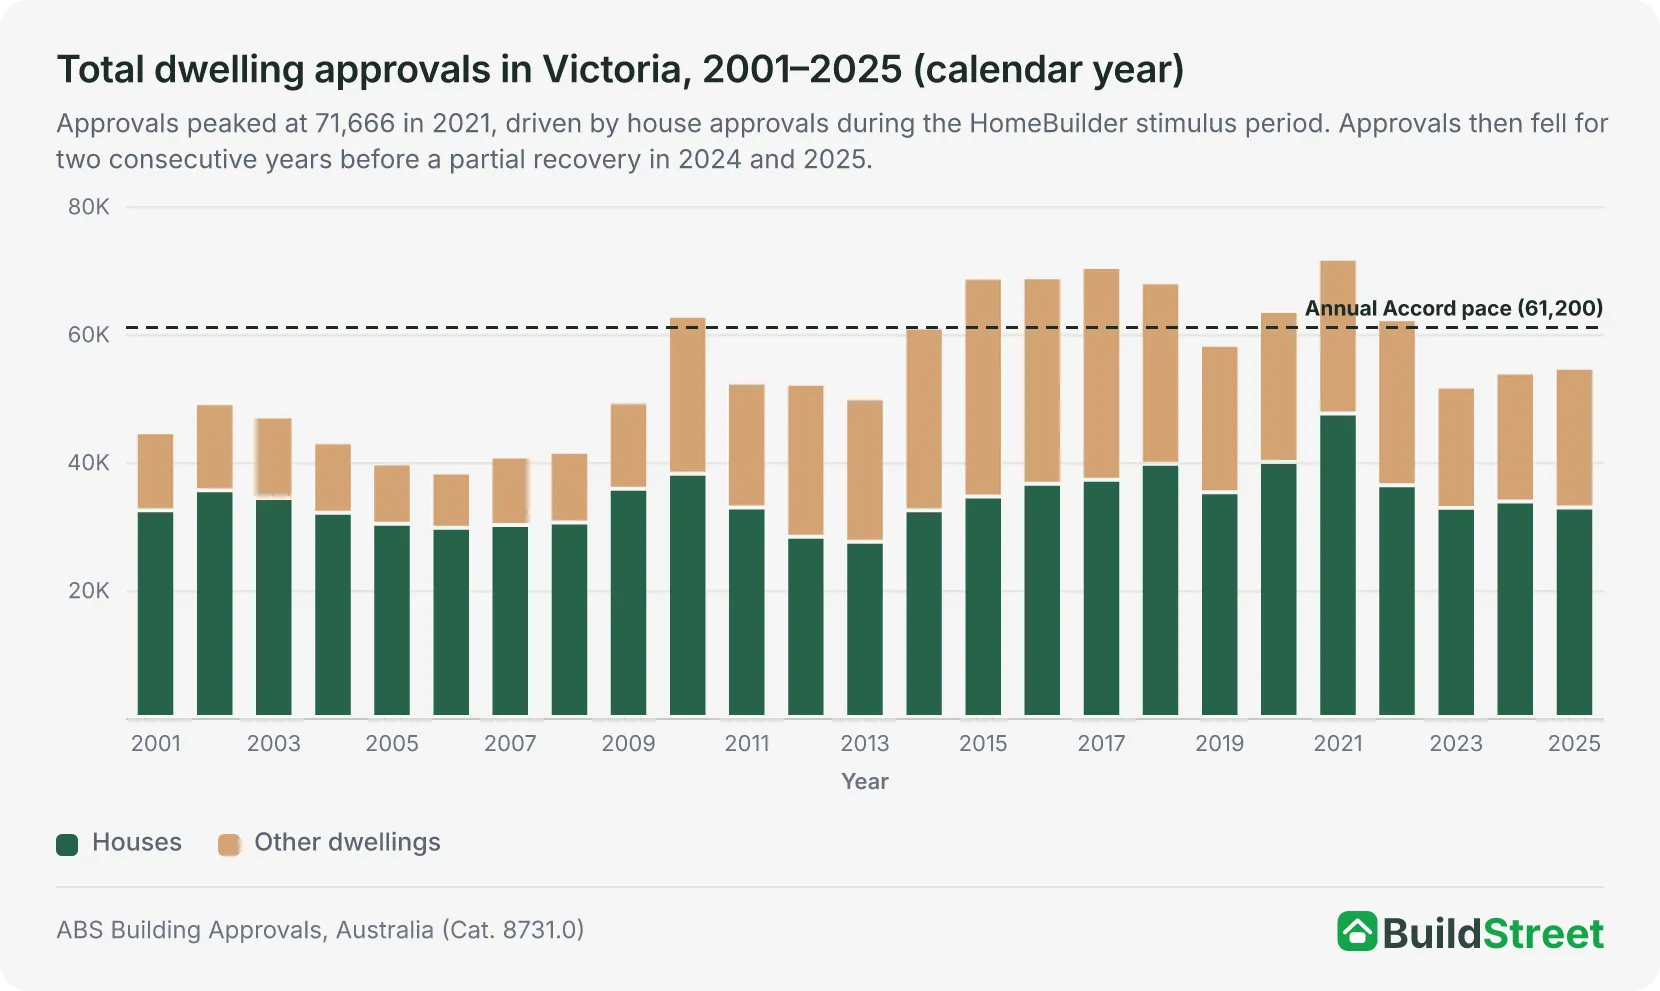
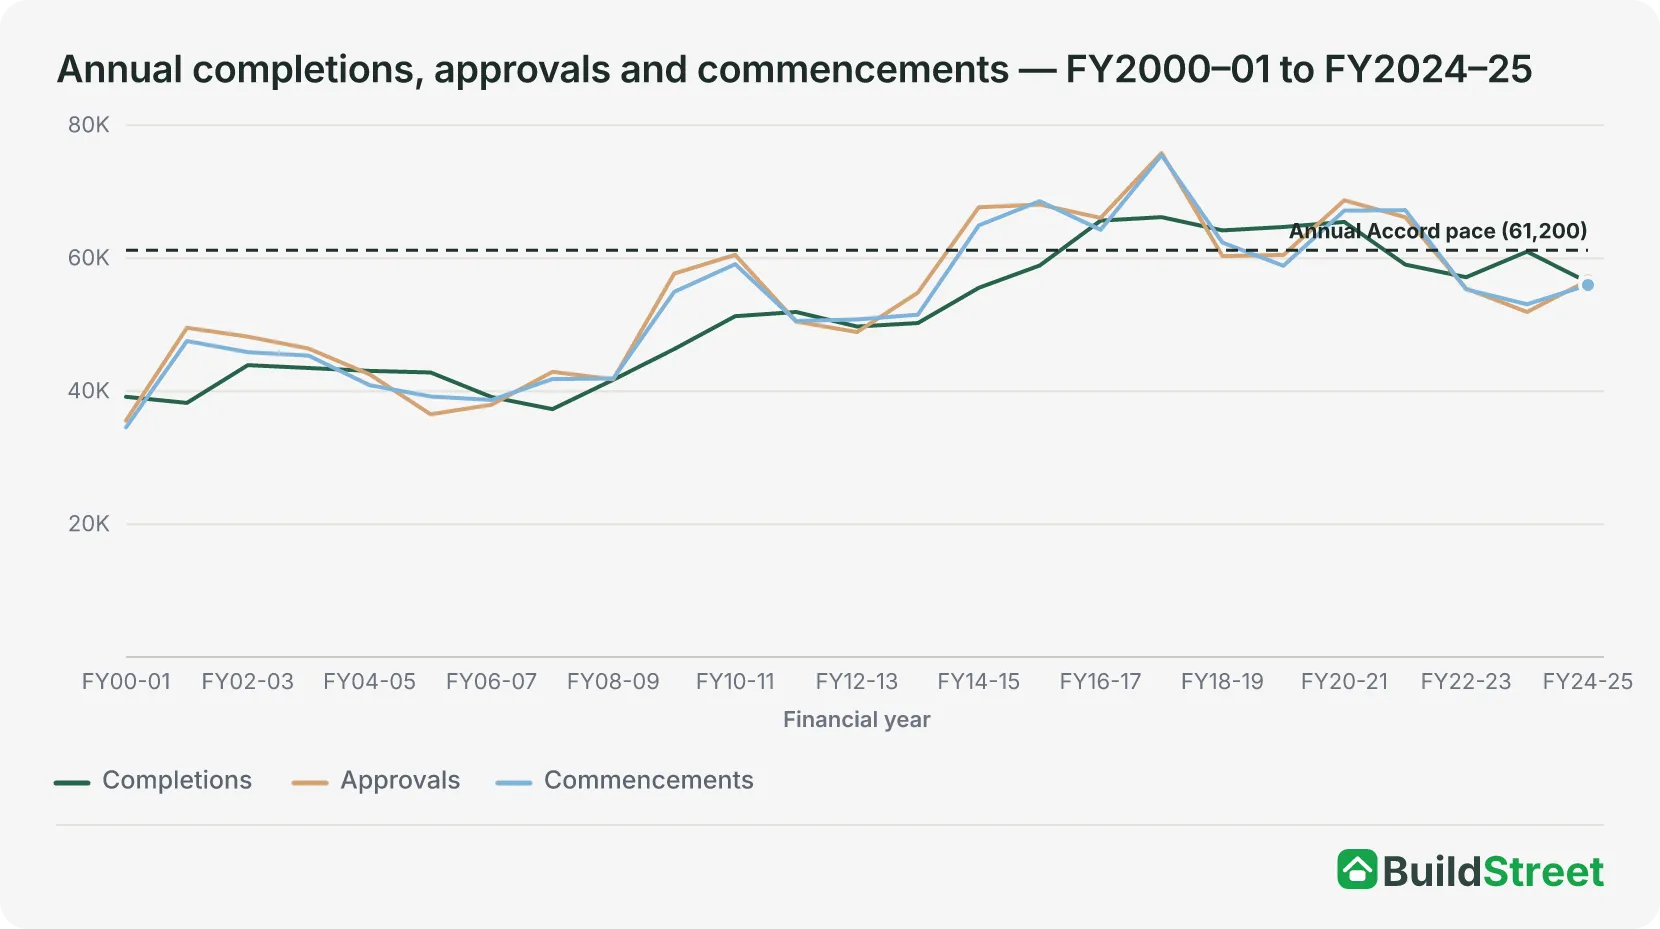
Victoria exceeded the 61,200 annual pace for approvals in every year from 2014–15 to 2017–18, and again in 2020–21 and 2021–22. Since then, approvals have fallen below that benchmark for four consecutive years.
In 2025–26, Victoria approved 55,798 dwellings, about 9% below the annual pace implied by the Accord. Across the four below-pace years, the combined approval gap is approximately 25,000 dwellings.
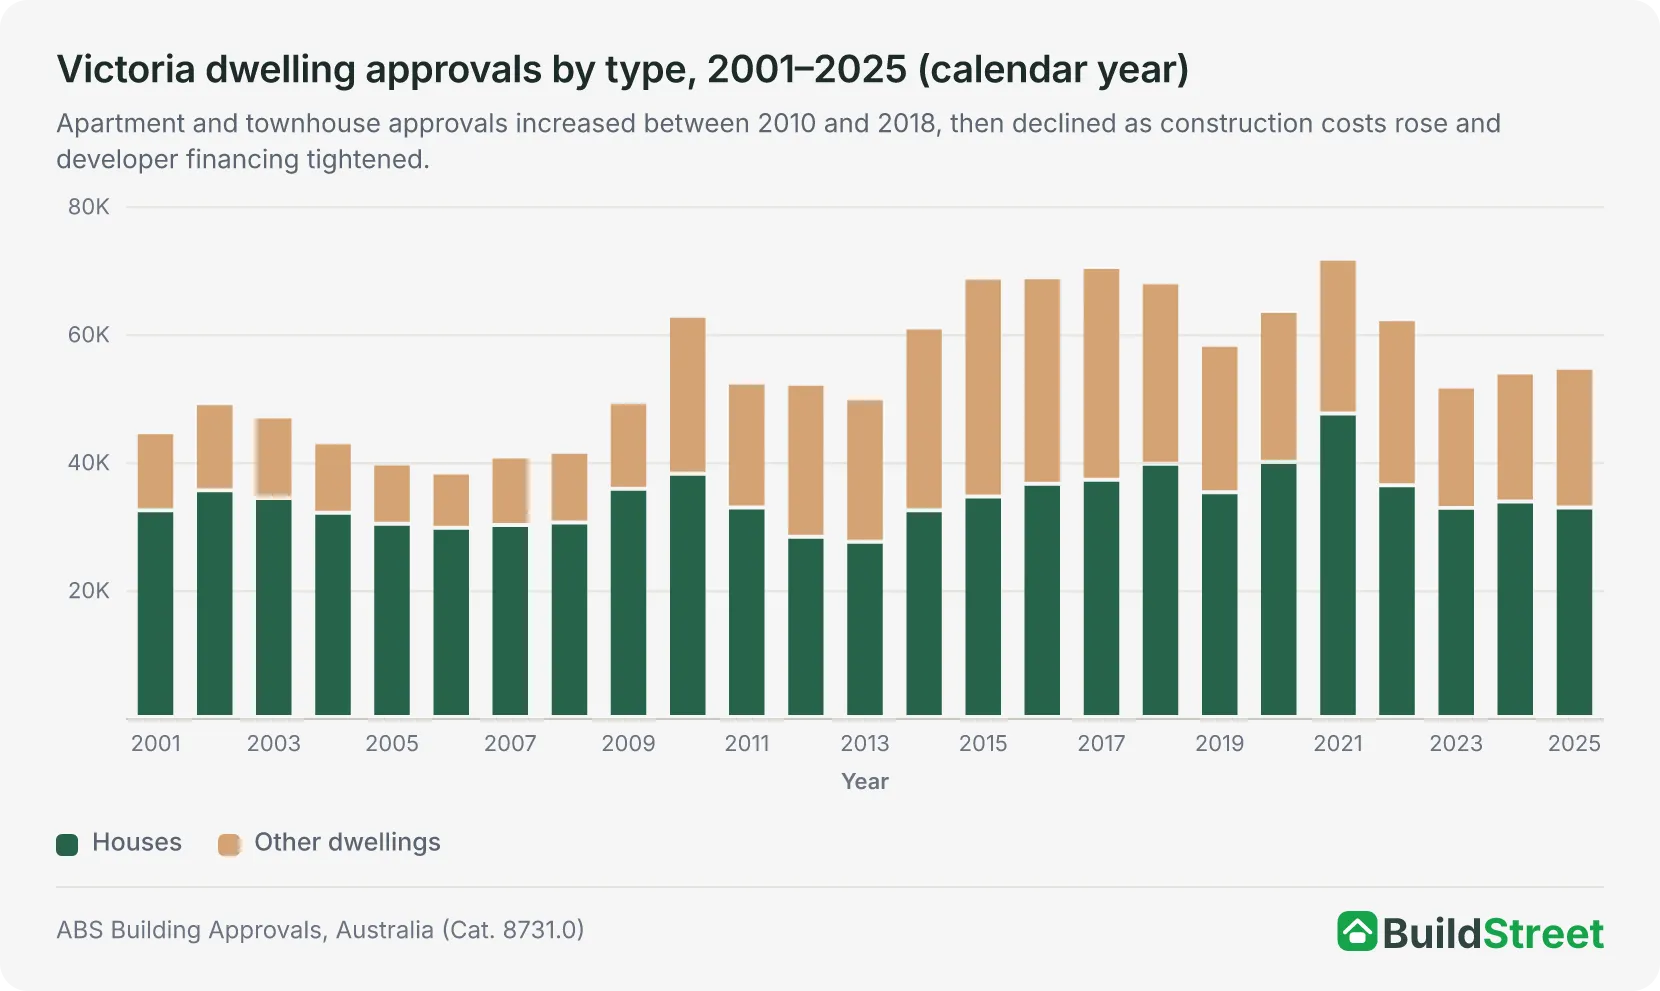
The mix of dwelling types has shifted over time. In 2001, detached houses made up 73% of all approvals. By 2015, apartments and townhouses had grown to match houses at roughly 50% each. In 2025, houses accounted for about 60% of approvals, as higher-density approvals pulled back after the 2017–18 peak and detached housing activity recovered.
| Financial year | Houses | Other dwellings | Total approvals | % of 61,200 Accord pace |
|---|---|---|---|---|
| FY2017–18 | 39,622 | 36,208 | 75,830 | 124% |
| FY2018–19 | 36,839 | 23,493 | 60,332 | 99% |
| FY2019–20 | 36,319 | 24,183 | 60,502 | 99% |
| FY2020–21 | 46,637 | 22,081 | 68,718 | 112% |
| FY2021–22 | 39,978 | 26,199 | 66,177 | 108% |
| FY2022–23 | 34,197 | 21,247 | 55,444 | 91% |
| FY2023–24 | 33,480 | 18,441 | 51,921 | 85% |
| FY2024–25 | 32,846 | 23,811 | 56,657 | 93% |
| FY2025–26 | 34,421 | 21,377 | 55,798 | 91% |
Source · ABS Building Approvals, Australia (Cat. 8731.0), July 2026 release.
July approvals show uneven momentum
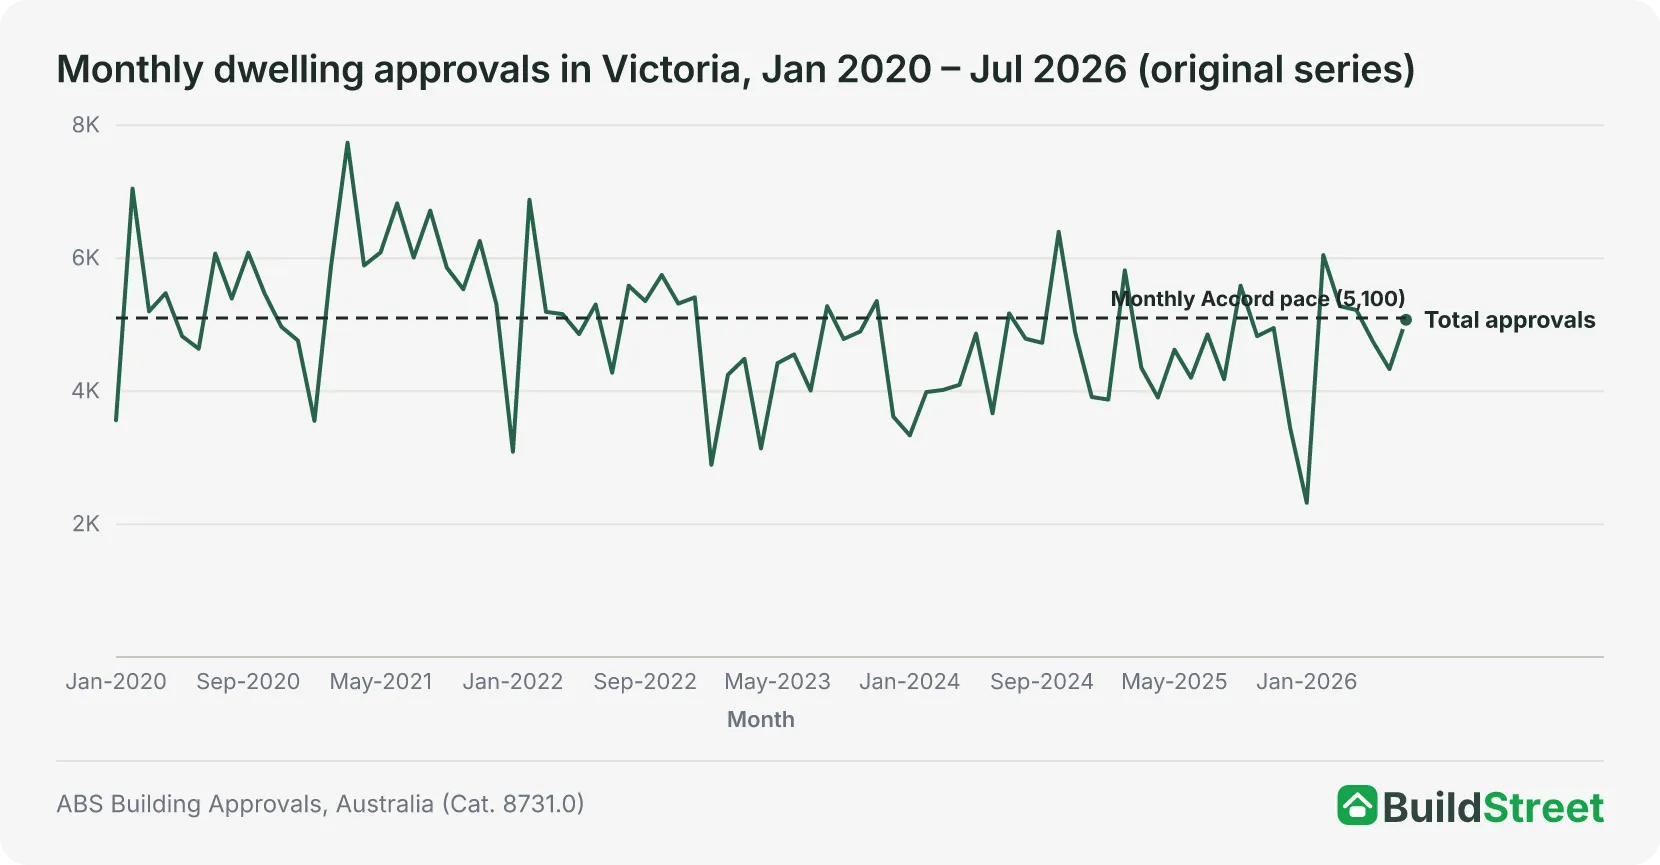
In July 2026, Victoria recorded 5,075 dwelling approvals, up from 4,854 in July 20253. That was an increase of about 5% over the year.
The monthly benchmark for Victoria's Accord allocation is about 5,100 approvals. July 2026 was just below that level, and monthly approvals can move around sharply, so one month is not enough to confirm a sustained trend.
Section 03 · Completions
How many homes are being completed in Victoria?
Victoria completed 56,383 dwellings in 2024–25, equal to 92% of the 61,200 annual pace implied by its Accord allocation. That is the lowest financial year completion total since 2014–15, and below the record of 66,189 completions in 2017–18.
Completions are the measure of housing supply, because a home is not available to live in until it is finished. Approvals and commencements show what has been planned or started; completions show what has been delivered.
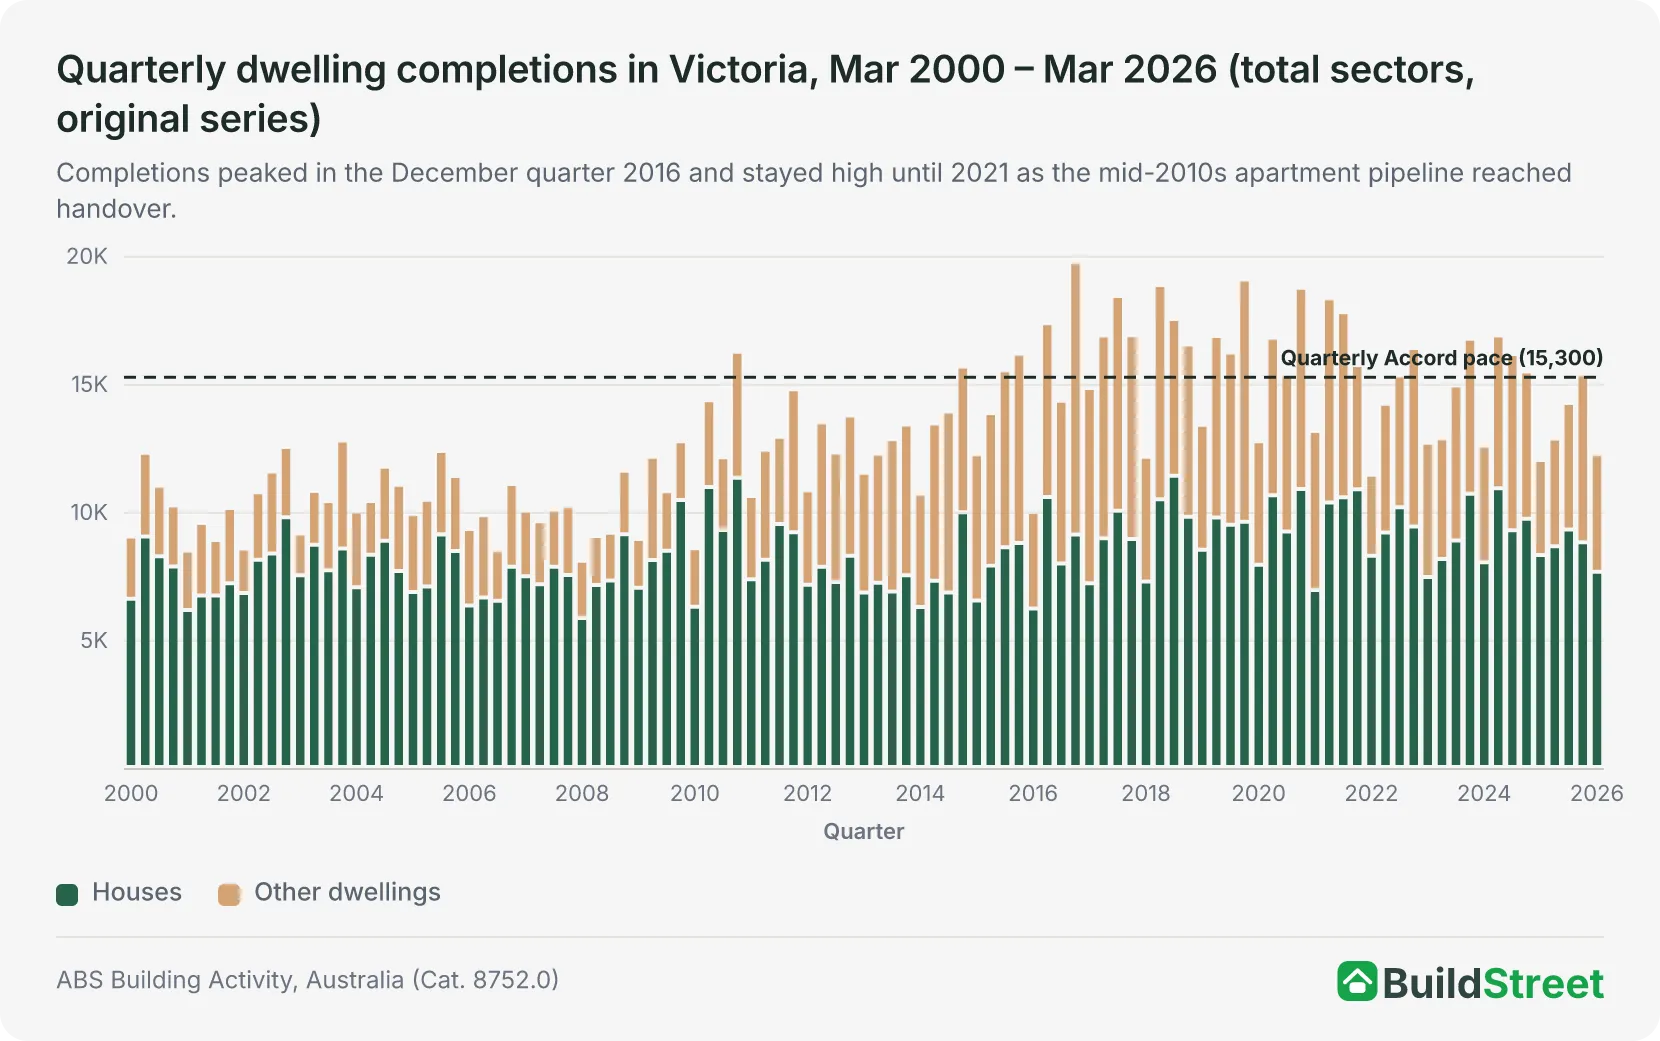
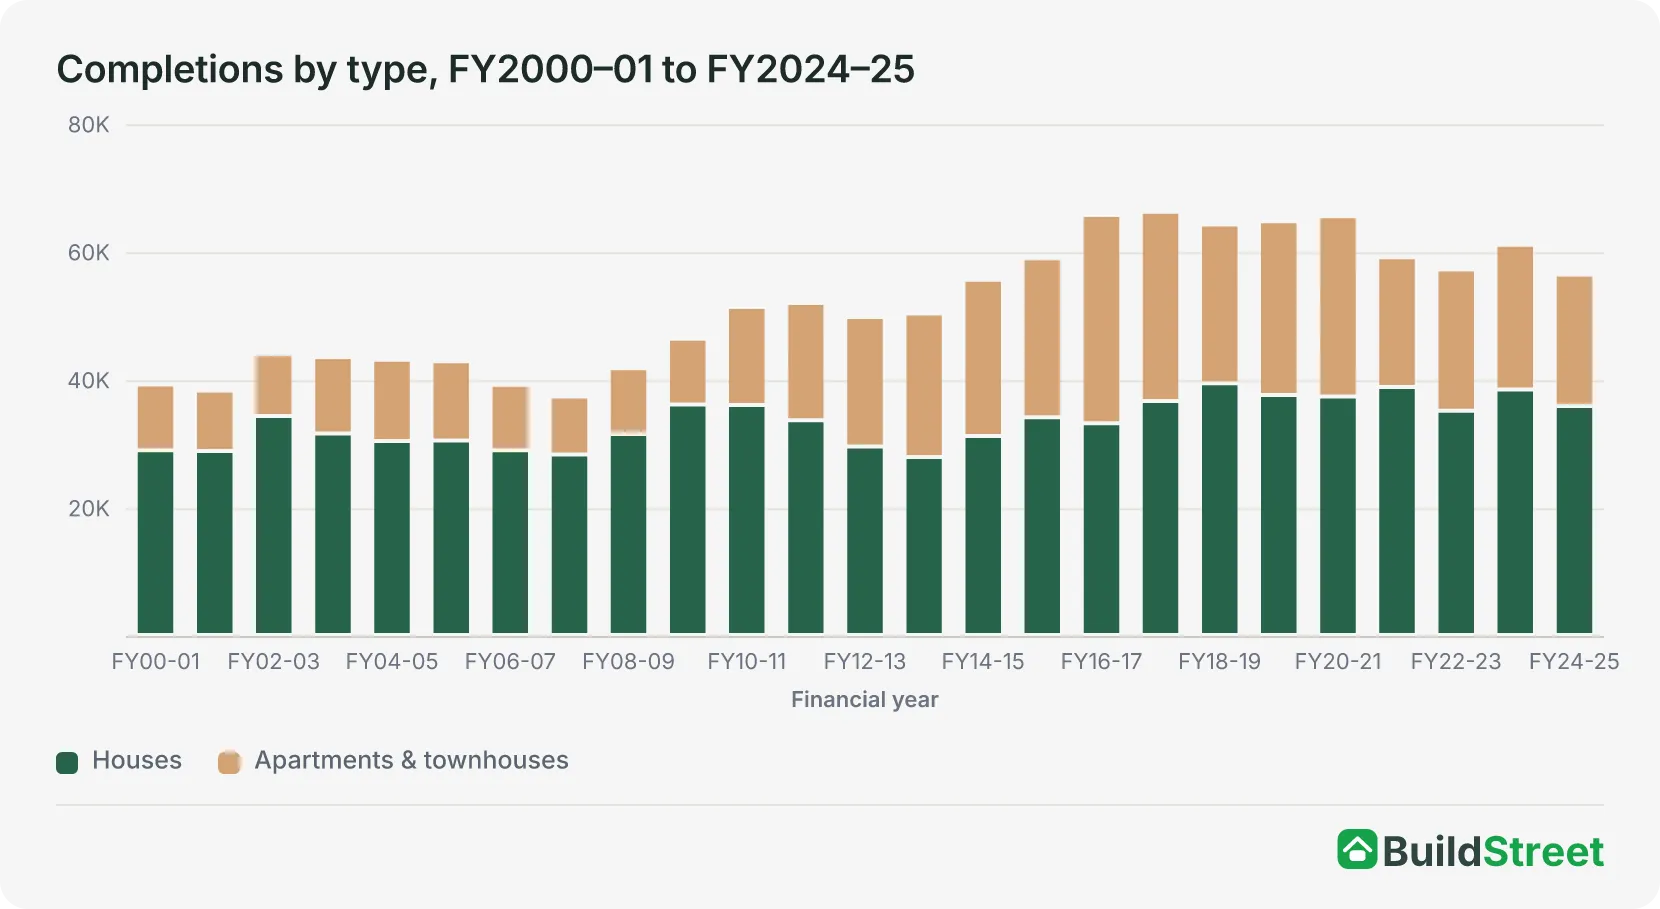
Victoria's completions rose between 2014–15 and 2017–18 as apartments approved in 2012 to 2017 reached handover. At the peak in 2016–17, 32,535 apartments and other attached dwellings were completed, more than three times the level of a decade earlier.
Once that pipeline cleared, total completions fell. In 2024–25:
- Apartment and other dwelling completions reached 20,553, down 37% from the 2016–17 peak of 32,535
- House completions reached 35,830, below the 2018–19 peak of 39,363
- Combined completions of 56,383 represent 92% of the 61,200 annual Accord pace
House completions have stayed between about 28,000 and 39,000 a year throughout the period. The apartment component has driven the overall decline.
| Financial year | Houses | Other dwellings | Total completions | % of 61,200 Accord pace |
|---|---|---|---|---|
| FY2016–17 | 33,135 | 32,535 | 65,670 | 107% |
| FY2017–18 (peak) | 36,602 | 29,587 | 66,189 | 108% |
| FY2018–19 | 39,363 | 24,833 | 64,196 | 105% |
| FY2019–20 | 37,546 | 27,164 | 64,710 | 106% |
| FY2020–21 | 37,300 | 28,172 | 65,472 | 107% |
| FY2021–22 | 38,786 | 20,268 | 59,054 | 96% |
| FY2022–23 | 35,078 | 22,075 | 57,153 | 93% |
| FY2023–24 | 38,385 | 22,621 | 61,006 | 99.7% |
| FY2024–25 | 35,830 | 20,553 | 56,383 | 92% |
Source · ABS Building Activity, Australia (Cat. 8752.0), Table 39, March quarter 2026.
Section 04 · Melbourne pipeline
Melbourne housing approvals, targets and pipeline
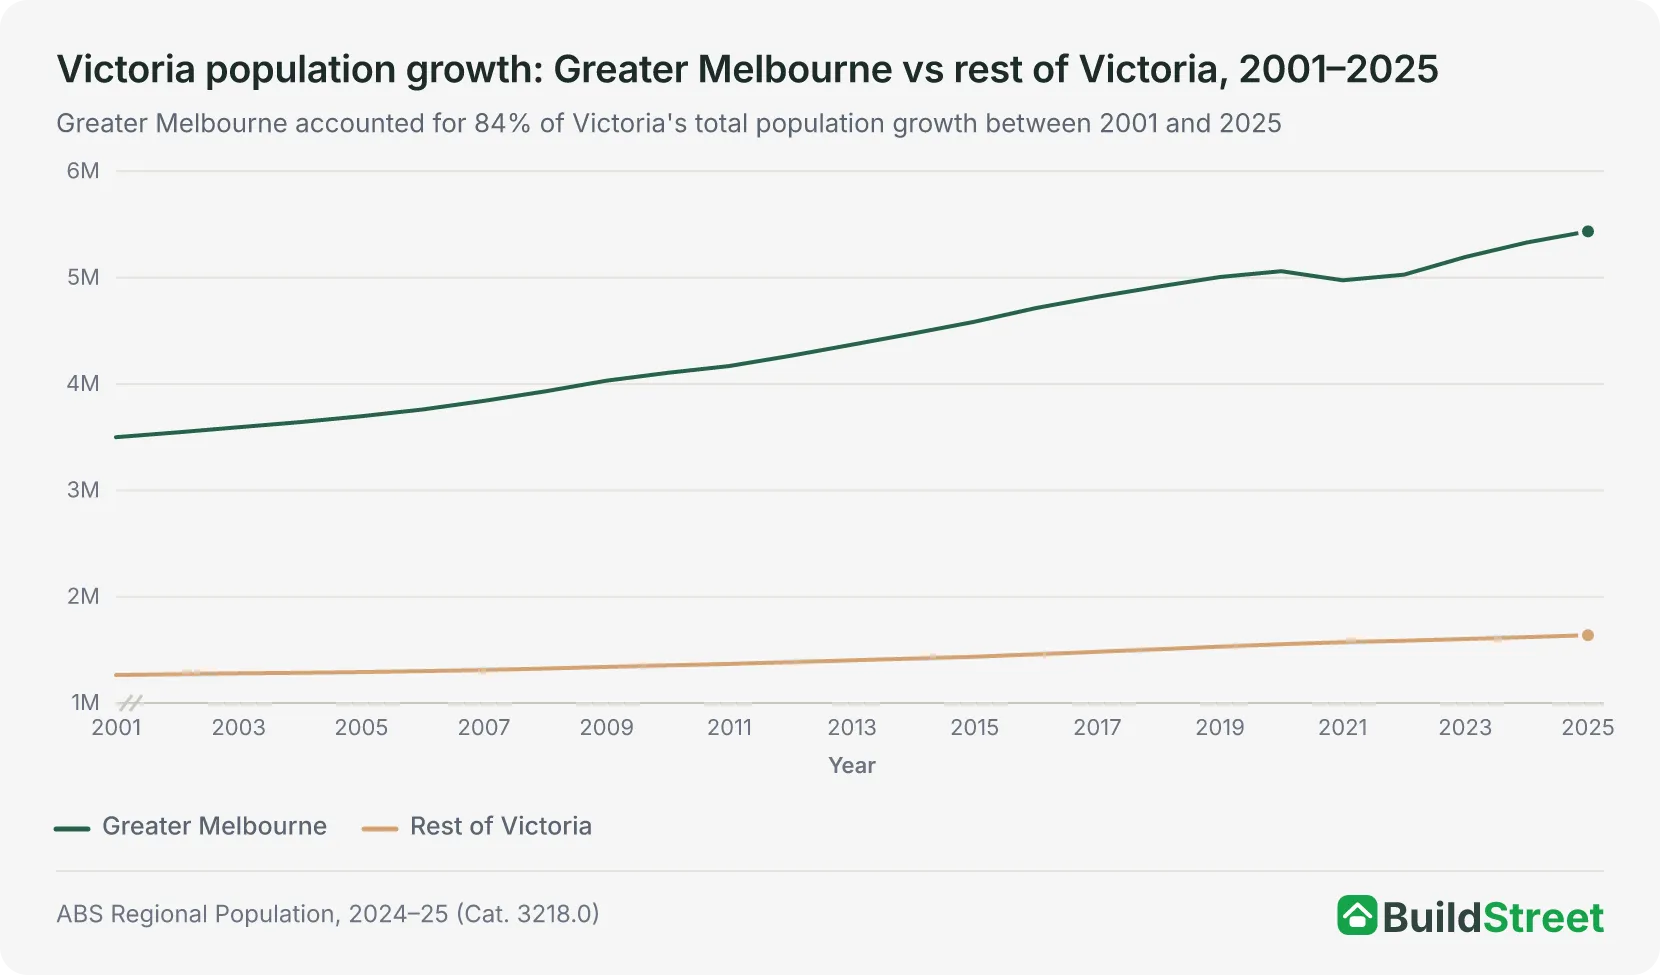
Greater Melbourne is home to 5.4 million people, about 77% of Victoria's total population, and has grown by more than 1.9 million residents since 2001, an increase of 55%.
Growth is not even across the city: outer growth corridors in the west and north have added population at a faster rate, while established middle-ring suburbs have grown more slowly.
Plan for Victoria assigns specific housing targets to every local government area in the state. The City of Melbourne has been allocated 119,500 additional dwellings by 2051, entirely through infill development. Outer-growth LGAs like Melton (109,000) and Wyndham (99,000) carry larger totals but are expected to meet most of them through greenfield expansion.
Selected Melbourne councils reflect three main housing growth strategies: inner-city infill, outer greenfield expansion and lower-growth areas with development constraints.
Melton: greenfield growth
341% — Population growth since 2001, 52,500 → 231,500 residents
Boroondara: density mandate
65,500 — New homes required by 2051. All must be built on already-developed land
| LGA | Target dwellings (to 2051) | Infill (non-greenfield) | Greenfield | Growth type |
|---|---|---|---|---|
| City of Melbourne | 119,500 | 119,500 | 0 | Infill only |
| Melton | 109,000 | 5,000 | 104,000 | Predominantly greenfield |
| Wyndham | 99,000 | 25,000 | 74,000 | Mixed, greenfield dominant |
| Casey | 87,000 | 28,500 | 58,500 | Mixed, greenfield dominant |
| Hume | 79,000 | 25,500 | 53,500 | Mixed, greenfield dominant |
| Whitehorse | 76,500 | 76,500 | 0 | Infill only |
| Boroondara | 65,500 | 65,500 | 0 | Infill only |
| Nillumbik | 6,500 | 6,500 | 0 | Constrained (Green Wedge) |
Source · DTP Victoria, Plan for Victoria ‑ Metropolitan LGA housing targets, February 2025.
Victoria's council targets show two different paths for housing growth. Established inner and middle-ring suburbs are expected to add more homes through infill development, including townhouses, apartments and mixed-use projects. Outer-growth areas are expected to deliver more housing through greenfield expansion on undeveloped land.
Boroondara shows the infill challenge. It has around 178,000 residents, limited undeveloped land and a target of 65,500 additional homes by 2051. Most of that growth would need to come from higher-density housing near tram, rail and activity corridors.
Melton shows the greenfield model. Its population has grown from about 52,500 in 2001 to more than 231,500 in 2025, a rise of 341%. Its target of 109,000 dwellings is mainly expected to come from greenfield expansion, with only 5,000 homes designated as infill.
The Suburban Rail Loop East is also being linked to future housing supply. New Priority Residential Zones across the six SRL East station precincts are intended to support around 70,000 dwellings close to major transport.
Section 05 · Regional Victoria
Regional Victoria housing growth and supply pressures
Victoria's housing challenge is not limited to Greater Melbourne, but regional demand is uneven.
Outside Greater Melbourne, Victoria's population grew from roughly 1.26 million in 2001 to 1.64 million in 2025, an increase of about 30%. Growth varies by location. Areas within commuting distance of Melbourne have grown at a faster rate, while more remote regional centres have grown at a slower rate or remained stable.
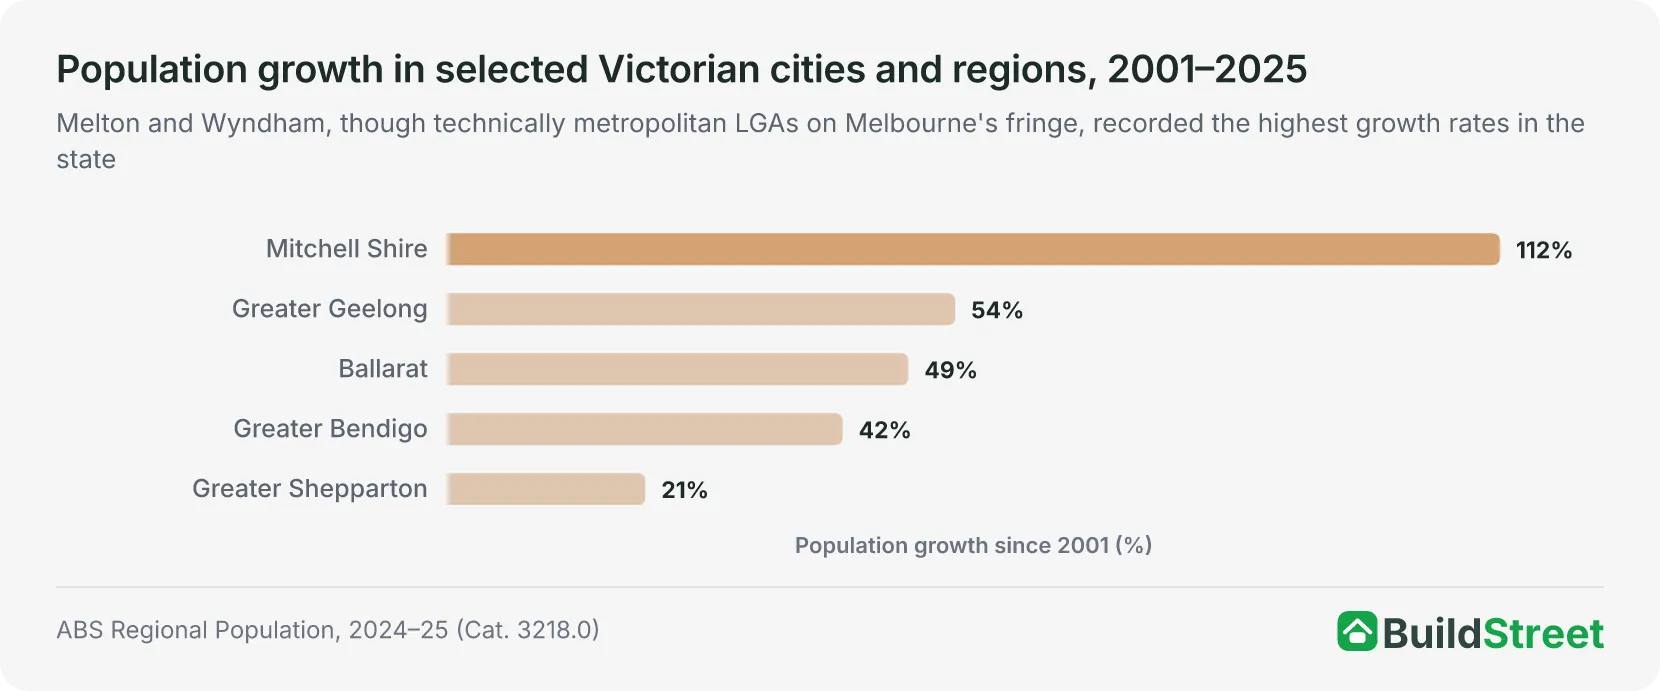
Plan for Victoria allocates 425,600 new dwellings to regional and rural LGAs by 2051, about 19% of the state's total long-term requirement. The targets vary by location, growth pattern and local constraints.
- Mitchell Shire carries the largest regional target at 66,000 homes, of which 56,000 are greenfield. Mitchell sits along the Hume Freeway corridor and functions as an extension of Melbourne's northern growth corridor.
- Ballarat is expected to deliver 46,900 dwellings, with 28,000 as infill within the existing urban footprint and 18,900 as greenfield.
- Queenscliffe carries the smallest target at 400 dwellings to 2051, reflecting its environmental and heritage constraints.
| Regional LGA | Target (to 2051) | Non-greenfield | Greenfield |
|---|---|---|---|
| Mitchell | 66,000 | 10,000 | 56,000 |
| Ballarat | 46,900 | 28,000 | 18,900 |
| Baw Baw | 25,700 | n/a | n/a |
| Moorabool | 20,000 | n/a | n/a |
| Bass Coast | 19,250 | n/a | n/a |
| Greater Shepparton | 15,250 | n/a | n/a |
| Latrobe | 13,000 | n/a | n/a |
| Queenscliffe | 400 | n/a | n/a |
Source · DTP Victoria, Plan for Victoria ‑ Regional LGA housing targets, February 2025.
Under the Development Facilitation Programme, projects worth at least $15 million in regional Victoria qualify for state-level planning consideration, compared to the $50 million threshold in Melbourne, provided at least 10% of dwellings are classified as affordable. The lower threshold is intended to attract developers to regional areas.
Section 06 · Housing mix
How has Victoria's housing mix changed?
Victoria's housing mix has changed over time, shifting from detached-house dominance in the early 2000s to a stronger apartment and townhouse pipeline in the mid-2010s, before house approvals rose again after 2020.
Houses made up 73% of all dwelling approvals in Victoria in 2001. By 2015, apartments and townhouses had grown to roughly half of approvals, bringing the split close to 50/50. By 2025, houses accounted for 60% of approvals.
Two factors helped shift the mix back toward houses. Apartment approvals fell after their 2017-18 peak, as construction costs rose and developer financing became tighter. The HomeBuilder programme also lifted detached-house contracts temporarily in 2020–21, before demand returned closer to pre-stimulus levels.
Knock-down rebuilds are the primary mechanism for increasing density in established suburbs. Victoria has recorded 70,570 dwellings approved through knock-down rebuild projects in recent years, second only to New South Wales nationally.
Average yields per site depend on the replacement type:
- Apartment block replacement: average of 9.5 new dwellings per site
- Townhouse replacement: average of 3.0 dwellings per site
Homeowners can also build a second dwelling of up to 60 square metres in their backyard without a council planning permit, provided the block is at least 300 square metres and free of environmental overlays. Around 700,000 existing lots are estimated to be eligible. If 5% of eligible owners build, that would add approximately 35,000 dwellings without any new land being acquired.
Section 07 · The supply gap
Victoria's supply gap and forward pipeline
Victoria's housing target depends on completions, not just approvals. The gap is clearest when recent completion levels are compared with the annual delivery pace implied by the Accord.
Victoria exceeded the 61,200-home annual pace for five consecutive years, from 2016–17 to 2020–21. Completions peaked at 66,189 in 2017–18 and have eased since then, apart from a recovery to 61,006 in 2023–24.
In 2024–25, Victoria completed 56,383 dwellings, equal to 92% of the Accord pace and the lowest annual result in a decade. From July 2024 to March 2026, completions reached about 98,200, or 32% of the 306,000 allocation, slightly behind the 35% of the Accord period that has passed.
Victoria National Housing Accord progress
Annual dwelling completions against the 61,200-a-year pace implied by Victoria's Accord allocation of 306,000 homes by June 2029. The timeline marker shows how far through the Accord period Victoria is (44.9%). Completions to June 2025, the latest full financial year.
Sep 2026
- FY23-2461,006
- FY24-2556,383
— Accord pace: 61,200
Completions held up better than approvals over these two years, as homes approved in earlier, stronger years were finished: in 2023–24, 61,006 homes were completed against 51,921 approvals. Over the longer run, the gap between approvals and completions reflects:
- The time lag between approval and handover (typically 12 to 24 months)
- Projects that commence but stall before completion
- Builder insolvencies that leave buildings partly constructed
Residential building output prices have risen above 5% per year in recent periods. Projects approved at one cost point may not be viable to build by the time they reach the construction stage. Apprenticeship completion rates have also declined, which may reduce the supply of skilled tradespeople. The data does not isolate any single cause.
The number of dwellings under construction is a forward indicator for completions. At March 2026, 61,641 dwellings were under construction in Victoria, down 17% from a peak of 74,167 in March 20224. Without an increase in commencements, completions are unlikely to return to the Accord pace.
At March 2026, only 3,797 dwellings had been approved but not yet broken ground, compared with 11,407 at December 20175. This suggests the main pressure is earlier in the pipeline, with fewer new projects being approved to replace those already under construction.
Two policy measures are focused on existing housing stock rather than new construction:
- A 7.5% Short Stay Levy on short-term rental revenue6, intended to shift more homes into the long-term rental market
- Rental tenancy reforms, including a ban on rental bidding and a 90-day notice period for rent increases, which provide tenant protections but do not add new dwellings.
To reach the 61,200 annual Accord pace, Victoria needs to increase its 2024–25 completion rate of 56,383 by around 9%. The record year of 2017–18, at 66,189 completions, exceeded the Accord pace, but has not been sustained. A recovery would require growth in both house completions and the apartment pipeline, against current construction cost levels and labour supply constraints.
Section 08
Victoria housing supply trends since 2000
Victoria's housing supply data shows how approvals, commencements and completions have moved through different cycles since 2000–01. The long-term figures show when approvals lifted, when projects moved into construction and when completed homes were finally delivered.
The data also shows how Victoria's housing mix has changed over time. Detached houses made up a larger share of activity in the early 2000s, while apartments and townhouses became more important during the mid-to-late 2010s. More recent years show a weaker apartment pipeline and a larger detached-house share of approvals.
References
- Treasury, National Housing Accord · treasury.gov.au ↑
- Department of Transport and Planning (Vic), Plan for Victoria — Housing targets · planning.vic.gov.au ↑ b
- ABS Building Approvals, Australia, July 2026 — Table 13 (dwelling units approved, original, Victoria) · Australian Bureau of Statistics ↑
- ABS Building Activity, Australia, March 2026 — Table 77 (dwelling units under construction, states) · Australian Bureau of Statistics ↑
- ABS Building Activity, Australia, March 2026 — Table 80 (dwellings approved but not yet commenced, states) · Australian Bureau of Statistics ↑
- State Revenue Office Victoria, Understanding the short stay levy · sro.vic.gov.au ↑
- ABS Building Approvals, Australia (latest release, Cat. 8731.0) · Australian Bureau of Statistics
- ABS, Building Activity, Australia (latest release, Cat. 8752.0) · Australian Bureau of Statistics
- ABS: Regional Population, 2024–25 · Australian Bureau of Statistics
- DTP Victoria, Plan for Victoria — LGA housing targets, February 2025 · planning.vic.gov.au
- Victorian Government, Victoria's Housing Statement — The decade ahead 2024–2034 · vic.gov.au
- Victorian Building Authority, Annual Report 2023–24 · vba.vic.gov.au
- ABS Producer Price Indexes, Australia (Cat. 6427.0) — latest release · Australian Bureau of Statistics
- NHSAC State of the Housing System, 2025 · nhsac.gov.au
