

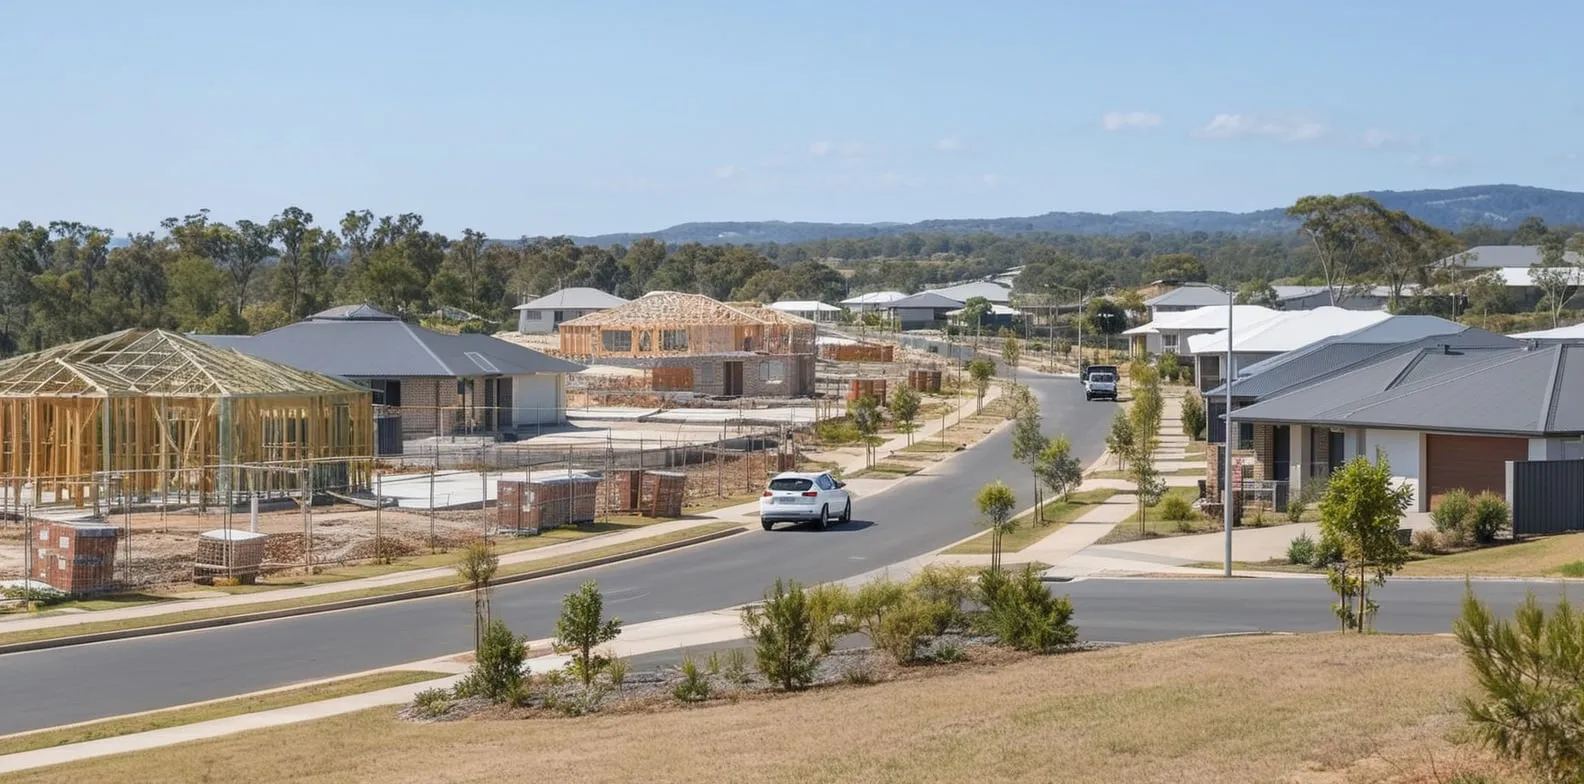
Published 26 May 2026 · Updated 28 Sept 2026
Queensland approved 42,502 dwellings in 2025, up 14.0% on 2024 and the strongest result since 2021. More than half of those approvals were in Greater Brisbane, showing how heavily the state's pipeline depends on South East Queensland.
Approvals are not yet turning into finished homes fast enough. Queensland commenced 41,625 dwellings in 2025 but completed 32,977, leaving an 8,648-home gap between starts and completions. The state's one-million-home target requires a delivery pace of roughly 50,000 homes a year, a level Queensland has not yet consistently achieved.
 NSW housing supply statistics: is the state building enough homes?New South Wales is projected to fall about 119,000 homes short of its Housing Accord target by June 2029 and is not expected to reach it until March 2032, almost three years late. The state needs to b…
 Can Victoria meet its housing target? Approvals, completions and supply gapsVictoria completed 56,383 dwellings in 2024–25, the lowest annual total in a decade and about 4,800 below the 61,200 a year needed to meet its Housing Accord share. Since the Accord began in July 2024…
Section 01 · SEQ DOMINANCE
Why South East Queensland dominates housing growth
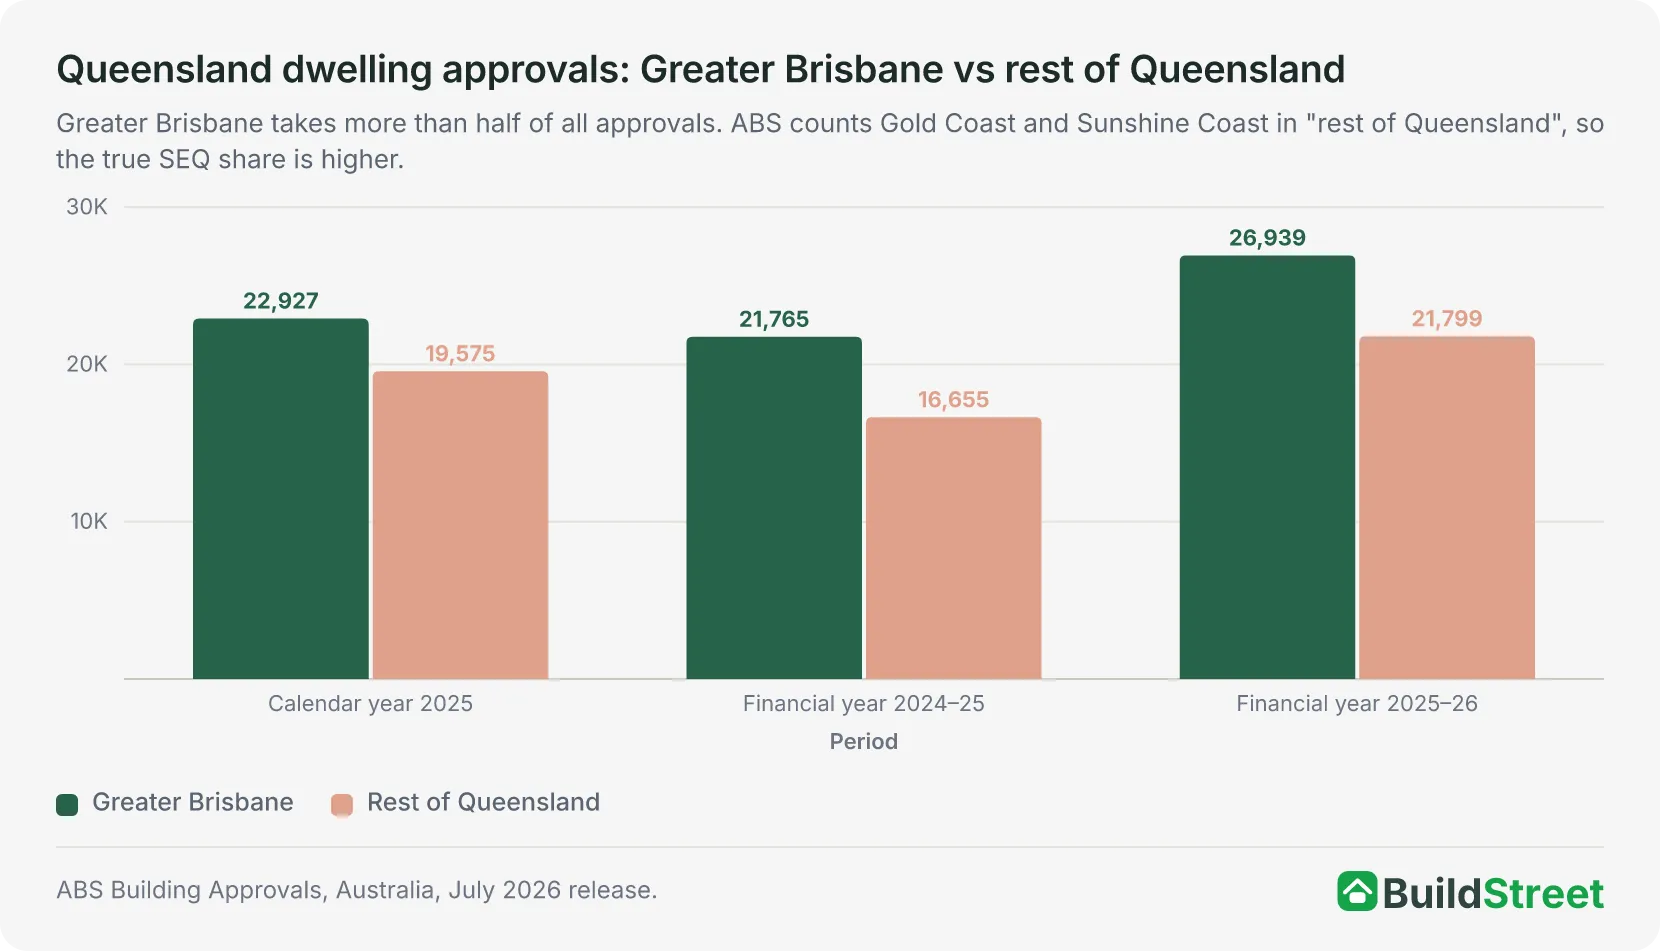
Greater Brisbane accounted for 53.9% of Queensland's dwelling approvals in 2025. But this does not show the full scale of growth in South East Queensland. The Gold Coast and Sunshine Coast are counted as "rest of Queensland" in ABS data, even though they are part of the wider coastal growth corridor.
South East Queensland has grown faster than the rest of the state every year since 1992. Growth became even stronger after the pandemic. In 2022–23, the region's population grew by 3.0%, the fastest rate on record1. Over the previous decade, the rest of Queensland grew by just 0.7% a year on average.
Growth is coming from both interstate and overseas migration. Many people moving from other states are choosing South East Queensland for jobs, lifestyle and lower housing costs than Sydney and Melbourne. Overseas migration has also risen sharply. Queensland received 87,954 net overseas migrants in the year to September 2023, up 170% on pre-COVID levels. Most settled in the south-east.
In 2024–25, Queensland's six largest local government area (LGA) population gains were all in South East Queensland. Brisbane added 21,464 people, followed by Logan (11,949), the Gold Coast (11,944), Moreton Bay (10,951), Ipswich (9,138) and the Sunshine Coast (7,659)2.
Seven of Queensland's ten most populated LGAs are also in South East Queensland. Queensland's centre of population also shifted 1.5 kilometres south-east in 2024–25, reflecting strong growth in South East Queensland.3
Gold Coast: overseas migration is driving growth
Overseas migration drove 77% of Gold Coast population growth in 2023–24. The city had 691,230 residents at June 2025 and is projected to reach over one million people by 2046, a 54% increase from its 2021 base. That is a larger projected gain than any other SA4 outside Greater Brisbane. It shows that Gold Coast housing demand is likely to remain a long-term pressure, rather than a short-term cycle.
Sunshine Coast: people moving for lifestyle, not work
The Sunshine Coast is growing mainly through internal migration, people relocating from other states and from within Queensland rather than from overseas. The LGA had 381,957 residents at June 2025 and added 7,659 in the year. Population projections put the SA4 at 611,513 by 2046, up from 403,521 in 2021. This type of growth tends to support more demand for lower-density housing, rather than the high-rise apartment pipeline seen on the Gold Coast.
Section 02 · WESTERN CORRIDORS
Western growth corridors: Ipswich, Logan and Moreton Bay
Ipswich was Queensland's fastest-growing LGA in 2024–25 at 3.5%2. Logan has the largest dwelling pipeline of any Queensland council, with 103,415 expected dwellings as at June 20264. Moreton Bay also added 10,951 residents in 2024–25 and is home to Waraba, Queensland's largest active Priority Development Area. These western and south-western corridors are taking on more of the state's housing task. They are also where the gap between approved lots and finished homes has been most persistent.
Priority Development Areas approved 8,003 dwellings in 2024–25, up 15% year-on-year5. They now account for about half of South East Queensland's greenfield supply.
The state's facilitated development pathway also received more than 150 expressions of interest in the first half of 2024. These projects could deliver around 30,000 dwellings across Queensland. This activity is helping move greenfield land through the approval process. However, most of the supply is still new outer-suburban land rather than infill.
Lot sizes are also shrinking as land is used more efficiently. In Greater Brisbane, the average site area for approved new houses fell from 571 square metres in 2012 to 459 square metres in 2021, a 20% reduction.
Section 03 · APPROVALS CYCLE
Queensland's approvals cycle: a decade of volatility
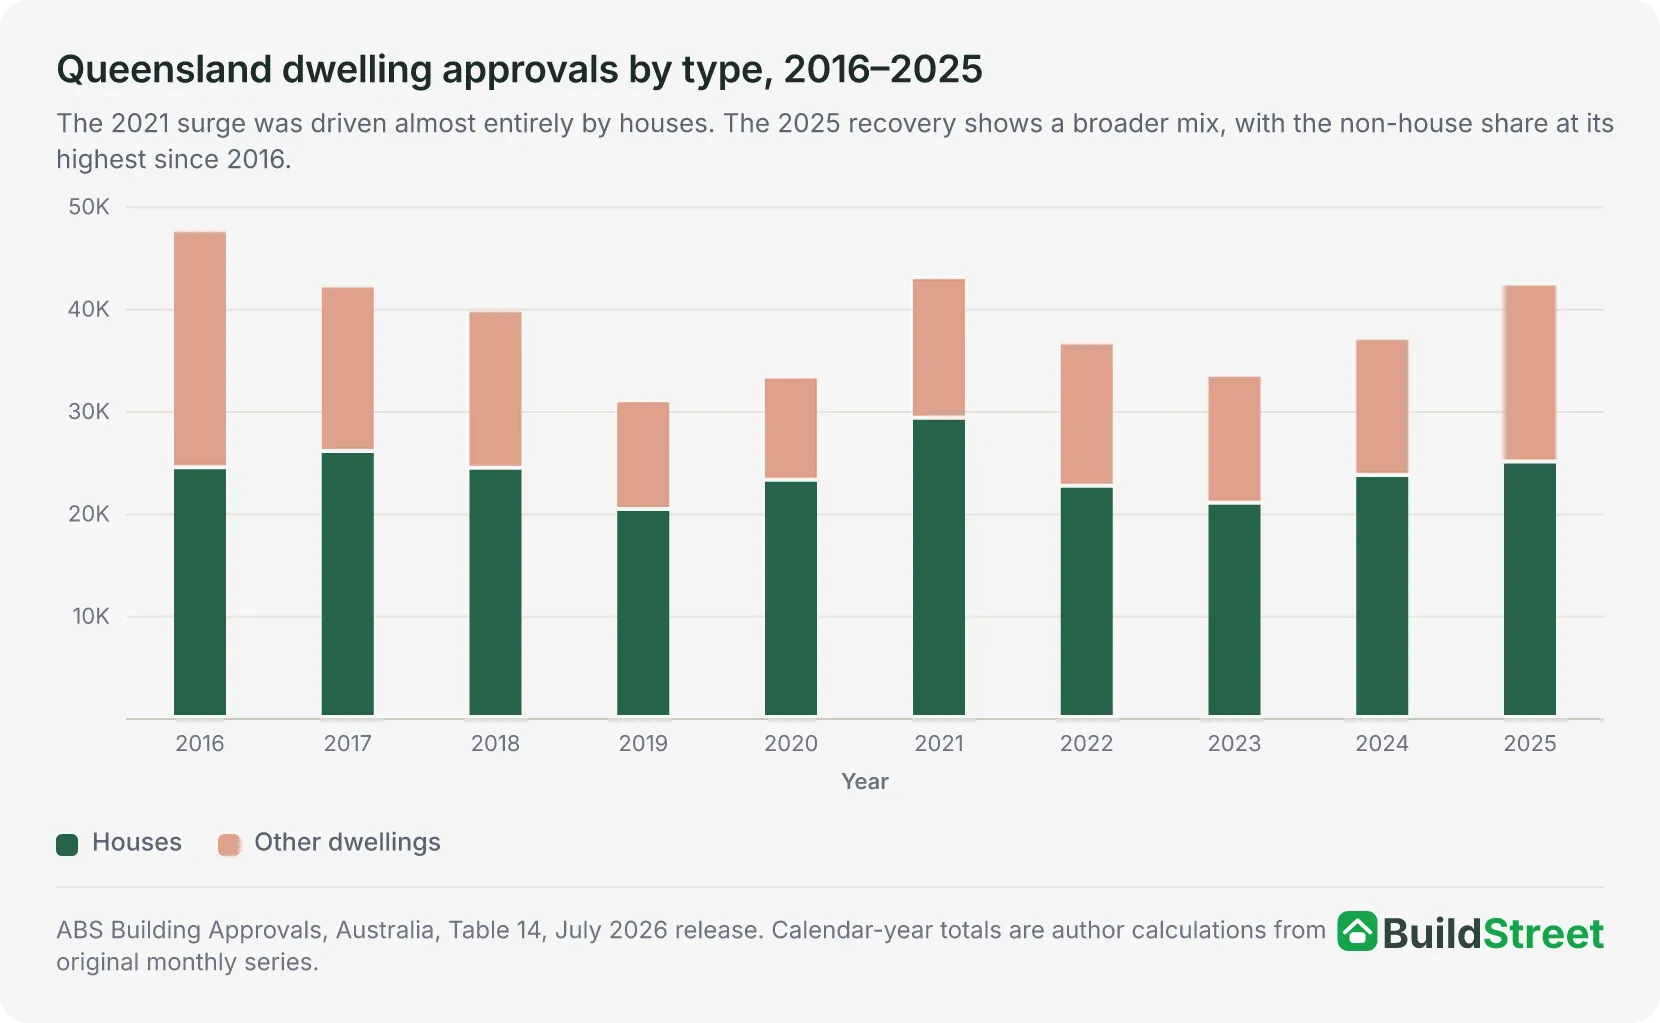
Queensland's approvals peaked at 47,781 in 2016, fell to 31,106 in 2019, rose again to 43,115 in 2021 following the federal HomeBuilder stimulus, then fell again before the current recovery. The 2025 total of 42,502 is the strongest since 2021, though still below the 2016 high.
The main difference between the 2025 recovery and the 2021 increase is the dwelling mix. The 2021 lift was concentrated in detached houses. The 2025 recovery includes a clearer return of apartments and townhouses, with the non-house share rising more strongly than at any point since 2016. That matters because detached houses alone are unlikely to absorb the scale of population growth forecast in western corridors and inner-city areas where land is becoming scarcer.
2016
47,781
Cycle peak. Non-house approvals at 23,176, the decade high. Overseas investor demand and low interest rates drove a concentrated apartment pipeline in inner Brisbane that took years to complete and created localised oversupply.
2019
31,106 (−22.0%)
Cycle trough. Non-house approvals fell to 10,629 as developers pulled back on new projects. Tighter credit conditions, falling land values and the aftermath of apartment oversupply all weighed on the pipeline at the same time.
2021
43,115 (+29.0%)
HomeBuilder surge, but mostly detached houses. The federal stimulus pushed house approvals to 29,248, the highest since 2016. Non-house approvals also rose, from 10,089 to 13,741, but houses drove most of the increase. The recovery was concentrated in houses, adding to the cost and labour pressures that followed.
2022–23
33,650–36,794
Post-stimulus correction. Rate rises, construction cost blowouts and builder insolvencies all weighed on new approvals. The backlog from 2021 was still moving through the system while new projects were harder to make financially viable.
2025
42,502 (+14.0%)
A broader recovery. Houses at 24,984 and other dwellings at 17,379, the strongest attached-dwelling result since 2016. With 9,999 apartment approvals in buildings of four storeys or more, higher-density supply is back in the pipeline.
Source · ABS Building Approvals, Australia, Table 14, July 2026 release. Annual changes are year-on-year comparisons.
Section 04 · APARTMENTS
Why did apartment approvals slow after 2016?
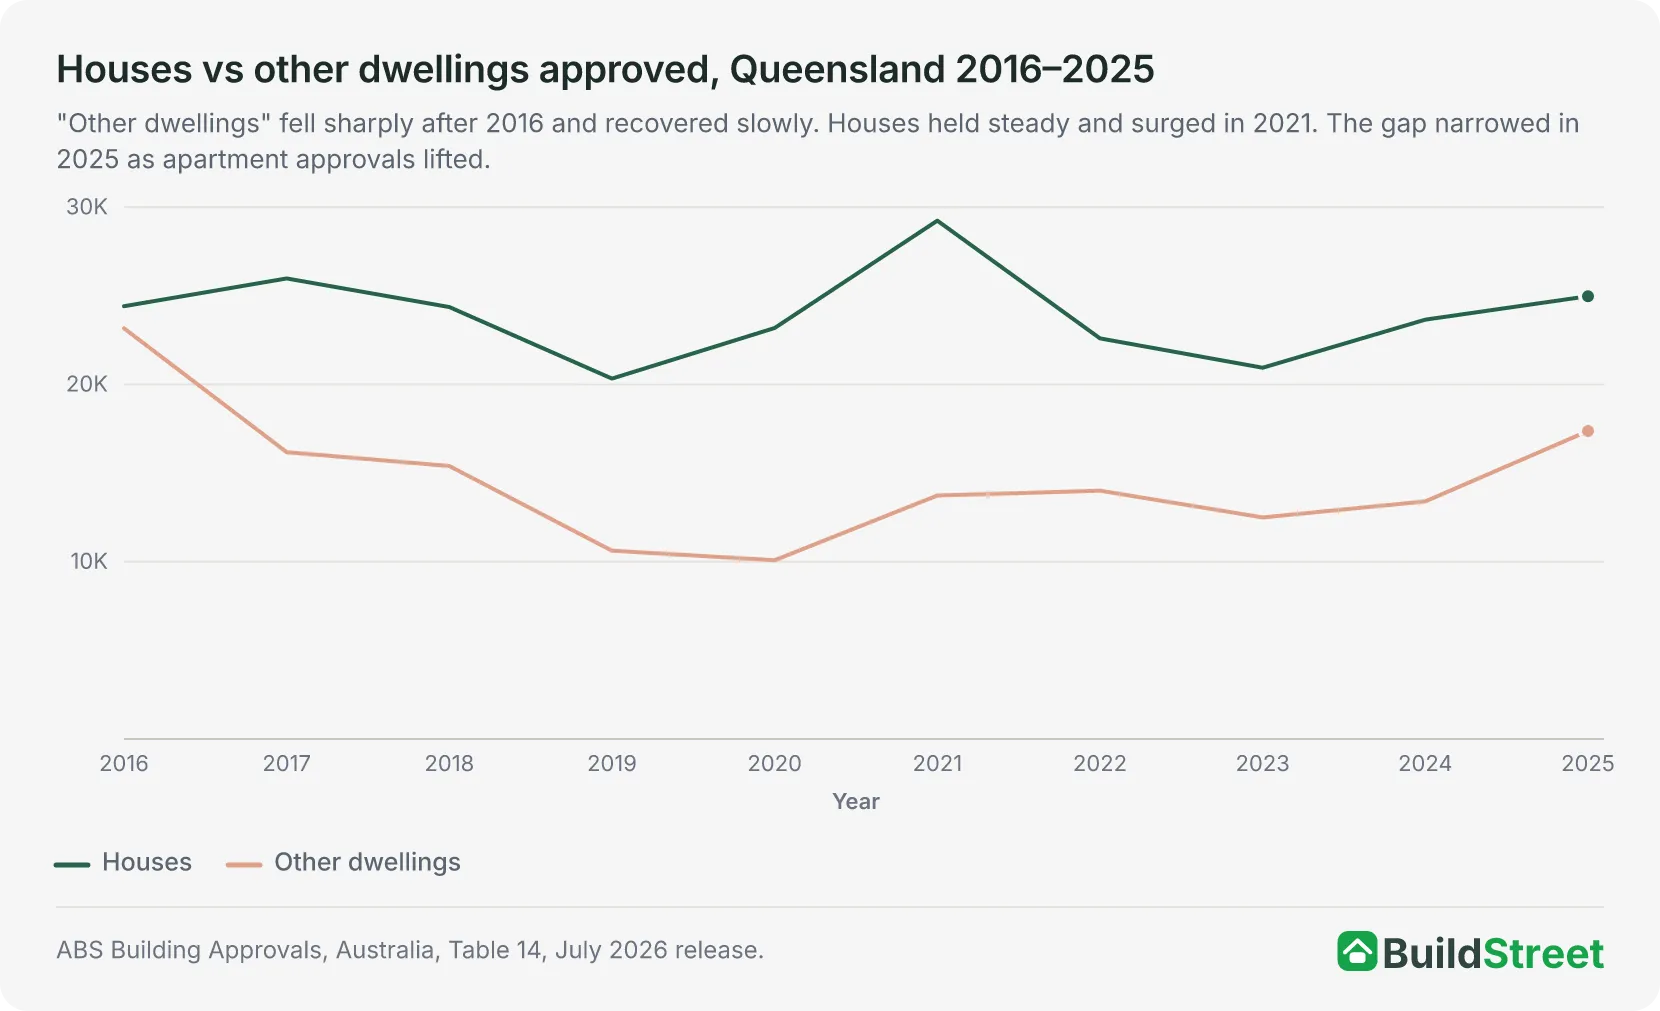
Other dwelling approvals, covering townhouses, terraces and apartments, fell from 23,176 in 2016 to 10,629 in 2019, a 54% drop in three years. By 2023 they had only partially recovered to 12,505. The 2025 figure of 17,379 is the strongest since 2016, but the apartment share of Queensland's total pipeline is only just returning to levels that were common a decade ago.
Three factors drove the decline and have continued to limit apartment supply:
Feasibility
Rising construction costs, especially for mid-rise concrete buildings, have made some projects harder to deliver profitably. Mid-rise apartment projects cannot currently achieve a standard profit margin in any mainland capital city.
Pre-sales
Construction lenders require a minimum number of pre-sales before releasing finance. With buyers under pressure from higher interest rates, many developers have struggled to meet that threshold — stalling projects before they start.
Supply hangover
The 2016–17 boom flooded inner Brisbane with stock. Vacancy rates stayed high for several years, discouraging developers from launching new nearby projects. Builder insolvencies then made fixed-price contracts harder to secure.
Section 05 · DWELLING MIX
What is being built: the current dwelling mix
Of Queensland's 42,363 new residential dwelling approvals in 2025, houses accounted for 59.0%. Townhouses and semi-detached dwellings made up 14.3%, and apartments 26.7%. Townhouses, semi-detached homes and apartments made up 41.0% of approvals — the highest non-house share since 2016 — though detached houses still dominate.
Detached houses
59.0%
- Approvals (2025)
24,984
- Avg lot size, Gr. Brisbane (2021)
459 m²
- Avg lot size (2012)
571 m²
- Change in lot size
−20%
Townhouses & semi-detached
14.3%
- Approvals (2025)
6,067
- Primary delivery area
SEQ infill corridors
- Policy support
$350m Infill Fund
- ShapingSEQ infill target
100,000 near transport
Apartments
26.7%
- Approvals (2025)
11,312
- In buildings 4+ storeys
9,999
- In buildings 9+ storeys
6,003
- Share of total
26.7%
Source · ABS Building Approvals, Australia, Table 24, July 2026 release. Totals cover new residential buildings only, which is why the sum (42,363) differs slightly from the all-dwellings total (42,502). Average lot size data: ABS, New houses being built on smaller blocks.
Policy is pushing for more density. Homes for Queenslanders allocates a $350 million Incentivising Infill Fund and requires each council to meet mandatory targets by dwelling type, not just total numbers. ShapingSEQ 2023 sets a target of 900,000 new homes in South East Queensland by 2046, including 100,000 homes close to jobs and transport6. However, houses still accounted for nearly six in ten approvals in 2025, showing that detached housing remains the largest part of Queensland's current pipeline.
Section 06 · DELIVERY GAP
Is Queensland building enough homes each year?
Queensland completed 32,977 homes in 2025. The state's target implies around 50,000 a year. That gap of more than 17,000 homes is where the pressure lies. Approvals and commencements are trending up, but a home that is approved or started but not yet handed over does not house anyone.
The 50,100 dwellings under construction at March 2026 represent a large pipeline of future completions. However, a large pipeline has not always translated quickly into finished homes. The pattern since 2021 has been sustained gaps between starts and completions, driven by labour shortages, insolvencies and cost blowouts rather than a shortage of approved projects.
The same pressure is showing up nationally. Australia completed an estimated 177,000 homes in 2024 against underlying demand of around 223,000, a shortfall of roughly 68,000 homes once demolitions are counted7. No state or territory is on track to meet its share of the National Housing Accord's 1.2 million target by June 2029. The National Housing Supply and Affordability Council's 2026 outlook puts the national shortfall at around 220,000 homes.8 It now expects the target to be reached in the December quarter of 2030, with Queensland's share not complete until March 2031.9
Section 07 · LABOUR & DELAYS
Construction labour shortages and delivery delays
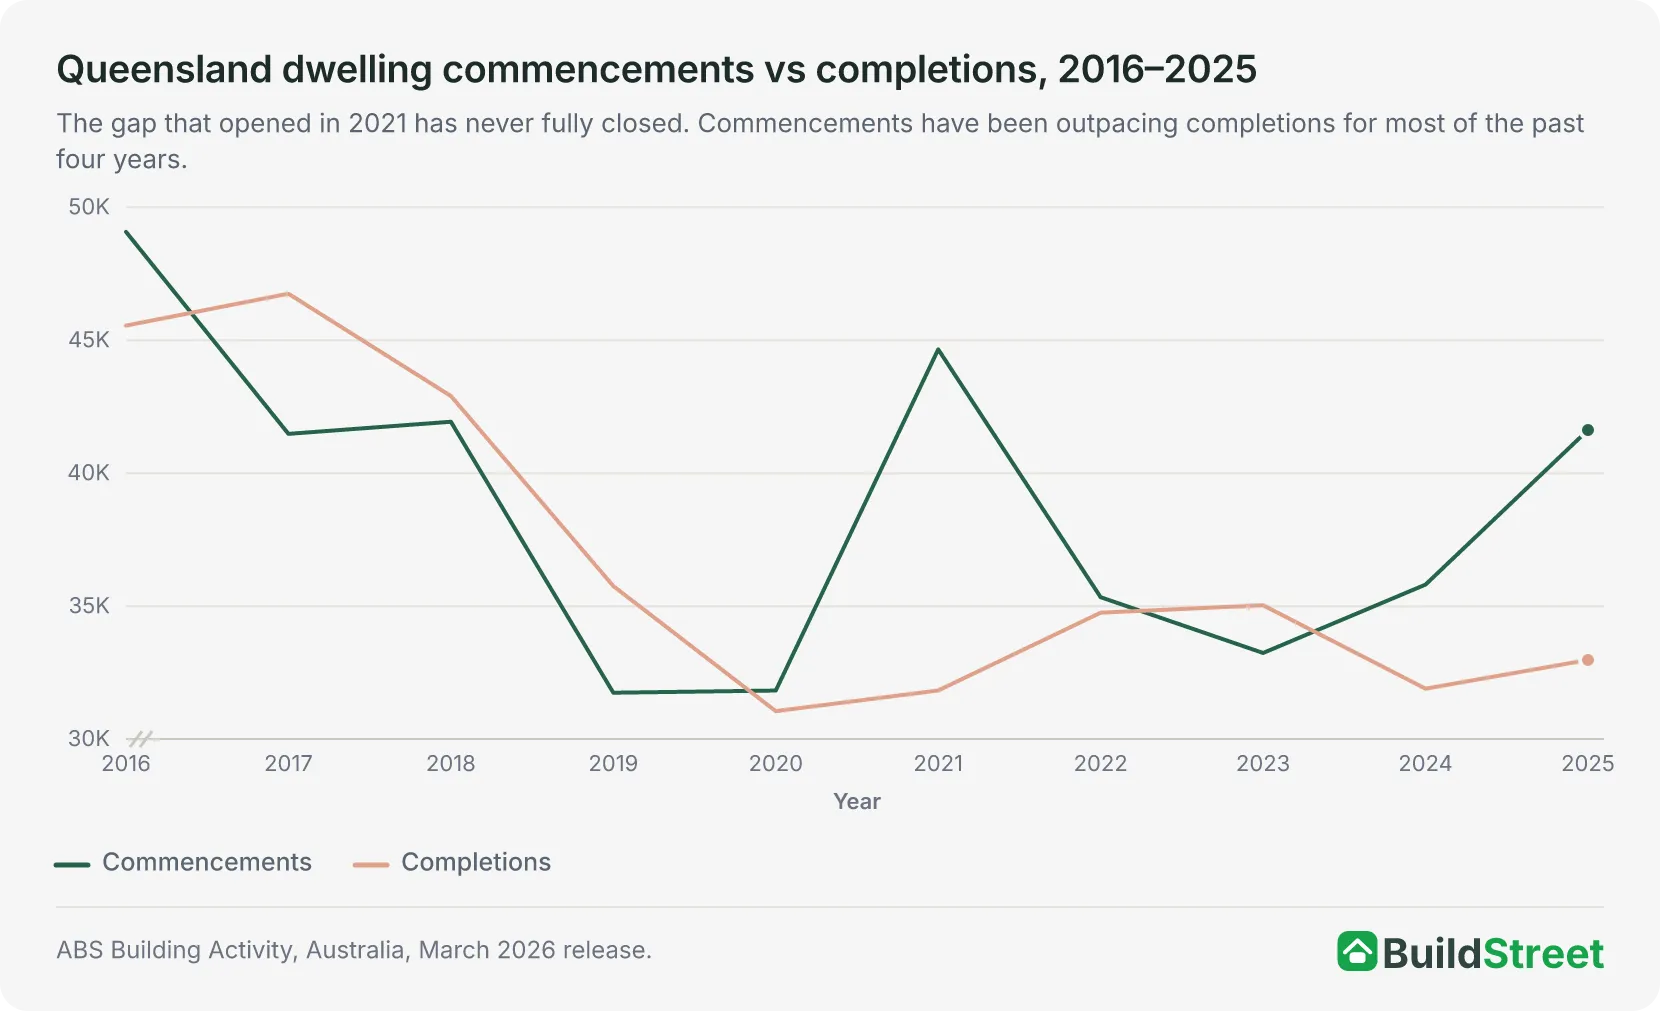
Queensland commenced 41,625 dwellings in 2025 and completed 32,977, a shortfall of 8,648 homes. That gap is not a one-off, as similar shortfalls appeared in 2021 and 2024. Each time, the causes were the same. Not enough skilled tradespeople. Constrained subcontractor capacity. Backlogs of partly finished work competing for the same labour pool across multiple projects at once.
+4% p.a.
Labour wage pressure. Minimum union target across 2026 enterprise agreements. Trade shortages mean these targets are broadly achievable, keeping residential labour costs on a steady upward path.
1,894
Construction insolvencies in the financial year to February 2026. Construction has ranked first for insolvencies for three consecutive years, reducing the number of active builders available to take on new work.
Intense
Infrastructure competition. Major state and federal infrastructure projects are competing directly with residential builders for the same pool of trades. SEQ is the main pressure point.
Insolvency data: Scale Suite, Australian Business Insolvency by Industry 2026. Wage target: industry reporting on 2026 enterprise agreement rounds. Infrastructure competition: RLB Australia Market Intelligence Update Q1 2026.
When builders become insolvent, fewer firms are available to take on new work. This can reduce competition and place upward pressure on construction costs. National construction cost growth was running at 3.4% a year as at December 2025 — slower than the 2021–22 peak, but still compounding onto a base that has risen significantly since 2020.
Section 08 · CATCH-UP
Can Queensland completions catch up with approvals?
At March 2026, Queensland had 50,100 dwellings under construction and a further 4,809 approved but not yet started. That is a substantial active pipeline that will eventually convert into completions. Rising commencements through 2025 point to more finished homes in 2026 and 2027. But pipeline size alone does not guarantee a quick conversion.
In 2021, Queensland commenced 44,657 dwellings but completed only 31,829. The gap of nearly 13,000 homes took roughly two years to clear. Builder insolvencies removed some projects from the pipeline entirely, while rising construction costs made others harder to complete.
2021 cycle: what happened
- Commencements
44,657
- Completions (same year)
31,829
- Gap
12,828
- Years to clear backlog
~2 years
- Complicating factor
Cost surge, insolvencies
2025 cycle: current position
- Commencements
41,625
- Completions (same year)
32,977
- Gap
8,648
- Under construction (Mar 2026)
50,100
- Complicating factor
Olympic demand, labour
Source · ABS Building Activity, Australia, March 2026 release. 2021 commencement figure is the calendar-year total from the original quarterly series.
Even if Queensland reaches the 50,000-a-year pace, reaching it once would not be enough. The one-million-home target requires Queensland to sustain that level of delivery for around two decades.
Section 09 · 1 MILLION TARGET
What Queensland's 1 million-home target means
Delivering one million homes by 2046 requires around 45,500 dwellings a year on a straight-line basis, or closer to 50,000 once front-loaded demand and the social housing component are accounted for. Queensland completed 32,977 homes in 2025. The Homes for Queenslanders plan sets the ambition, including 53,500 social homes and mandatory dwelling-type targets for each council, but 95% of the supply must come through the private sector.
Where Queensland sits against the implied annual pace
- Approvals (2025)42,502
- Commencements (2025)41,625
- Completions (2025)32,977
— Implied Annual Pace: 50,000
Key policy measures include mandatory council-level housing targets by dwelling type, a $350 million Infill Fund, and the Priority Development Area programme. ShapingSEQ 2023 sets a target of 900,000 new homes in South East Queensland by 2046, including 100,000 homes close to jobs and transport. This infill target sits alongside Queensland's ongoing greenfield land release programme in the western growth corridors.
| Policy component | Detail |
|---|---|
| Social housing target | 53,500 social homes by 2046, backed by $1.25 billion over five years from 2028. Delivery rate of at least 2,000 homes/yr from that point. 1,315 already delivered at time of publication. |
| Private sector dependency | ~95% of the target relies on private delivery, leaving the plan exposed to the same feasibility, finance and construction capacity constraints that are currently slowing completions. |
| Dwelling type targets | Council-level targets now specify dwelling type, not just total numbers — a shift from earlier plans that set volume targets without specifying how much supply needed to be attached or higher-density. |
Section 10 · REGIONAL QLD
Regional Queensland: a clear second tier of growth
Regional Queensland grew at an average of 0.7% a year over the decade to June 2023, less than half the SEQ rate. That average covers a wide range. Several regional markets are growing well above it, and population projections to 2046 show a clear hierarchy of where housing demand will concentrate outside the south-east.
Wide Bay, covering Hervey Bay, Bundaberg and the Fraser Coast, was the fastest-growing regional SA4 outside SEQ in 2022–23 at 2.1%. Its growth was driven by lifestyle migration from South East Queensland. Cairns was second, supported by tourism recovery and increased infrastructure investment. Townsville and Toowoomba are the largest regional service economies, and both are expected to record sustained population growth over the next two decades.
Regional SA4s with the Highest Projected Gains to 2046
Projected population gain from 2021 to 2046, SA4 regions outside Greater Brisbane
Region (SA4)
Projected Gain to 2046
- 1Gold Coast351,964
- 2Sunshine Coast207,992
- 3Cairns76,493
- 4Townsville65,955
- 5Mackay–Isaac–Whitsunday52,812
- 6Central Queensland51,686
- 7Wide Bay48,467
- 8Toowoomba40,233
The Gold Coast and Sunshine Coast are in a different league to the rest of regional Queensland, each projected to add more than 200,000 people by 2046. Cairns, Townsville, Mackay and Central Queensland form the next group, each projected to grow by 50,000 to 80,000 people over the same period. Each market has distinct housing needs. The Gold Coast, shaped by overseas migration, requires more higher-density product; Wide Bay and Toowoomba, driven by lifestyle relocation, remain predominantly detached housing markets.
References
- QGSO Population Growth Highlights and Trends, Queensland Regions, 2024 edition · qgso.qld.gov.au ↑
- QGSO Regional Population Growth 2024–25 · qgso.qld.gov.au ↑ b
- ABS Regional population, 2024-25 · Australian Bureau of Statistics ↑
- QGSO Residential Land Supply and Development · qgso.qld.gov.au ↑
- Economic Development Queensland, 2024–25 Snapshot · edq.qld.gov.au ↑
- ShapingSEQ 2023, Queensland Government · statements.qld.gov.au ↑
- NHSAC, State of the Housing System 2025 · nhsac.gov.au ↑
- NHSAC State of the Housing System 2026 · nhsac.gov.au ↑
- NHSAC Quarterly Report – August 2026 · nhsac.gov.au ↑
- ABS Building Approvals, Australia (latest release, Cat. 8731.0) · Australian Bureau of Statistics
- ABS, Building Activity, Australia (latest release, Cat. 8752.0) · Australian Bureau of Statistics
- QGSO Population Projections, SA4 series, 2023 edition · qgso.qld.gov.au
- Queensland Government, Homes for Queenslanders · housing.qld.gov.au
- NHSAC Quarterly Report, March 2026 · nhsac.gov.au
- ABS, New houses being built on smaller blocks · Australian Bureau of Statistics
- Centre for Population, Regional Population 2023–24 · population.gov.au
- Master Builders Queensland, Homes for Queenslanders analysis · mbqld.com.au
- RLB Australia Market Intelligence Update, Q1 2026 · rlb.com
- Scale Suite, Australian Business Insolvency by Industry 2026 · scalesuite.com.au
