

Published 26 May 2026 · Updated 28 Sept 2026
New South Wales is projected to fall about 119,000 homes short of its Housing Accord target by June 2029 and is not expected to reach it until March 2032, almost three years late1. The state needs to build 75,400 homes a year to stay on track. In the year to March 2026, it completed 44,804, around 41% below the required pace.
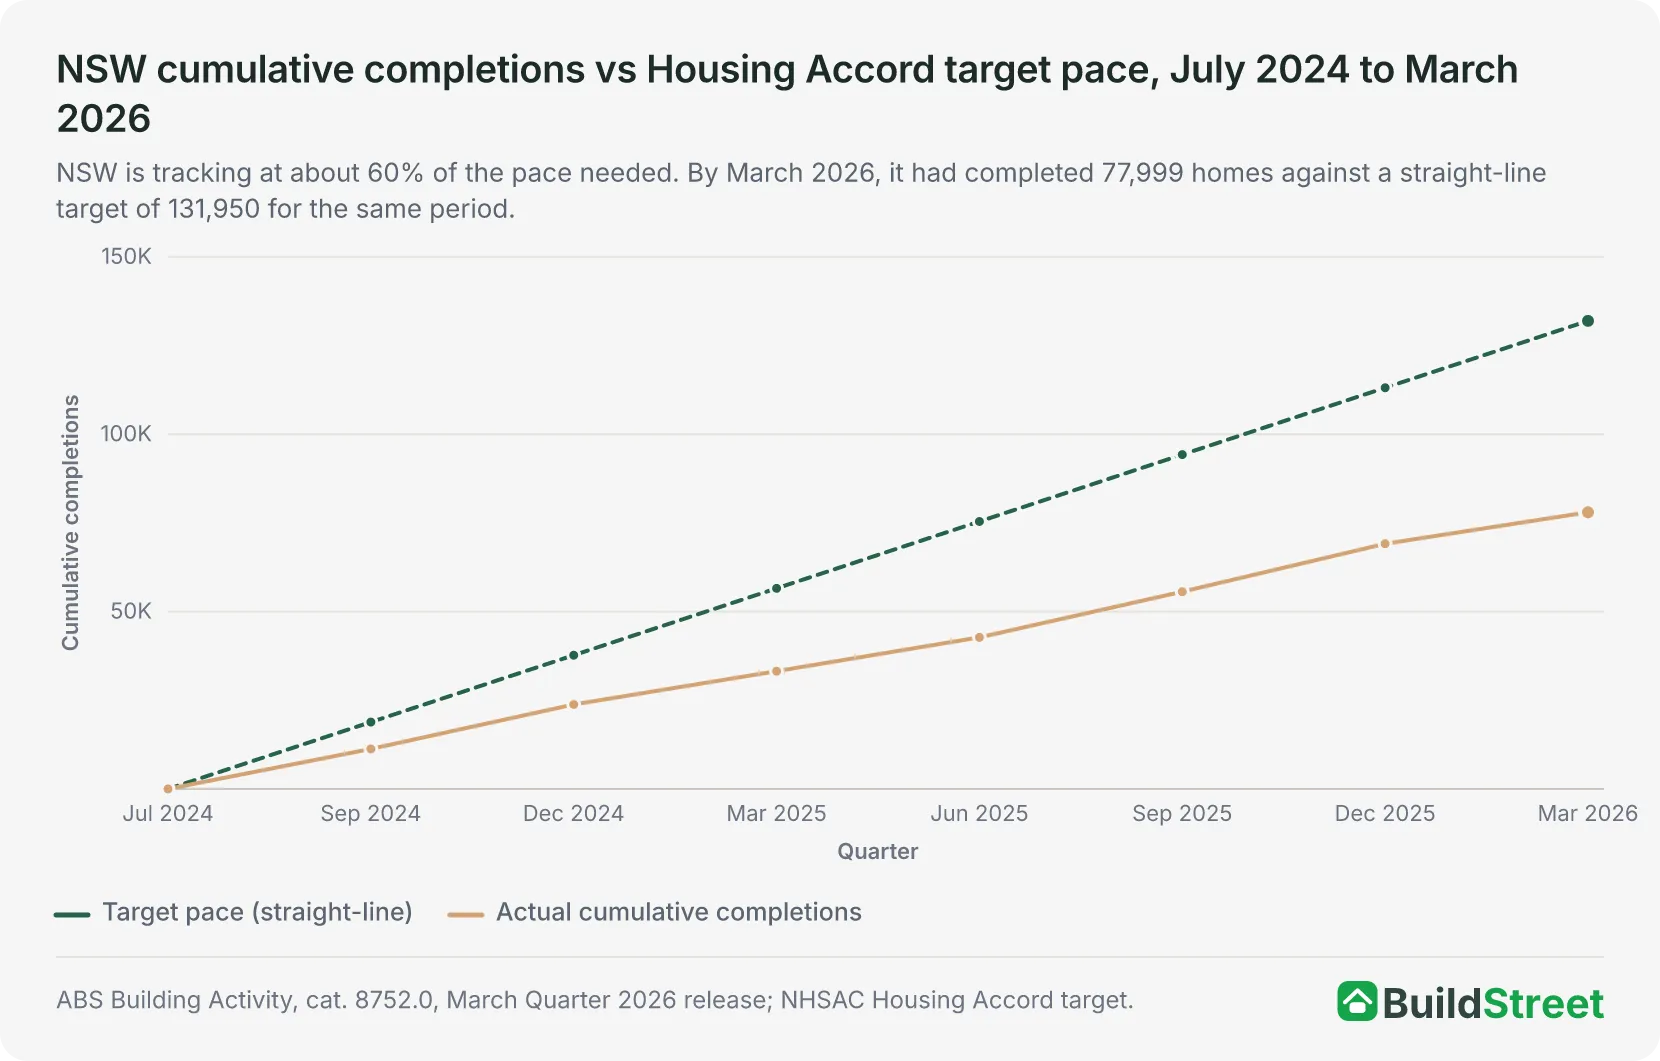
After seven quarters of the five-year Accord period, NSW has completed around 21% of its 377,000-home target, against a benchmark of 35%.
 Is Australia on track to build 1.2 million homes by June 2029?Australia has completed 307,635 homes in the first seven quarters of the National Housing Accord, leaving the country 112,365 homes behind the pace needed to reach 1.2 million by June 2029. Australia…
 The states with the fastest and slowest home build times in AustraliaBuilding a new home in Australia involves two key waiting periods: approval to commencement (the time from receiving planning approval to breaking ground), and commencement to completion (the time fro…
Section 01 · The housing target
Housing Accord 2026: how far behind is NSW?
The National Housing Accord is a federal-state agreement targeting 1.2 million new homes across Australia between July 2024 and June 20292. NSW's share is 377,000 homes, or 75,400 a year. The Accord is not legally binding but comes with $3.5 billion in Commonwealth funding to support delivery.
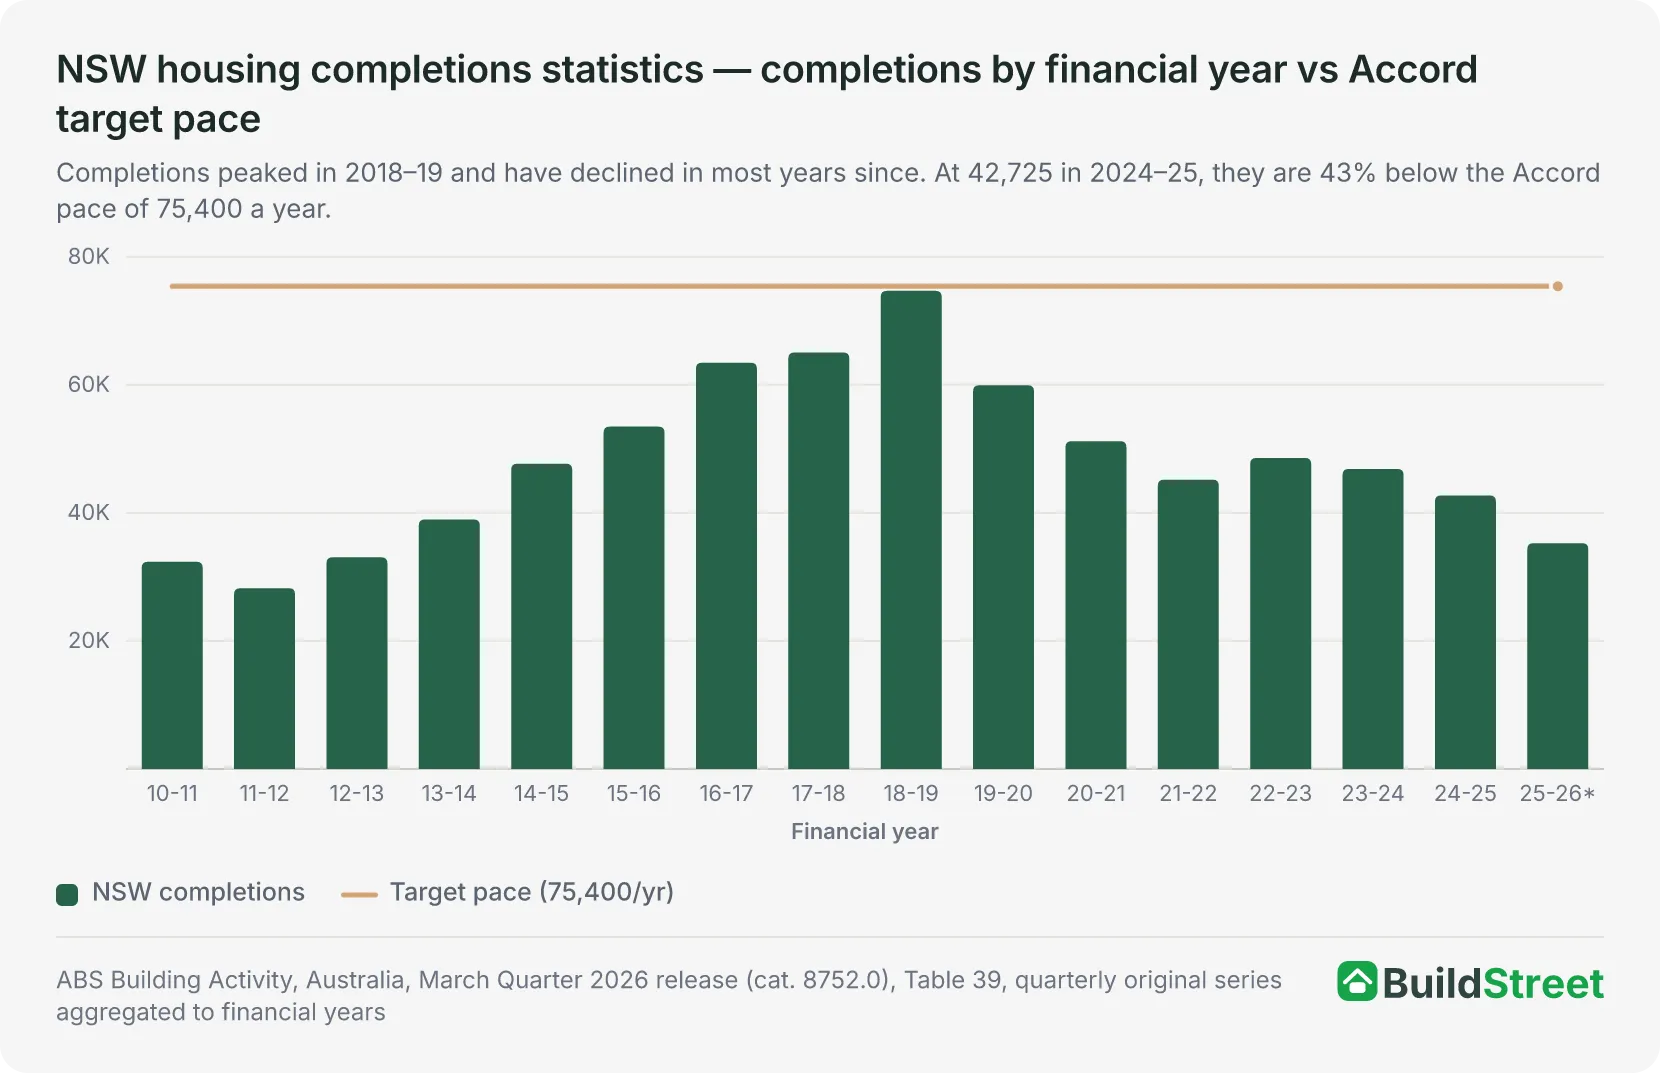
The most reliable way to track progress is completions, because these are the homes actually added to the housing stock. NSW completed 42,725 homes in 2024–25, or 56.7% of the required annual pace. The rolling four-quarter figure to March 2026 was 44,804.
NSW is projected to build around 258,000 new homes over the five-year Accord period3, against its allocation of 377,000. That points to a shortfall of roughly 119,000 homes by June 2029, and NHSAC's August 2026 update now expects the target to be reached only in March 2032.
NSW Housing Accord progress
NSW completions each financial year against the Accord target pace of 75,400 homes a year. 2025–26 covers July 2025 to March 2026 only.
Expected target completion · Mar 2032
- 24-2542,725
- 25-26*35,274
— Target pace per year: 75,400
How NSW compares to other states
NSW has built just 21% of its Housing Accord target so far, the lowest completion rate among the major eastern states. Victoria is at 32%, Queensland at 24%, and Western Australia at 29%1.
Nationally, the figure is around 26%. NSW is not expected to reach its allocation until March 2032, almost three years after the deadline.
| State / Territory | Target (homes) | Completions to date (est.) | % of target built | % approved to date | Expected delivery |
|---|---|---|---|---|---|
| NSW | 377,000 | 79,170 | 21% | 27% | Mar 2032 |
| Victoria | 306,000 | 97,920 | 32% | 37% | Dec 2029 |
| Queensland | 246,000 | 59,040 | 24% | 35% | Mar 2031 |
| Western Australia | 129,000 | 37,410 | 29% | 38% | Dec 2029 |
| South Australia | 84,000 | 23,520 | 28% | 35% | Mar 2031 |
| Tasmania | 26,000 | 4,160 | 16% | 20% | Jun 2034 |
| Australia | 1,200,000 | 312,000 | 26% | 33% | Dec 2030 |
Source · NHSAC Quarterly Report, August 2026 (approvals to June 2026, completions to the March 2026 quarter). Targets are NHSAC's population-share allocations from State of the Housing System 2026, with NSW shown at its 377,000 target. Completions to date are estimates derived by applying each jurisdiction's published percentage share to its Accord target.
Section 02 · Approvals
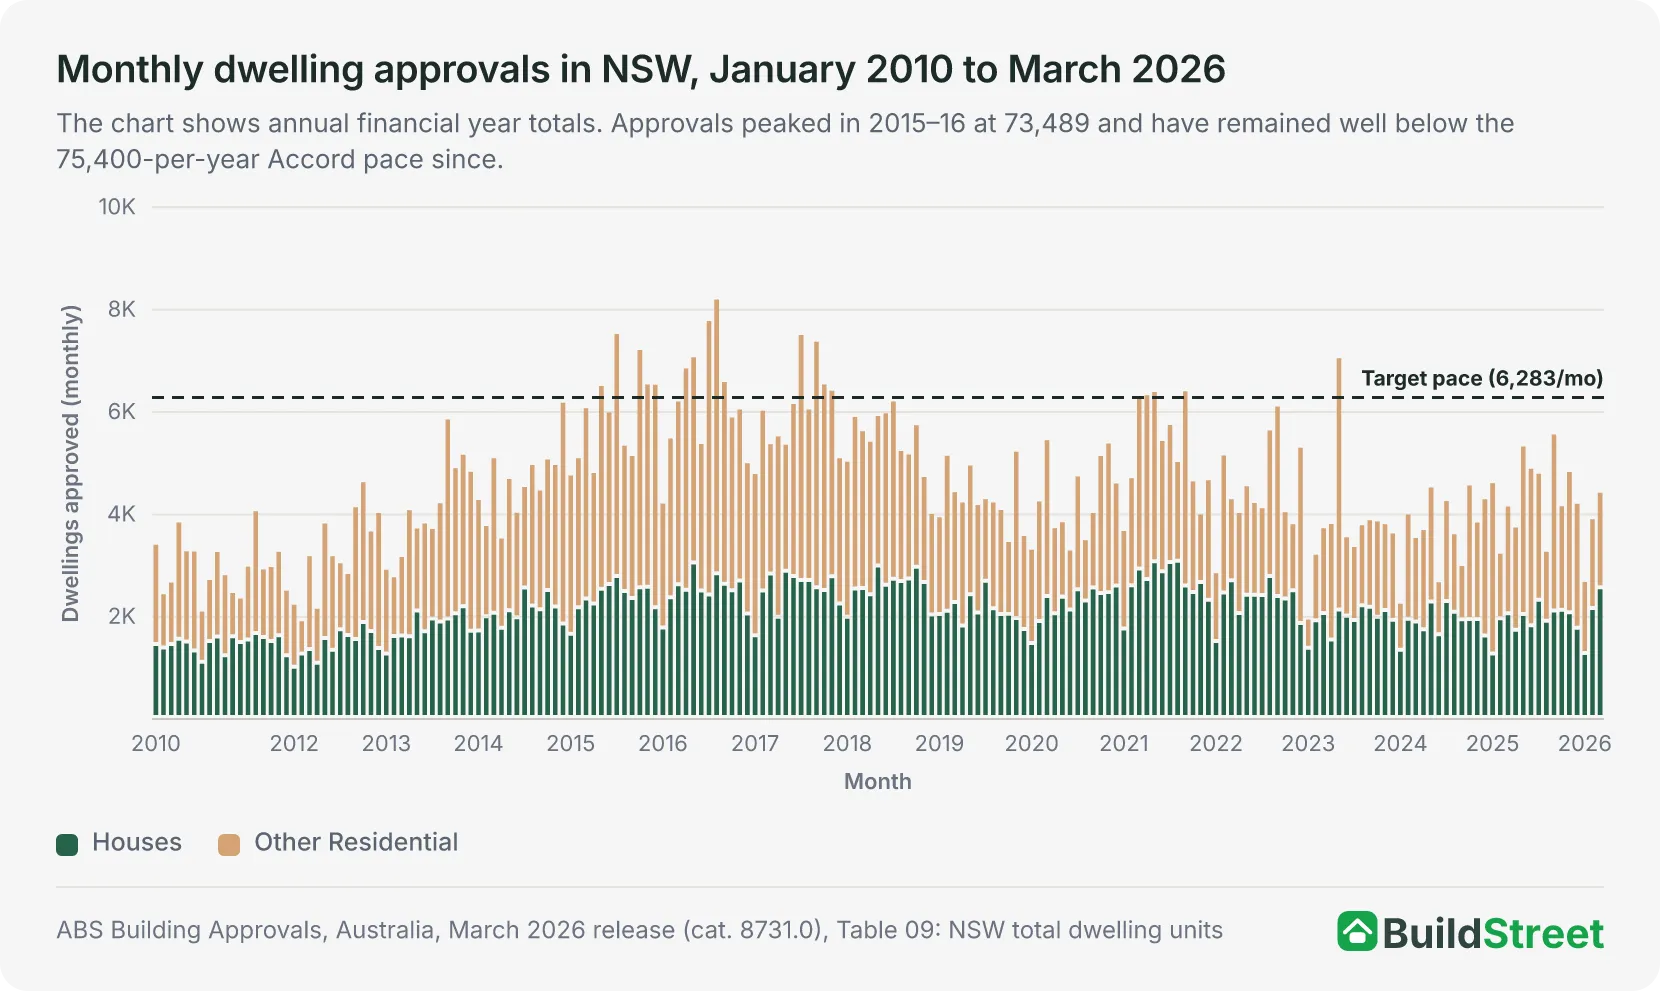
NSW dwelling approvals increased again in 2025–26
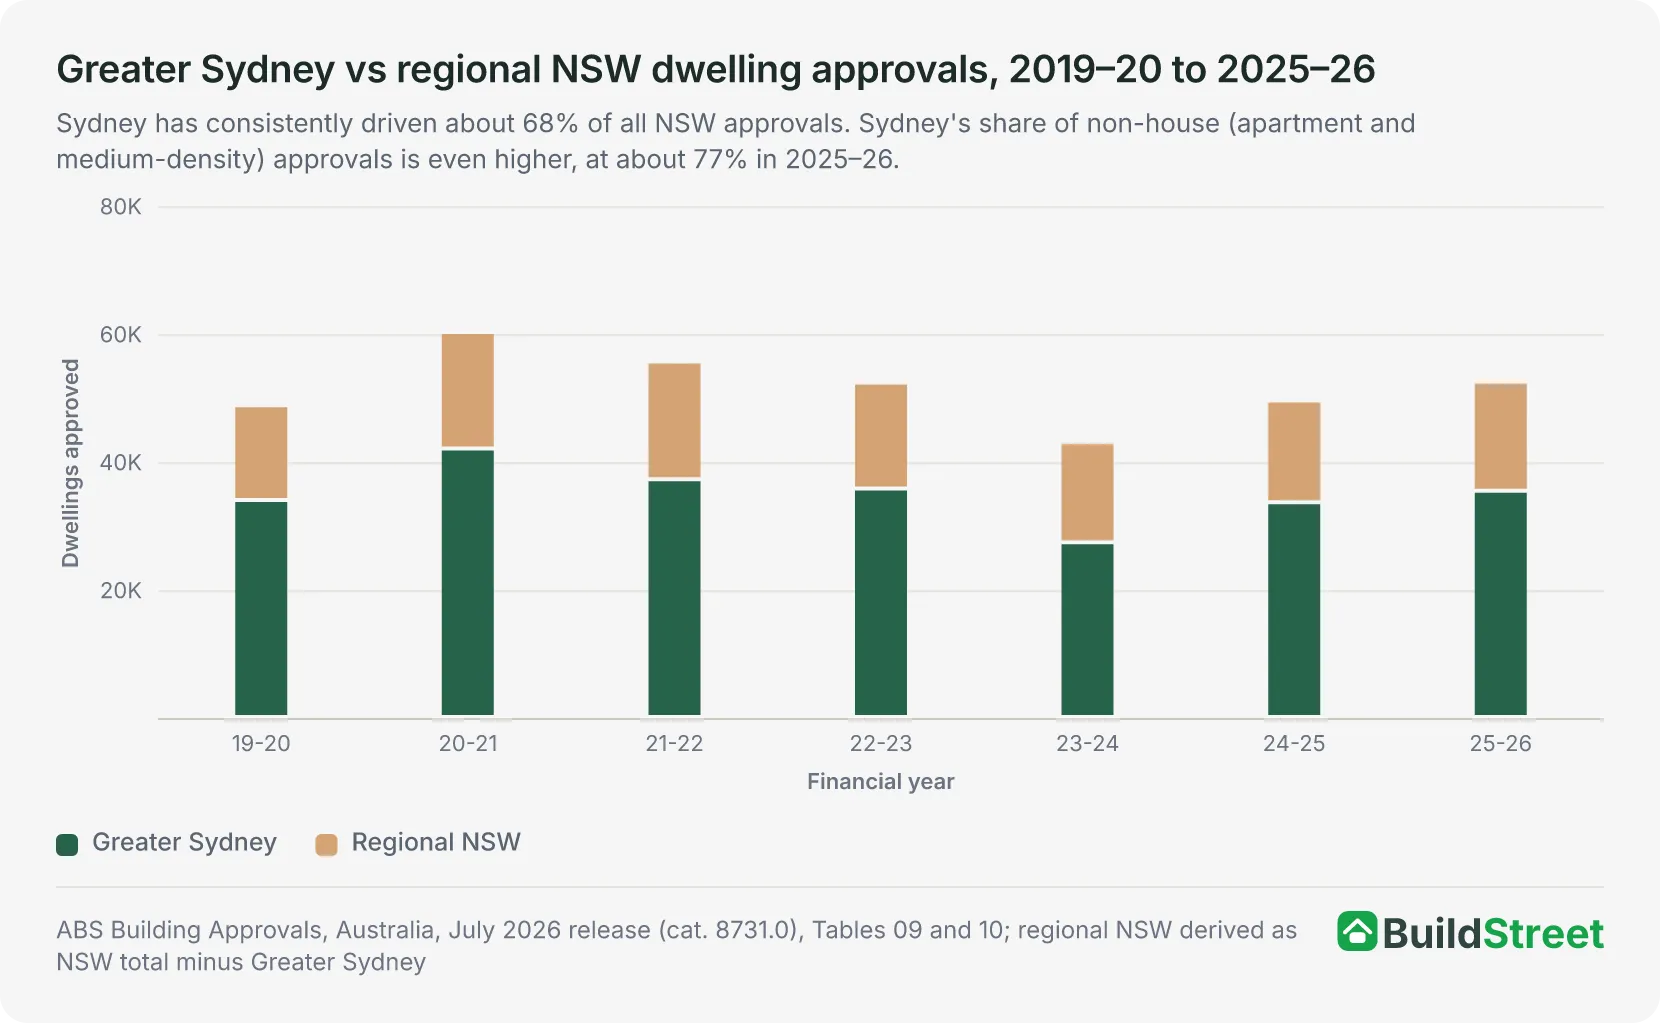
NSW approved 52,426 dwellings in 2025–26, up 5.9% from 49,507 in 2024–25, which had itself risen 15.1% from 43,018 in 2023–24. Approval activity is rising, although volumes remain below the level needed to support long-term housing supply.
The increase has continued into 2026–27. NSW approved 5,214 dwellings in July 2026, up 5.8% on July 20254. On a rolling 12-month basis, approvals reached 52,713 dwellings in July 2026.
In 2025–26, NSW approved 25,045 houses and 27,381 non-house dwellings, including apartments, townhouses and other attached housing. Non-house dwellings accounted for 52.2% of total approvals.
Apartment approvals were concentrated mainly in Inner Sydney, while detached house approvals were more common in outer suburban council areas, including Blacktown, Liverpool, Camden and Campbelltown.
What is holding back housing approvals?
Approval numbers are improving, but the pipeline is still being slowed by several practical constraints. These affect how quickly projects move from planning policy into approved, financeable and buildable homes.
Several issues are holding back the approvals pipeline:
- Planning delays: Many sites zoned for medium- or high-density development still face slow development application processes, even after state-level upzoning through the Transport Oriented Development program.
- Project viability: Higher construction costs, financing rates and slower apartment pre-sales have made some projects harder to progress, particularly across inner and middle-ring Sydney.
- Builder insolvencies: The rise in builder insolvencies between 2022 and 2024 added further uncertainty for developers and lenders.
Section 03 · Commencements
Approved homes are moving into construction more slowly
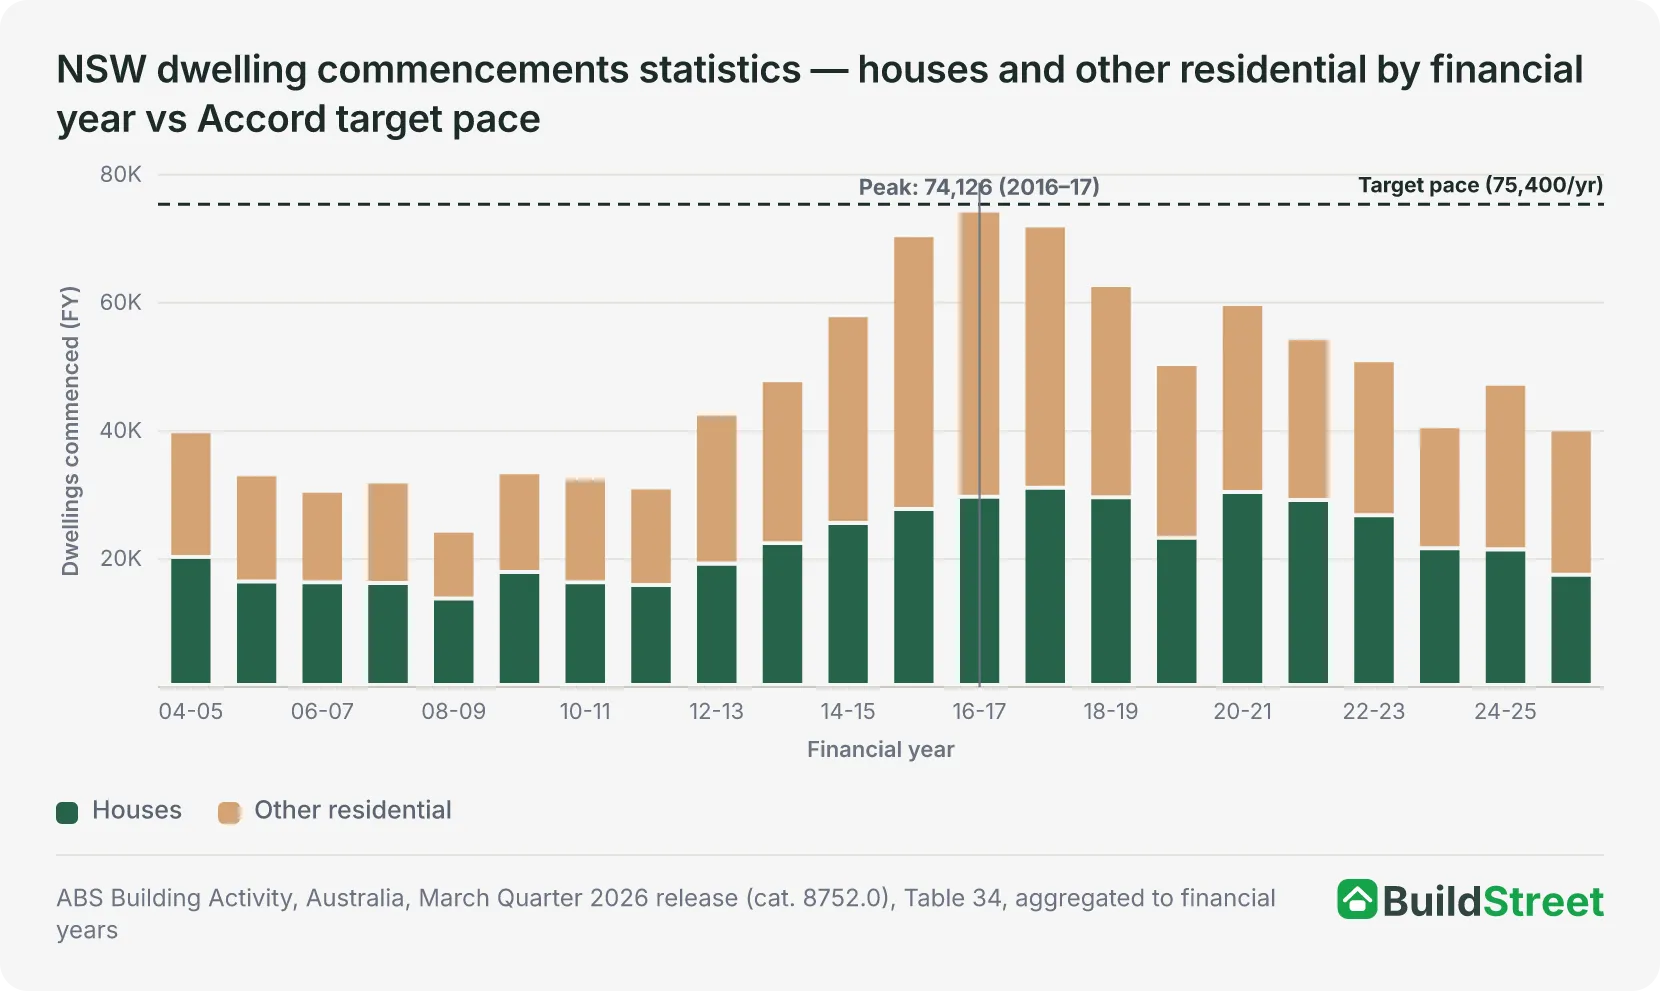
NSW commenced construction on 47,058 dwellings in 2024–25, up 16.4% from 40,430 the year before. This was still below the 2016–17 peak of 74,126 and around 38% below the annual pace required under the Accord.
Momentum improved in late 2025 but did not hold. The December 2025 quarter recorded 16,713 commencements, the strongest quarterly result in several years, before starts fell to 10,373 in the March 2026 quarter. On a rolling four-quarter basis, NSW reached 51,714 commencements in the year to March 2026, equal to about 69% of the annual pace required.
At March 2026, 80,522 dwellings were under construction in NSW, including 21,417 houses and 58,719 other residential dwellings. A further 12,745 dwellings had been approved but not yet commenced, including 8,705 other residential dwellings and 3,884 houses. The backlog of approved-but-not-started dwellings was concentrated in higher-density housing, which can be more difficult to progress due to project viability, financing and pre-sale requirements.
Why are approvals not converting into construction starts?
An approval is an important step in the housing pipeline, but it does not guarantee that work will begin straight away. Projects still need labour, finance, builder capacity and, in many cases, enough buyer demand to move from approval into construction.
Three main barriers are slowing progress:
- Trades shortages: Skilled workers, including carpenters, concreters, electricians and plumbers, remain in short supply nationally.
- Builder insolvencies: Insolvencies between 2022 and 2024 left some approved projects without a builder, requiring a replacement before work could begin.
- Financing and pre-sales: For apartment and medium-density projects, difficult financing conditions and pre-sale targets have led some developers to pause or rework projects before breaking ground.
Section 04 · Completions
Housing completions remain below target despite late-2025 improvement
NSW completed 42,725 homes in 2024–25, down 8.8% from 46,865 in 2023–24. The rolling four-quarter figure improved to 45,300 by December 2025, as more homes already under construction started reaching completion, then eased to 44,804 in the year to March 2026. The December 2025 quarter recorded 13,513 completions5, the highest quarterly result since 2020, before completions fell back to 8,883 in the March 2026 quarter.
For context, NSW completions last peaked at 74,683 in 2018–19, supported by a large volume of construction starts between 2015 and 2018. The current pipeline is much smaller. In 2024–25, NSW completed 22,698 houses, 19,453 other residential dwellings and 573 conversions, showing that the apartment and medium-density pipeline has not yet fully flowed through to completed homes.
Build times have also increased. In 2024–25, a new NSW house took 4.10 quarters, or about 12.3 months, from approval to completion. That was up 31% from 3.13 quarters in 2019–20. This helps explain why a large number of homes under construction are not turning into finished homes as quickly as they did in the late 2010s.
Section 05 · Sydney vs regional NSW
Where are new homes being approved in NSW?
Housing approvals in NSW are heavily concentrated in Greater Sydney, which means the state's overall supply pipeline is closely tied to Sydney's approval activity.
Greater Sydney accounted for 35,404 of the state's 52,426 approvals in 2025–26, or 67.5%, little changed from 67.8% in 2024–25. The five most active councils in 2025–26 were Parramatta and The Hills Shire, with 2,696 approvals each, Blacktown with 2,415, Liverpool with 2,164 and Cumberland with 1,830. Outside Greater Sydney, the most active regional markets were Wollongong with 1,549 approvals, Maitland with 1,370, Lake Macquarie with 1,214, Shoalhaven with 869 and Shellharbour with 856.
These are solid local approval numbers, but no individual regional market is large enough on its own to offset slower activity in Sydney.
Why regional NSW is struggling to build enough
Regional NSW has different housing supply pressures from Greater Sydney, but the outcome is similar: new housing is not being delivered quickly enough to meet demand. In many areas, the challenge is not only planning approval, but whether land, infrastructure, labour and project economics can support new homes at scale.
Regional NSW faces several supply challenges:
- Infrastructure gaps: Many regional growth corridors lack the water, sewerage and road capacity needed to support new housing at scale. Rezoning land is only useful when the infrastructure to service it is also in place.
- Higher build costs: Limited local tradespeople, shorter supply chains and transport costs can push build prices in regional NSW above those on the metropolitan fringe.
- Lower pre-sale prices: In smaller towns and cities, lower property prices mean developers have less room to cover costs, making apartments and townhouses harder to justify financially.
- Rental pressure: Rents on new leases in regional NSW were among the least affordable in the country in 2025, driven by years of limited new supply relative to population growth.
Section 06 · The shortfall
The NSW housing target gap remains large
NSW is projected to complete around 258,000 homes over the five Accord years to June 2029, compared with its allocation of 377,000. That leaves a projected shortfall of about 119,000 homes. NHSAC's August 2026 update has since pushed the date NSW is expected to reach its target back to March 2032, from June 2031.
The gap reflects the same issues seen throughout the pipeline: approvals are improving, construction starts are rising, and completions have lifted in recent quarters, but none are yet moving fast enough to close the shortfall.
To reach the target, the state would need a sustained lift in completions, supported by faster approvals, stronger project viability, more construction capacity and infrastructure that can support new housing at scale.
How the housing gap is affecting renters and buyers
For renters and buyers, the housing shortage has had clear financial consequences. National rental affordability reached a record low in 2025, with 33.1% of median household income needed to service a new lease3. Rental stress also increased, with 29% of renter households in rental stress in 2024, up from 24% in 2021. In regional New South Wales, rents on new leases were among the least affordable in the country. At the same time, the time needed to save a 20% deposit rose to 11.2 years in 2025, a national record.
Population growth is outpacing housing delivery
Across the 15 financial years to 2024–25, NSW averaged about 2.1 people for every home completed. Supply was strongest in 2018–19, when NSW completed 74,683 homes while the population increased by 92,272 people. This equalled 1.24 people per completed home.
The gap widened from 2022. In 2022–23, NSW added 174,289 residents but completed only 48,585 homes, equal to 3.59 people per completed home. By 2024–25, the ratio had eased to 2.23 as population growth slowed, but it remained above the long-run average, indicating continued pressure on housing availability.
Section 07 · Historical context
How today's NSW housing pipeline compares with past cycles
The last time NSW came close to the current Accord pace was 2018–19, when it completed 74,683 homes. That was just 1% below the 75,400 homes needed each year. By comparison, the 2024–25 result of 42,725 completions was 43% below the 2018–19 peak. On approvals, the closest NSW has come to the current annual pace was 2015–16, when 73,489 dwellings were approved.
At March 2026, NSW had 80,522 homes under construction, which was close to the late-2010s high. However, homes are now taking longer to complete, meaning the construction pipeline is not converting into finished homes at the same rate.
Show full tables
| FY | Approvals | Commencements | Completions | Under construction (EOY) | Approved, not yet started (EOY) |
|---|---|---|---|---|---|
| 2010–11 | 34,630 | 32,309 | 32,367 | 32,540 | 10,392 |
| 2011–12 | 35,204 | 30,827 | 28,233 | 35,146 | 12,359 |
| 2012–13 | 42,823 | 42,377 | 33,063 | 43,670 | 11,336 |
| 2013–14 | 54,095 | 47,595 | 38,981 | 51,529 | 14,298 |
| 2014–15 | 63,419 | 57,746 | 47,684 | 60,785 | 16,551 |
| 2015–16 | 73,489 | 70,263 | 53,478 | 76,193 | 19,647 |
| 2016–17 | 72,731 | 74,126 | 63,463 | 85,023 | 18,216 |
| 2017–18 | 72,856 | 71,776 | 65,063 | 89,973 | 20,047 |
| 2018–19 | 57,982 | 62,460 | 74,683 | 75,766 | 15,433 |
| 2019–20 | 48,748 | 50,123 | 59,935 | 64,686 | 13,759 |
| 2020–21 | 60,213 | 59,501 | 51,202 | 71,169 | 11,083 |
| 2021–22 | 55,574 | 54,193 | 45,192 | 78,172 | 13,012 |
| 2022–23 | 52,315 | 50,723 | 48,585 | 79,088 | 13,782 |
| 2023–24 | 43,018 | 40,430 | 46,865 | 71,805 | 16,977 |
| 2024–25 | 49,507 | 47,058 | 42,725 | 75,870 | 15,942 |
| 2025–26* | 52,426 | 39,901 | 35,274 | 80,522 | 12,745 |
Source · Methodology: Approvals: ABS Building Approvals (cat. 8731.0) Table 09. Commencements: ABS Building Activity (cat. 8752.0) Table 35 & 34. Completions: Table 39. Under construction (EOY): Table 77. Approved-but-not-yet-commenced: Table 80. * 2025–26 covers the full year of approvals (Jul 2025 to Jun 2026) and three quarters of commencements/completions (Jul 2025 to Mar 2026); stock at March 2026. ‡ Commencements/completions vs nine-month pro-rated target of 56,550. Sources: ABS Building Approvals (cat. 8731.0) July 2026; ABS Building Activity (cat. 8752.0) March 2026.
References
- NHSAC Quarterly Report – August 2026 · nhsac.gov.au ↑ b
- Treasury, National Housing Accord · treasury.gov.au ↑
- NHSAC State of the Housing System 2026 · nhsac.gov.au ↑ b
- ABS Building Approvals, Australia, July 2026 — Table 09 (Cat. 8731.0) · Australian Bureau of Statistics ↑
- ABS Building Activity, Australia, March 2026 — Table 39 · Australian Bureau of Statistics ↑
- ABS Building Approvals, Australia (latest release, Cat. 8731.0) · Australian Bureau of Statistics
- ABS, Building Activity, Australia (latest release, Cat. 8752.0) · Australian Bureau of Statistics
- NHSAC Quarterly Report, March 2026 · nhsac.gov.au
- NHSAC State of the Housing System, 2025 · nhsac.gov.au
- NSW Planning — Housing Delivery Authority 12-month review finalised, pipeline grows 117,000 homes · planning.nsw.gov.au
- National Housing Accord · treasury.gov.au
