

Published
 How an ageing population is changing housingThe number of older households, the dwellings they live in and what an older population means for housing demand and construction.
 How old are the people who leave Australia?Departures from Australia by age group, including people at and past retirement age, from ABS overseas migration data.
Section 01 · Older renters
How many older Australians rent their home?
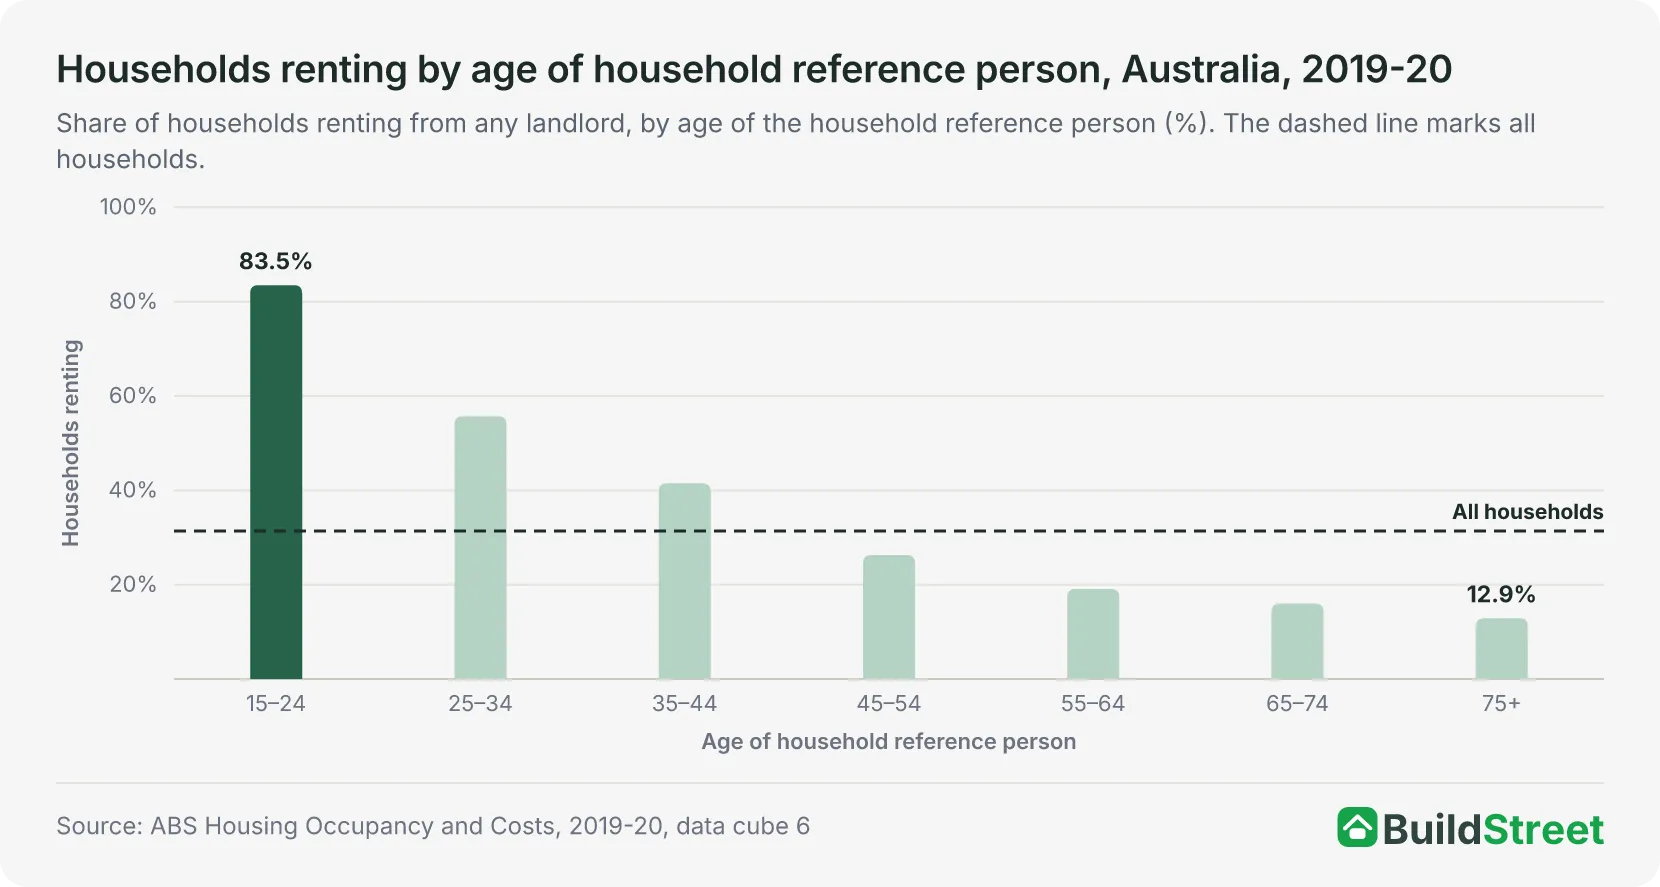
An estimated 364,000 Australian households with a reference person aged 65 and over rented their home in 2019-20, representing about 14.7 per cent of all households in that age group. BuildStreet calculated the estimate from Australian Bureau of Statistics (ABS) Survey of Income and Housing renting rates and household counts for the two age groups1. The estimate is subject to the survey’s margins of error.
In 2019-20, 16.0 per cent of households with a reference person aged 65 to 74 and 12.9 per cent of those with a reference person aged 75 and over rented their home1. Across households of all ages, 31.4 per cent rented.
The ABS reported margins of error of 1.9 percentage points for households aged 65 to 74 and 2.3 percentage points for households aged 75 and over1. The 3.1 percentage point gap between the two age groups is only slightly larger than the margin of error for the difference, of about 3.0 percentage points.
In 2019-20, 9.5 per cent of households with a reference person aged 65 to 74 rented from a private landlord, compared with 3.8 per cent that rented from a state or territory housing authority1. For households with a reference person aged 75 and over, the shares were 6.0 and 3.8 per cent, respectively.
The ABS did not release results from its 2023-24 Survey of Income and Housing, so estimates by age are available only up to 2019-202. Results from the 2025-26 survey are expected from mid-2027.
How many Age Pension recipients in Australia rent?
In June 2026, 287,680 Age Pension recipients paid private rent, equivalent to 10.6 per cent of the 2,718,425 people receiving the pension, according to Department of Social Services (DSS) payment recipient data3. A further 99,110 Age Pension recipients paid rent to a government housing authority, and 27,090 paid rent to a housing organisation other than a government authority.
In June 2026, 749,330 Age Pension recipients, or 27.6 per cent, did not own a home3. An Age Pension recipient counted as a homeowner may not live in the home they own.
| Housing tenure of older households, Australia, 2019-20 | |||
|---|---|---|---|
| Tenure and landlord type | Aged 65 to 74 (%) | Aged 75 and over (%) | All households (%) |
| Owner without a mortgage | 68.1 (±1.7) | 79.4 (±2.8) | 29.5 (±0.8) |
| Owner with a mortgage | 13.4 (±1.8) | 3.7 (±1.0) | 36.8 (±0.9) |
| Renter, private landlord | 9.5 (±1.5) | 6.0 (±1.6) | 26.2 (±1.0) |
| Renter, state or territory housing authority | 3.8 (±0.8) | 3.8 (±1.0) | 2.9 (±0.3) |
| All renters | 16.0 (±1.9) | 12.9 (±2.3) | 31.4 (±1.0) |
| Households (number) | 1,404,900 | 1,076,300 | 9,732,400 |
Source · ABS Housing Occupancy and Costs, 2019-20, data cube 6, Table 6.1.
Section 02 · Change since 2013
How has the number of older renters receiving Rent Assistance changed since 2013?
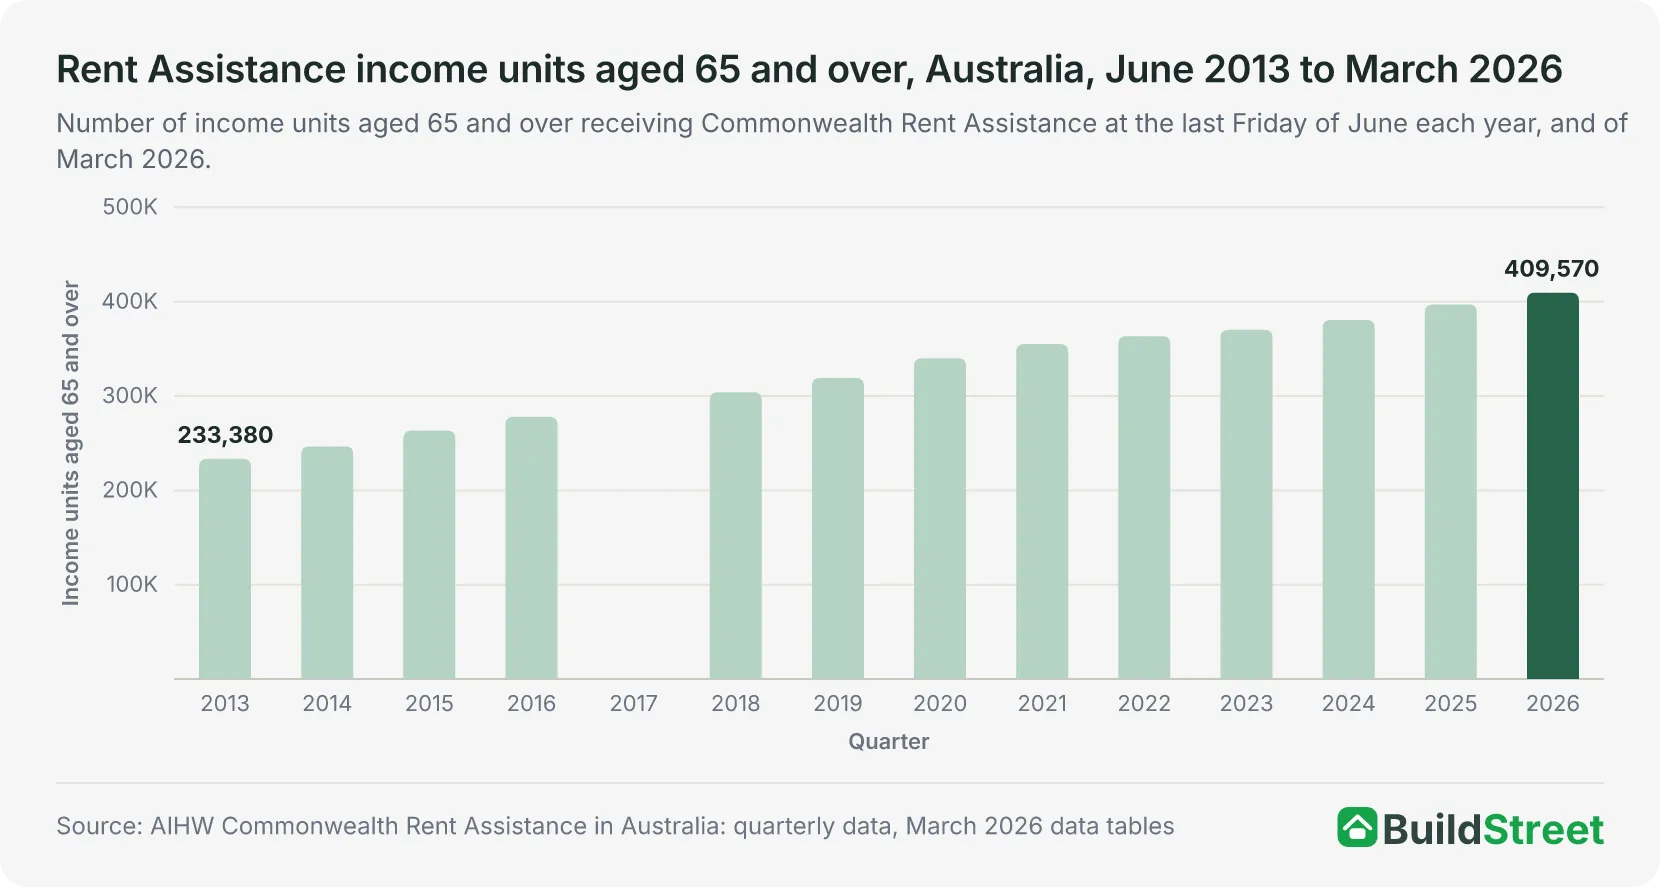
The number of income units aged 65 and over receiving Commonwealth Rent Assistance increased from 233,380 in June 2013 to 409,570 in March 2026, an increase of 176,190 income units, or 75.5 per cent, according to the Australian Institute of Health and Welfare (AIHW)4. Over the same period, the number of income units of all ages receiving Rent Assistance increased by 11.5 per cent, from 1,267,980 to 1,413,800.
The share of Rent Assistance income units aged 65 and over increased from 18.4 per cent in June 2013 to 29.0 per cent in March 2026, an increase of 10.6 percentage points4.
The share of Rent Assistance income units aged 65 and over fell from 24.8 per cent in June 2019 to 20.0 per cent in June 2020, while the number of income units of all ages receiving Rent Assistance increased from 1,285,940 to 1,700,1654.
Figures by age for June 2017 are not comparable with other years, because the AIHW changed how it determines the age of an income unit that year4. The data does not identify why the number of older recipients increased.
| Commonwealth Rent Assistance income units by age, Australia, June 2013 to March 2026 | ||||
|---|---|---|---|---|
| Quarter | Aged 65 and over | Aged 75 and over | All ages | Aged 65 and over, share of all (%) |
| June 2013 | 233,380 | 103,255 | 1,267,980 | 18.4 |
| June 2014 | 246,540 | 108,200 | 1,315,385 | 18.7 |
| June 2015 | 263,365 | 114,605 | 1,343,430 | 19.6 |
| June 2016 | 277,980 | 120,565 | 1,345,985 | 20.7 |
| June 2017 | n/a | n/a | 1,343,430 | n/a |
| June 2018 | 304,000 | 132,115 | 1,311,185 | 23.2 |
| June 2019 | 319,160 | 140,160 | 1,285,940 | 24.8 |
| June 2020 | 340,035 | 149,020 | 1,700,165 | 20.0 |
| June 2021 | 355,155 | 156,990 | 1,491,090 | 23.8 |
| June 2022 | 363,460 | 166,290 | 1,347,900 | 27.0 |
| June 2023 | 370,185 | 172,755 | 1,263,890 | 29.3 |
| June 2024 | 380,545 | 179,965 | 1,311,350 | 29.0 |
| June 2025 | 396,985 | 189,260 | 1,377,655 | 28.8 |
| March 2026 | 409,570 | 196,385 | 1,413,800 | 29.0 |
Source · AIHW Commonwealth Rent Assistance in Australia: quarterly data, Table CRA.1.
Section 03 · Housing stress
What share of lower-income older households in Australia are in housing stress?
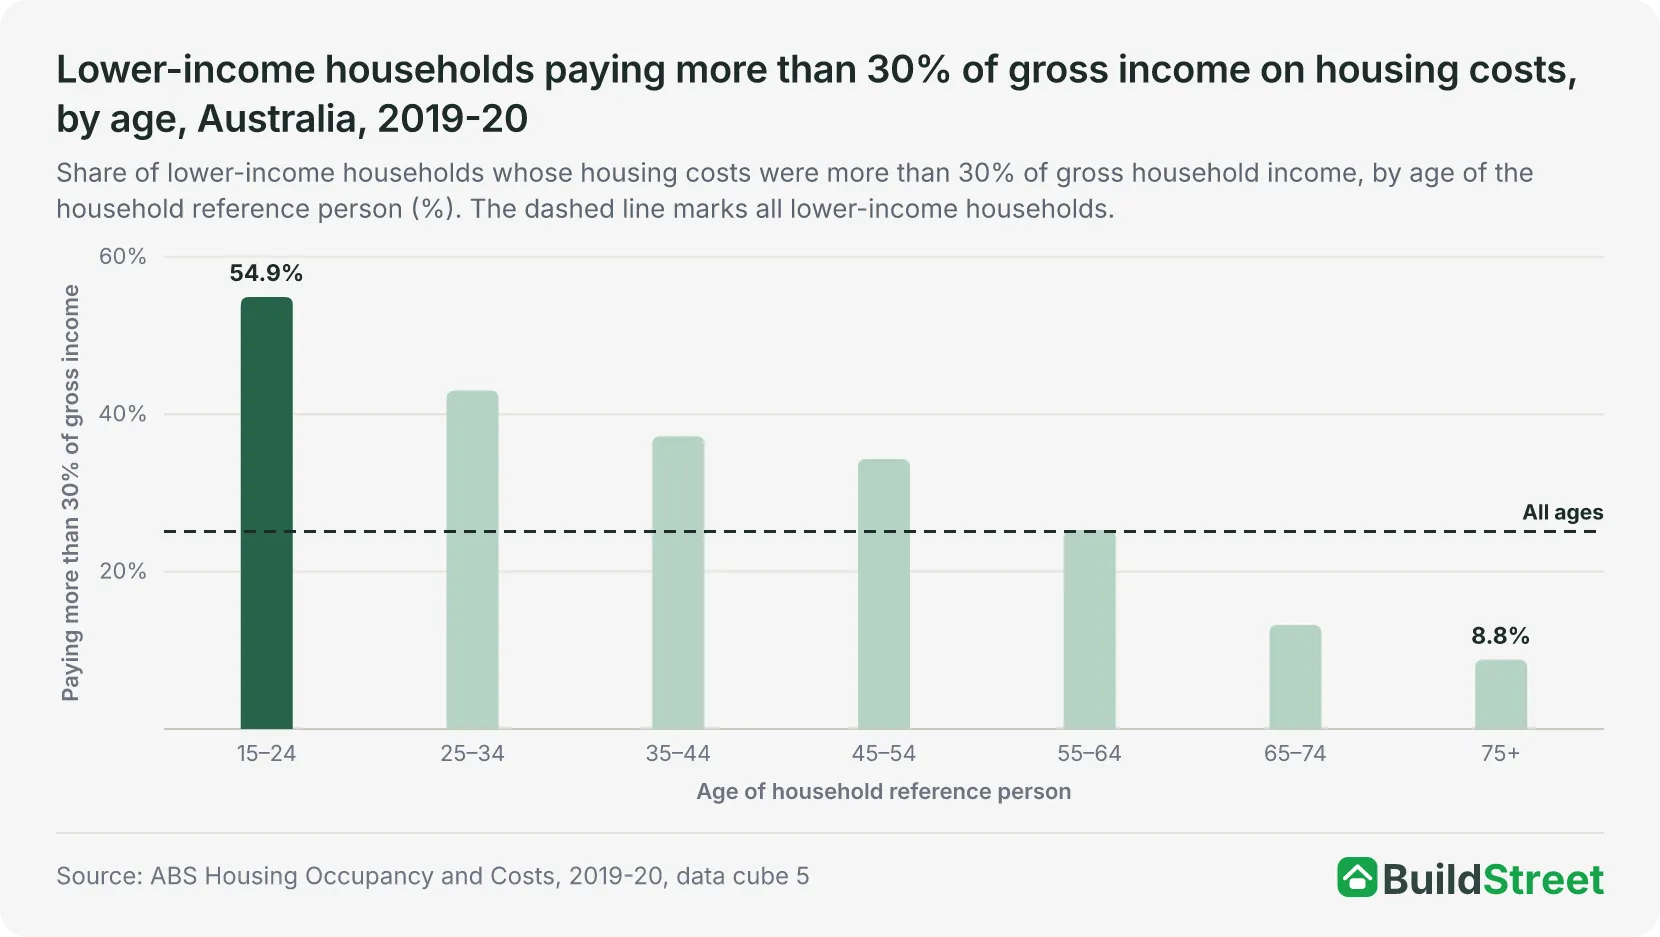
In 2019-20, 10.9 per cent of lower-income households with a reference person aged 65 and over spent more than 30 per cent of gross household income on housing costs. This compared with 25.1 per cent of lower-income households of all ages, according to the Australian Bureau of Statistics (ABS) Survey of Income and Housing5.
The share of lower-income households spending more than 30 per cent of their income on housing was 13.2 per cent for those with a reference person aged 65 to 74 and 8.8 per cent for those aged 75 and over5. The 4.4 percentage point gap between the two age groups is larger than the margin of error for the difference, of about 3.3 percentage points.
The 30/40 measure counts a household as being in housing stress when it has a lower income and spends more than 30 per cent of its gross income on housing costs. The ABS defines lower-income households as those between the 3rd and 40th percentiles of household income, adjusted for household size and composition5.
In 2019-20, 58.0 per cent of lower-income households of all ages that rented from a private landlord spent more than 30 per cent of their gross household income on housing costs5.
| Lower-income households paying more than 30% of gross income on housing costs, by age, Australia, 2019-20 | ||
|---|---|---|
| Age of household reference person | Paying more than 30% (%) | Margin of error (±) |
| 15 to 24 | 54.9 | 9.0 |
| 25 to 34 | 43.0 | 5.4 |
| 35 to 44 | 37.2 | 4.8 |
| 45 to 54 | 34.3 | 4.8 |
| 55 to 64 | 25.3 | 3.5 |
| 65 to 74 | 13.2 | 2.3 |
| 75 and over | 8.8 | 2.4 |
| All ages | 25.1 | 1.4 |
| 65 and over | 10.9 | 1.7 |
Source · ABS Housing Occupancy and Costs, 2019-20, data cube 5, Table 5.2.
Section 04 · Private renters
What share of income do older private renters spend on housing?
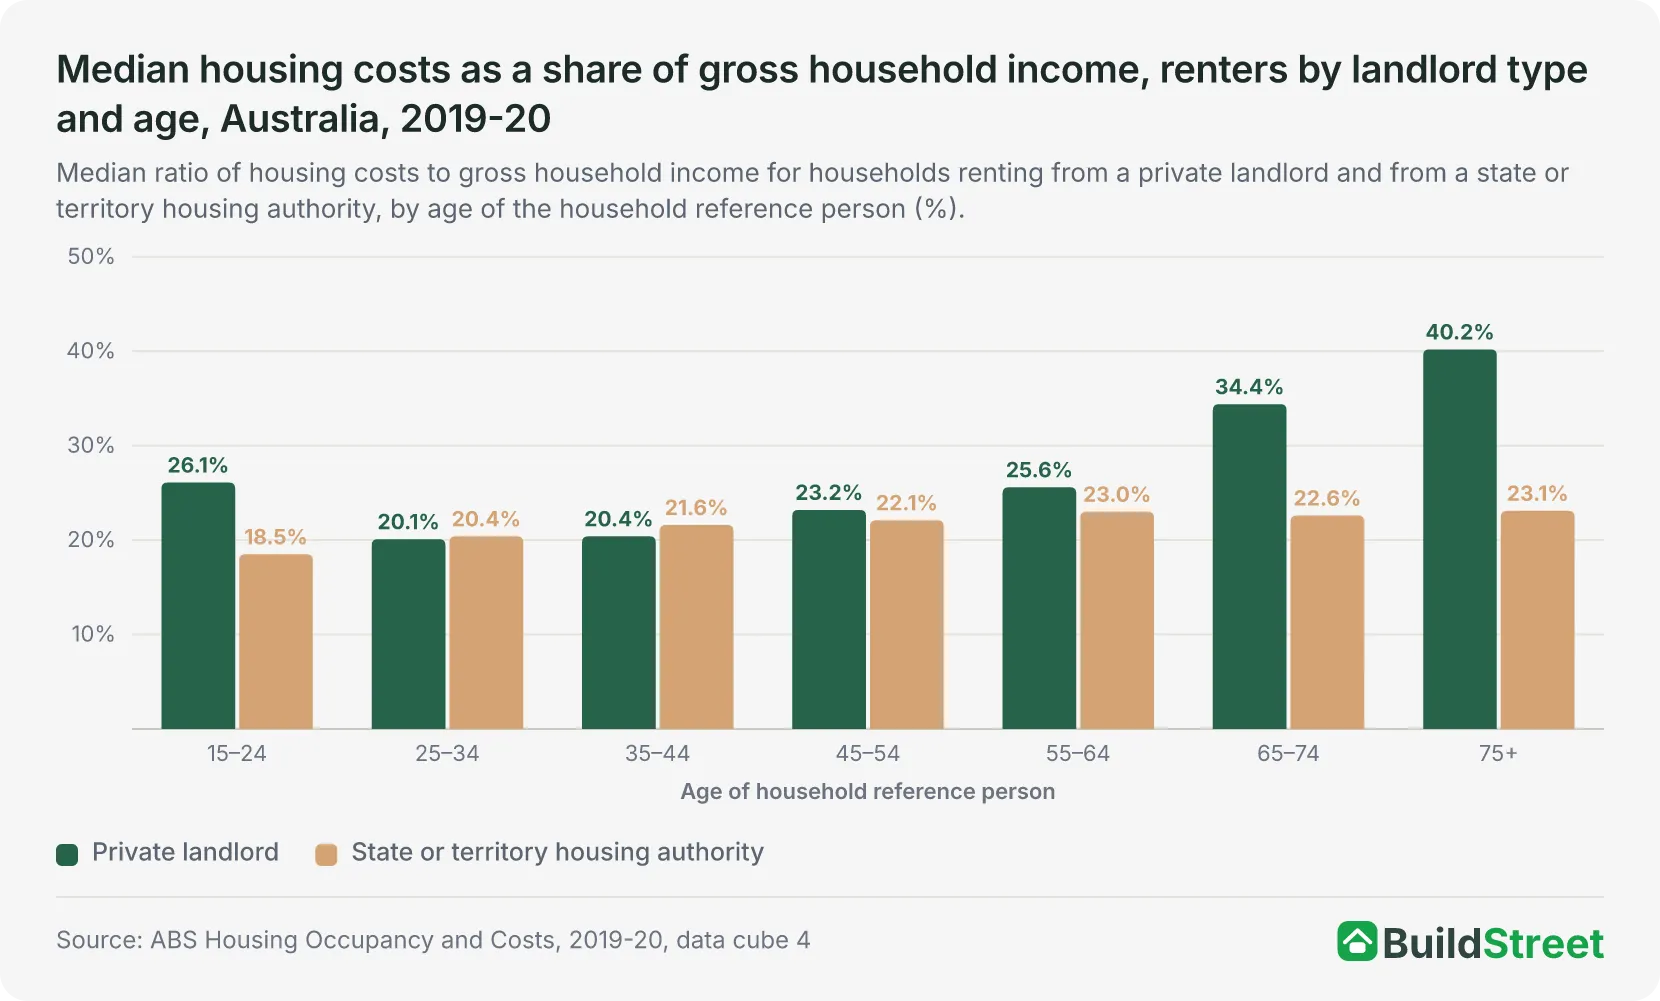
Private renter households with a reference person aged 65 and over spent a median of 37.4 per cent of their gross household income on housing costs in 2019-20. This compared with 22.3 per cent for private renter households of all ages, according to the Australian Bureau of Statistics (ABS) Survey of Income and Housing6.
The median was 34.4 per cent for private renter households with a reference person aged 65 to 74 and 40.2 per cent for those aged 75 and over6. The difference between the two age groups is within the survey’s margins of error, of 4.9 and 4.5 percentage points.
Both older age groups of private renters recorded higher medians than every younger age group. Among younger households, the medians ranged from 20.1 per cent for those aged 25 to 34 to 26.1 per cent for those aged 15 to 246. The margins of error for the older groups do not overlap with those of any younger group.
Section 05 · Rent Assistance
How much does Rent Assistance reduce rental stress for older renters?
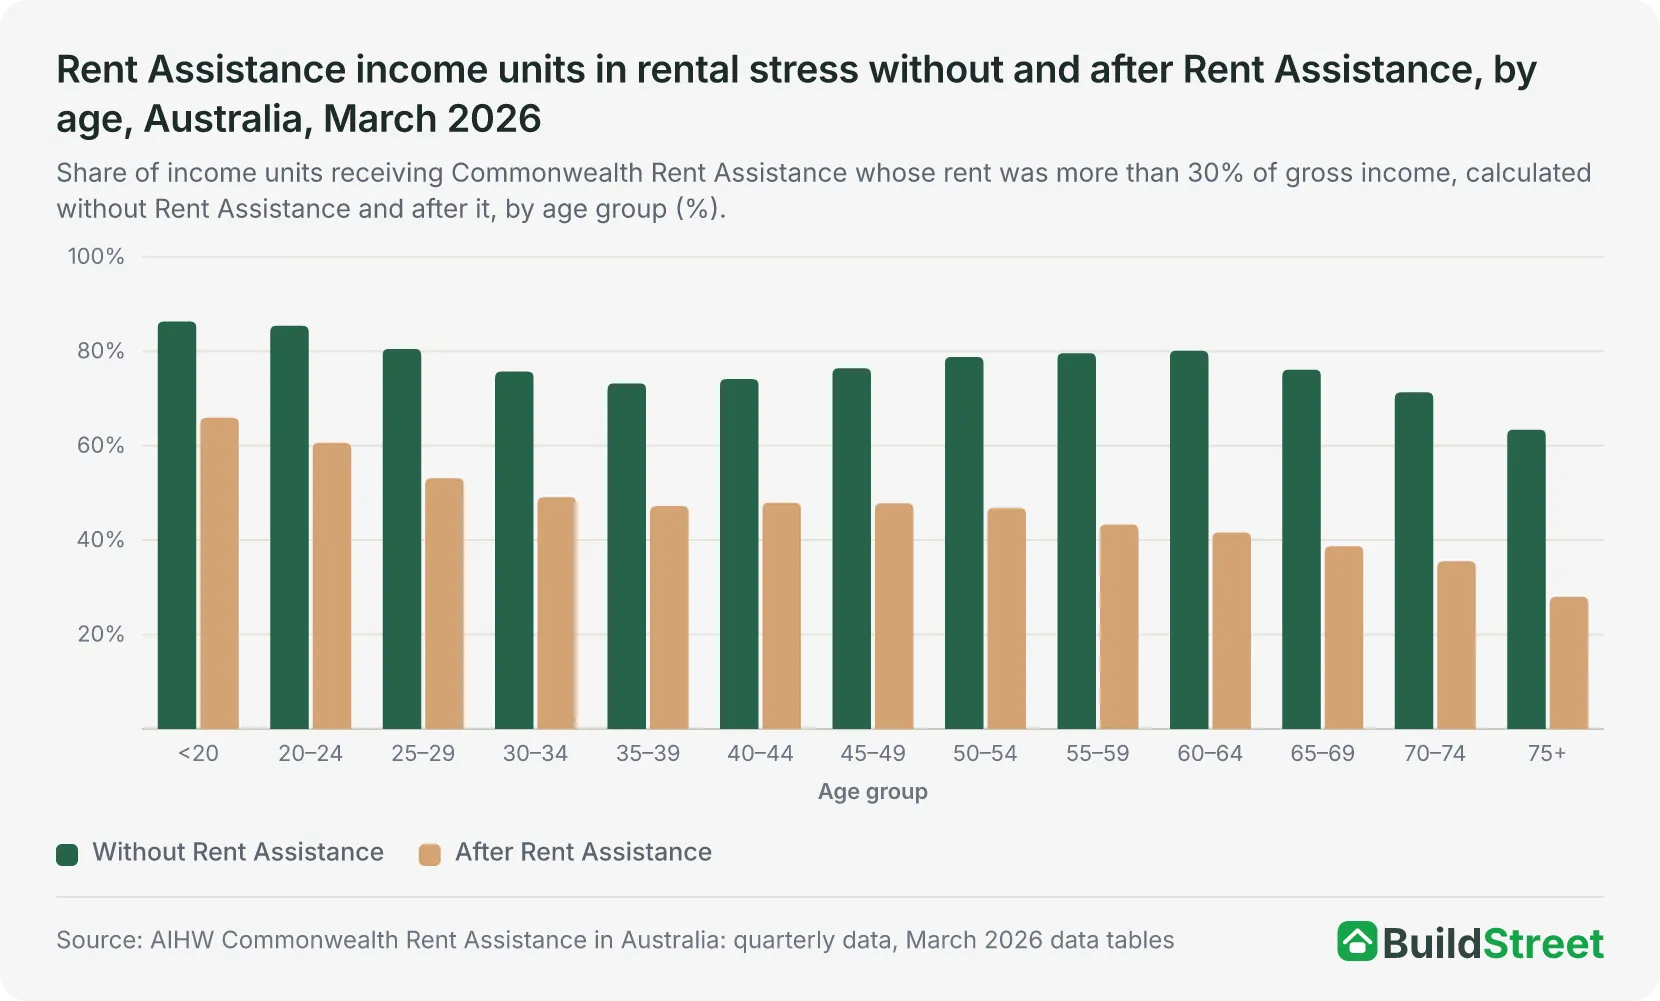
In March 2026, 32.7 per cent of Rent Assistance income units aged 65 and over were in rental stress after the payment. Without it, 68.7 per cent would have been in rental stress, according to the Australian Institute of Health and Welfare (AIHW)4. The number in rental stress was 133,115 income units after Rent Assistance, compared with 279,760 without it.
The AIHW defines rental stress as spending more than 30 per cent of gross income on rent after Rent Assistance has been deducted. Gross income includes income support payments4.
In March 2026, 38.7 per cent of income units aged 65 to 69 were in rental stress after Rent Assistance, compared with 28.0 per cent of those aged 75 and over4. The share was 35.5 per cent for income units aged 70 to 74. Across all ages, 44.0 per cent of income units were in rental stress after the payment.
The share of income units aged 65 and over in rental stress after Rent Assistance increased from 28.4 per cent in June 2013 to 32.7 per cent in March 2026, an increase of 4.3 percentage points4.
The Age Pension accounted for the largest number of income units receiving Rent Assistance of any primary payment type in March 2026, at 334,9104. Among these income units, 32.4 per cent were in rental stress after Rent Assistance.
Rent Assistance is generally paid at 75 cents for each dollar of rent above a threshold, up to a maximum rate that depends on the recipient’s family situation, according to the Department of Social Services (DSS)3. Rent Assistance paid with the Age Pension stops after 26 weeks outside Australia, or earlier if the recipient no longer pays rent in Australia7.
At June 2025, Rent Assistance covered between 32 and 41 per cent of the fortnightly rent of income units of all ages in the capital cities, depending on the state or territory, and between 37 and 41 per cent in the rest of each state or territory8.
Section 06 · States and territories
Which states and territories have the most older renters receiving Rent Assistance?
New South Wales recorded the largest number of Rent Assistance income units aged 65 and over of any state or territory in March 2026, at 141,410. This was followed by Queensland at 106,625 and Victoria at 83,525, according to the Australian Institute of Health and Welfare (AIHW)4. Western Australia, South Australia and Tasmania recorded 34,025, 28,745 and 10,920, respectively.
In March 2026, New South Wales and Queensland recorded the highest shares of Rent Assistance income units aged 65 and over among the states and territories, at 30.5 and 30.4 per cent, respectively4. The Australian Capital Territory (ACT) recorded the lowest share at 18.6 per cent.
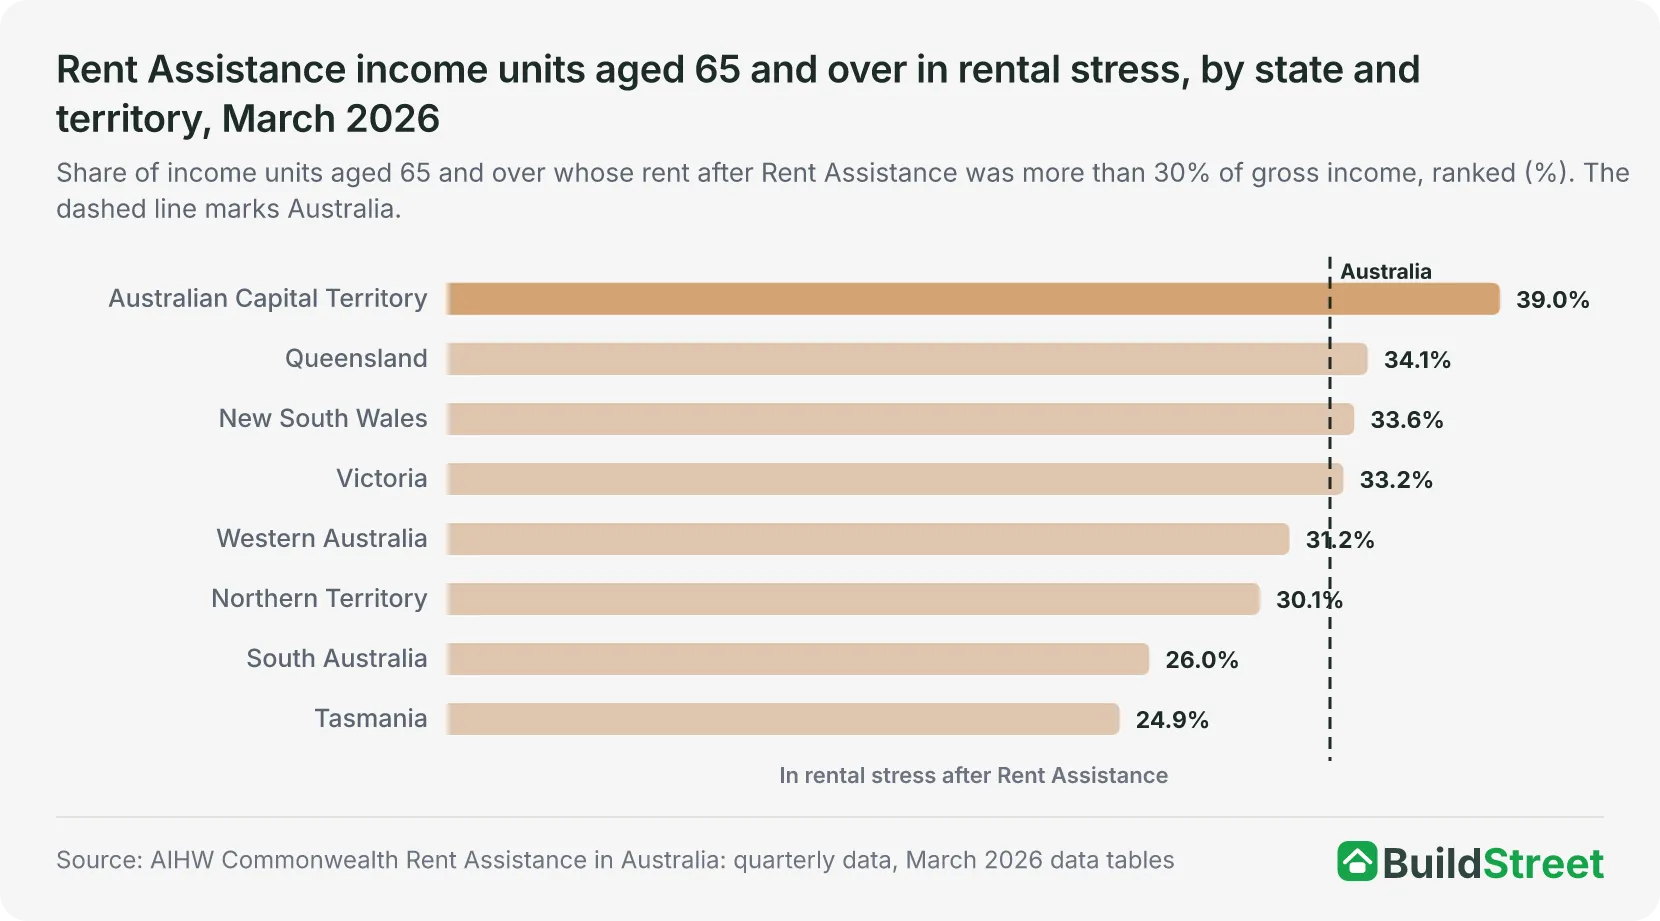
The ACT recorded the highest share of income units aged 65 and over in rental stress after Rent Assistance at 39.0 per cent4. This was based on 2,115 income units whose housing affordability could be assessed. Tasmania recorded the lowest share at 24.9 per cent.
In Queensland, New South Wales and Victoria, the shares of older income units in rental stress after Rent Assistance were 34.1, 33.6 and 33.2 per cent, respectively, compared with 32.7 per cent nationally4.
| Rent Assistance income units aged 65 and over by state and territory, March 2026 | ||||
|---|---|---|---|---|
| State or territory | Income units aged 65 and over | Share of all Rent Assistance income units in the state or territory (%) | In rental stress after Rent Assistance | Share in rental stress (%) |
| New South Wales | 141,410 | 30.5 | 47,255 | 33.6 |
| Queensland | 106,625 | 30.4 | 36,130 | 34.1 |
| Victoria | 83,525 | 25.8 | 27,595 | 33.2 |
| Western Australia | 34,025 | 29.5 | 10,520 | 31.2 |
| South Australia | 28,745 | 28.5 | 7,435 | 26.0 |
| Tasmania | 10,920 | 27.7 | 2,700 | 24.9 |
| Australian Capital Territory | 2,125 | 18.6 | 825 | 39.0 |
| Northern Territory | 2,115 | 24.1 | 630 | 30.1 |
| Australia | 409,570 | 29.0 | 133,115 | 32.7 |
Source · AIHW Commonwealth Rent Assistance in Australia: quarterly data, Tables CRA.1 and CRA.2.
Section 07 · Social housing
How many older Australians are social housing tenants?
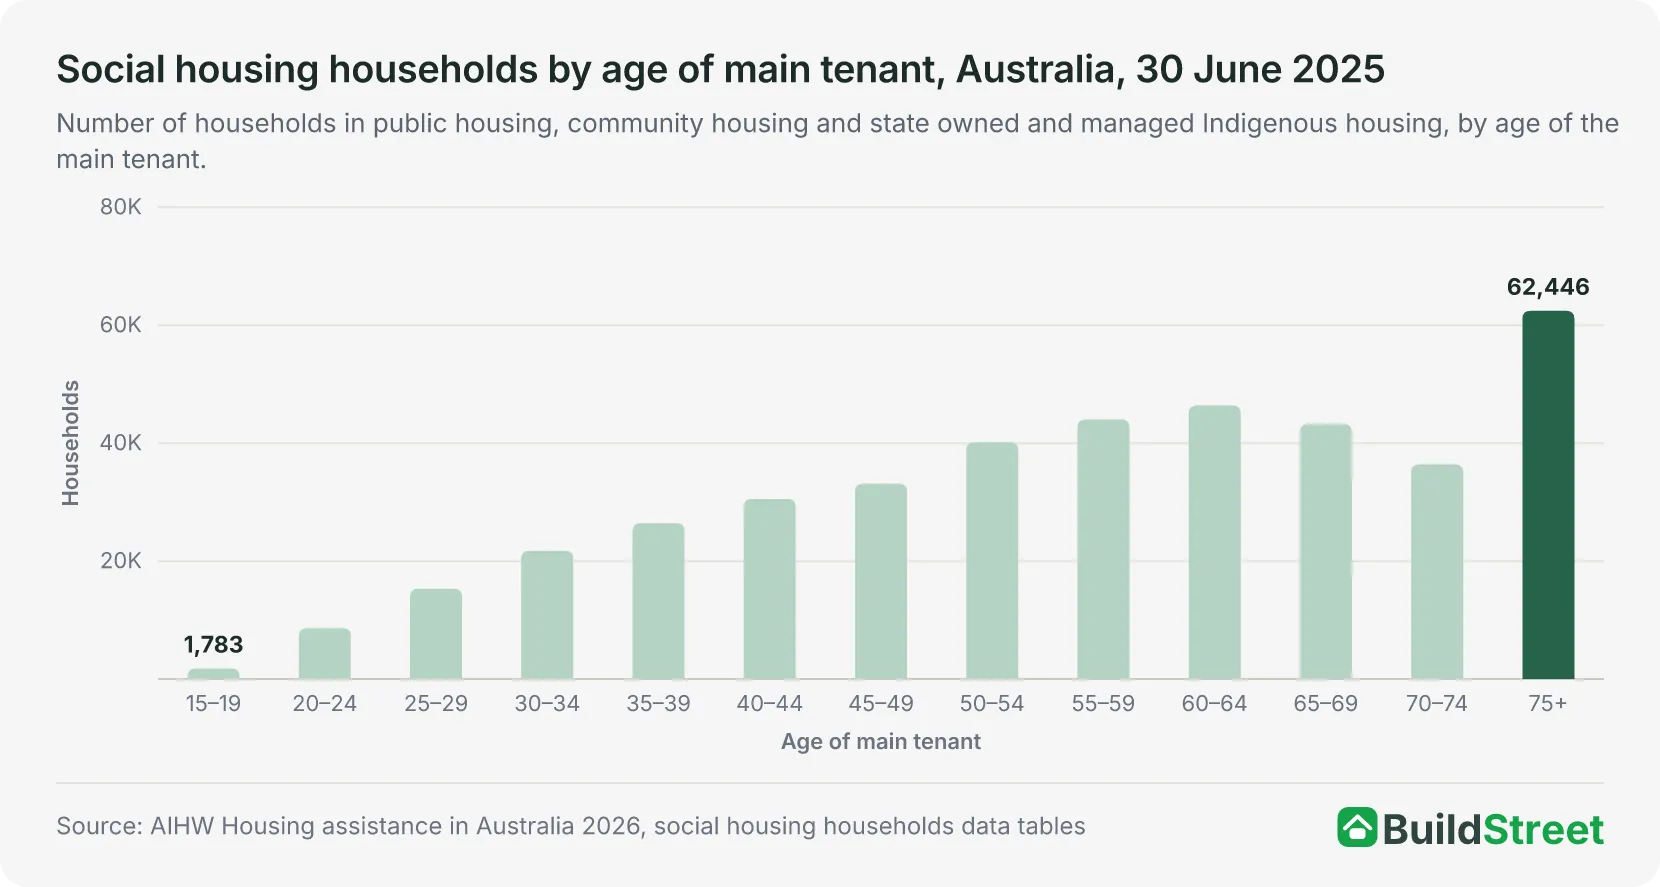
At 30 June 2025, 142,099 social housing households had a main tenant aged 65 and over. This was equivalent to 34.5 per cent of the 411,633 households in public housing, community housing and state owned and managed Indigenous housing, according to the Australian Institute of Health and Welfare (AIHW)9. Households with a main tenant aged 75 and over numbered 62,446, or 15.2 per cent.
At 30 June 2025, about two in three social housing households had a main tenant aged 50 and over, equivalent to 66.2 per cent9.
Public housing recorded the highest share of households with a main tenant aged 65 and over among the three programs, at 37.0 per cent, or 105,460 of 285,256 households9. The share was 30.9 per cent in community housing and 15.9 per cent in state owned and managed Indigenous housing.
In 2024-25, 2,714 of the 16,016 newly allocated public housing households, or 16.9 per cent, had a main tenant aged 65 and over. This compared with 37.0 per cent of all public housing households at 30 June 20259.
The number of households on the combined social housing waitlist increased from 183,000 at 30 June 2024 to 206,000 at 30 June 202510. The AIHW does not publish the waitlist by the age of applicants.
| Social housing households with an older main tenant by program, Australia, 30 June 2025 | ||||
|---|---|---|---|---|
| Social housing program | All households | Main tenant aged 65 and over | Main tenant aged 75 and over | Aged 65 and over, share (%) |
| Public housing | 285,256 | 105,460 | 46,881 | 37.0 |
| Community housing | 110,326 | 34,094 | 14,813 | 30.9 |
| State owned and managed Indigenous housing | 16,051 | 2,545 | 752 | 15.9 |
| All three programs | 411,633 | 142,099 | 62,446 | 34.5 |
Source · AIHW Housing assistance in Australia 2026, Table HOUSEHOLDS.4.
Section 08
Frequently asked questions
What is housing stress for renters in Australia?
Under the 30/40 measure used by the Australian Bureau of Statistics, a household is in housing stress when it contains people between the 3rd and 40th percentiles of equivalised disposable household income and spends more than 30 per cent of its gross income on housing costs. The Australian Institute of Health and Welfare counts a Rent Assistance recipient as in rental stress when rent, after Rent Assistance is deducted, is more than 30 per cent of gross income.
How many older renters are in rental stress?
In March 2026, 133,115 income units aged 65 and over receiving Commonwealth Rent Assistance were in rental stress after the payment. This represented 32.7 per cent, according to the Australian Institute of Health and Welfare. Without Rent Assistance, 279,760 income units, or 68.7 per cent, would have been in rental stress.
Is rental stress among older Rent Assistance recipients increasing?
The share of Rent Assistance income units aged 65 and over in rental stress after the payment increased from 28.4 per cent in June 2013 to 32.7 per cent in March 2026, according to the Australian Institute of Health and Welfare. Over the same period, the number of those income units in rental stress increased from 65,980 to 133,115.
Which state has the most older renters on Rent Assistance?
New South Wales recorded the largest number of Rent Assistance income units aged 65 and over of any state or territory in March 2026, at 141,410, followed by Queensland at 106,625 and Victoria at 83,525. The Australian Capital Territory recorded the highest share of those income units in rental stress after Rent Assistance, at 39.0 per cent, based on about 2,100 income units.
References
- ABS Housing Occupancy and Costs, 2019-20, data cube 6: Age of household reference person · Australian Bureau of Statistics ↑ b c d
- ABS media statement, Survey of Income and Housing results will not be released · Australian Bureau of Statistics ↑
- DSS Benefit and Payment Recipient Demographics, June 2026 · data.gov.au ↑ b c
- AIHW Commonwealth Rent Assistance in Australia: quarterly data, data tables June 2013 to March 2026 · aihw.gov.au ↑ b c d e f g h i j k l m
- ABS Housing Occupancy and Costs, 2019-20, data cube 5: Housing costs as a proportion of income ranges · Australian Bureau of Statistics ↑ b c d
- ABS Housing Occupancy and Costs, 2019-20, data cube 4: Housing costs as a proportion of income · Australian Bureau of Statistics ↑ b c
- Department of Social Services, Social Security Guide 7.1.2, Payments with unlimited portability · guides.dss.gov.au ↑
- AIHW Housing assistance in Australia 2026: Financial assistance · aihw.gov.au ↑
- AIHW Housing assistance in Australia 2026: Data tables, social housing households · aihw.gov.au ↑ b c d
- AIHW Housing assistance in Australia 2026 — Households and waitlists · aihw.gov.au ↑
