

Published 24 July 2026
Australia's population aged 65 and over reached 4,700,531 people at 30 June 2024, up 80.0% since 2005, more than double the 34.8% growth in Australia's total population over the same period. Yet houses still accounted for 65.1% of new dwelling completions in 2024–25, close to their share twenty years earlier.
Official data shows that Australia's ageing population has not yet produced a sustained shift in the national mix of houses and higher-density dwellings. The clearest measurable changes are instead appearing in accessibility standards and purpose-built aged-care accommodation.
 What's driving housing demand in Australia in 2026: population, immigration and household formationHow population growth, overseas migration and smaller households combine to shape the number of homes Australia needs each year.
 Migration and housing demand across Australia's capital citiesA city-by-city look at net overseas migration and what it means for dwelling demand in Sydney, Melbourne, Brisbane, Perth, Adelaide, Hobart, Darwin and Canberra.
Section 01 · Population growth
How many Australians are aged 65 and over?
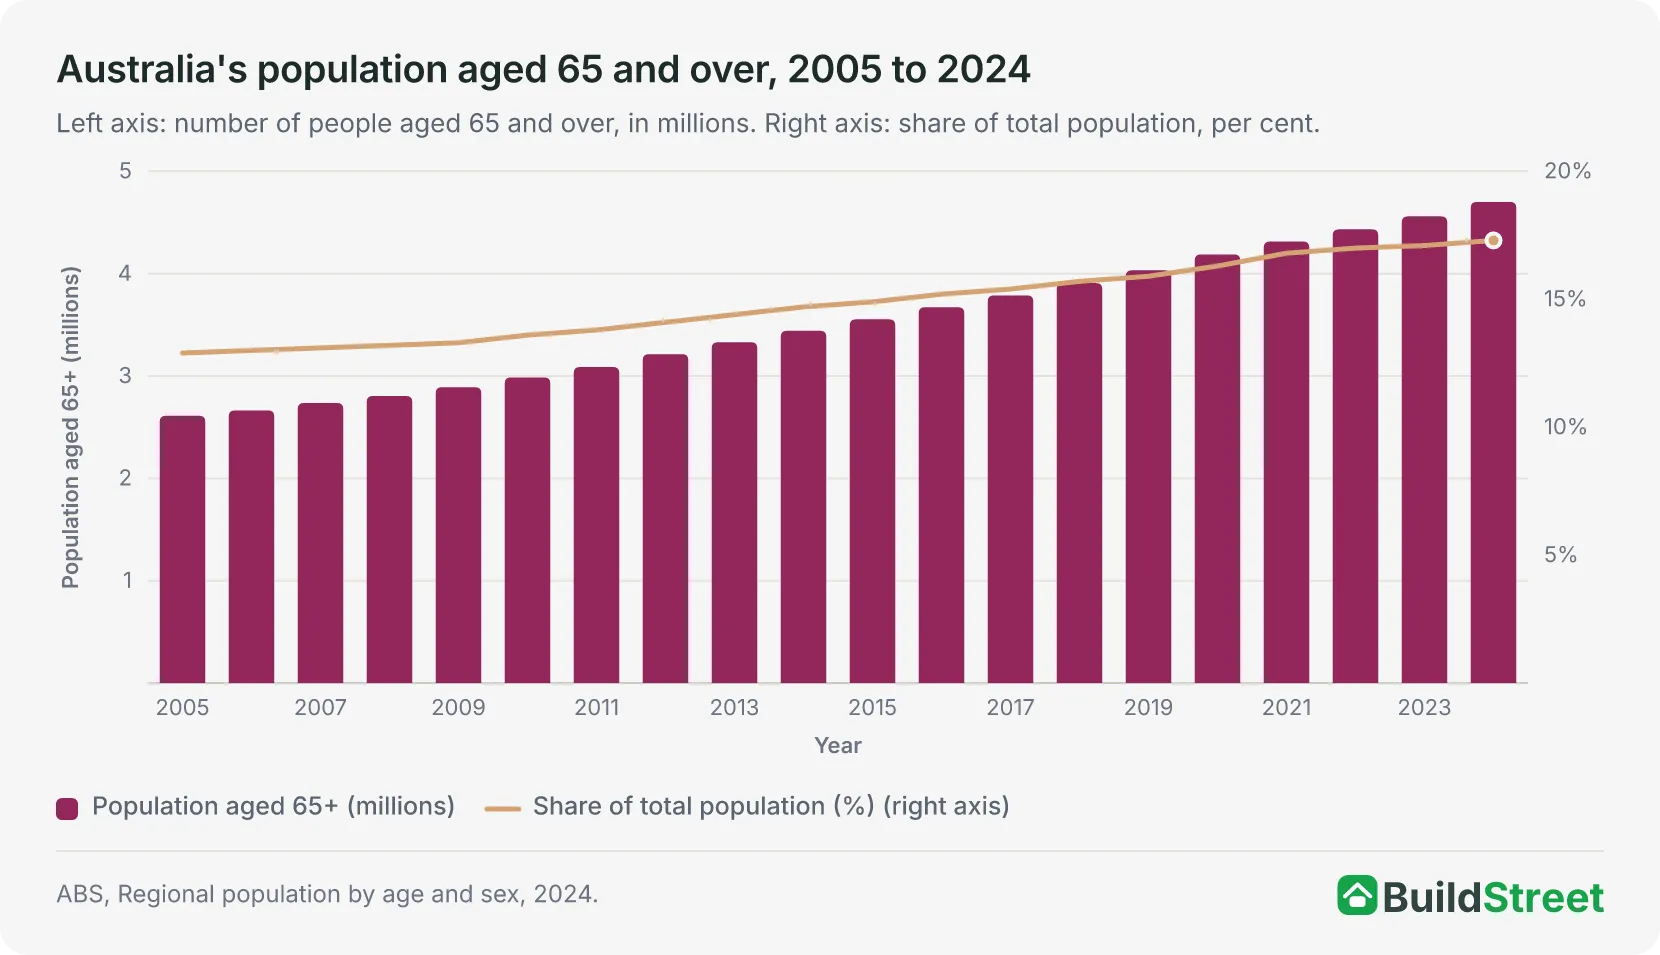
Australia had 4,700,531 people aged 65 and over at 30 June 2024, equal to 17.3% of the population. That share has climbed every year for two decades, up from 12.9% in 2005. In raw numbers, the 65-plus population grew by 2,088,652 people over that period, an increase of 80.0%, while the total population grew by 7,017,525 people, an increase of 34.8%. Australia's older population is growing at more than double the rate of the population as a whole.
Australia's total population reached 27,801,023 at 31 December 2025, up 1.5% over the year. The most detailed age breakdown available is still for 30 June 2024, since single-year age data take longer to compile than headline population counts.
These projections come from the Centre for Population and are conditional scenarios based on stated assumptions about fertility, mortality and migration, not guarantees. They indicate the possible direction and scale of population ageing rather than an exact future outcome.
Ageing is also unevenly distributed across cities and regions. In 2023-24, around 15% of capital city residents were aged 65 and over, compared with 21% outside the capitals. The Centre for Population projects these shares to reach roughly 17% and 25%, respectively, by 2035–36.
Section 02 · Ageing by state
Which Australian states and regions have the oldest populations?
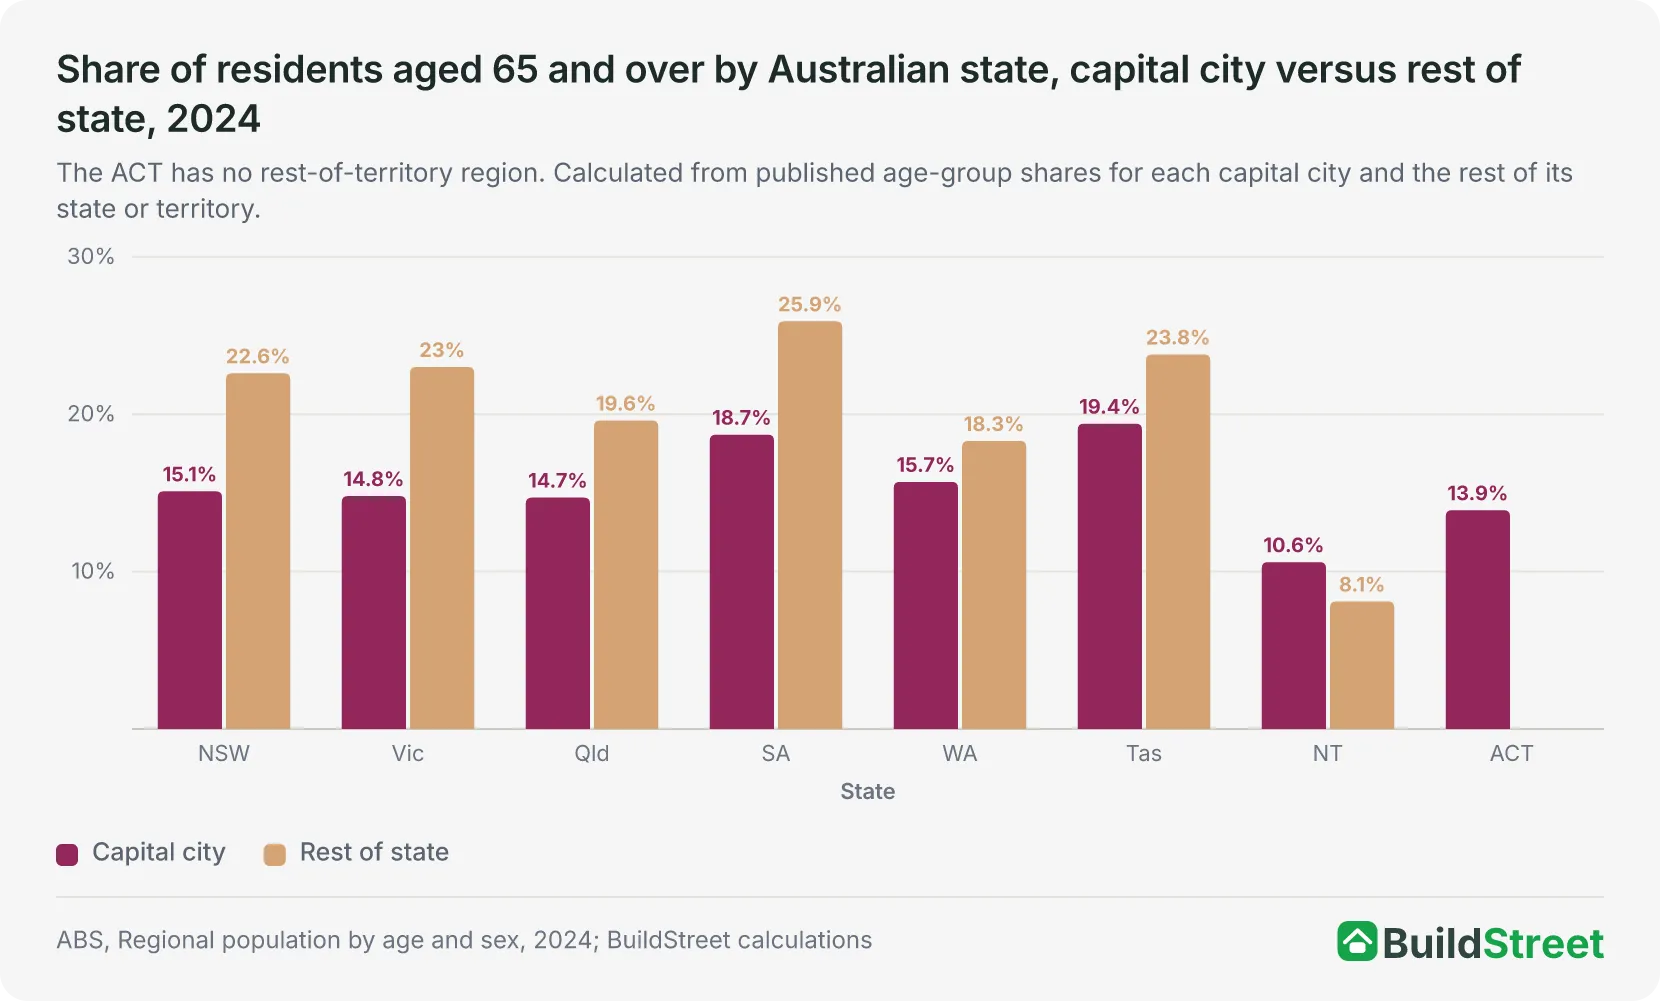
Regional South Australia had the highest share of residents aged 65 and over in 2024, at 25.9%, followed by regional Tasmania at 23.8% and regional Victoria at 23.0%. Every Australian capital city, except for Darwin, has a younger population than the rest of its own state, but few gaps run this wide.
Victoria recorded the widest capital-versus-region gap. Melbourne's 65-plus share was 14.8%, compared with 23.0% across the rest of Victoria, a difference of 8.2 percentage points. New South Wales recorded the next-largest gap, with 15.1% in Sydney and 22.6% across the rest of the state, a difference of 7.5 percentage points. South Australia followed, with 18.7% in Adelaide and 25.9% across the rest of the state.
Darwin was the exception. At 10.6% aged 65 and over, it has an older population than the rest of the Northern Territory, at 8.1%. It was the only jurisdiction where the capital's 65-plus share exceeded that of its regional areas. This reflects a younger regional population in the Territory rather than rapid ageing in Darwin itself.
- Capital city 65+ share
- 15.1%
- Rest-of-state 65+ share
- 22.6%
- Median age, capital city
- 36.8
- Median age, rest of state
- 42.4
- Livable housing standard
- Not adopted statewide
- Capital city 65+ share
- 14.8%
- Rest-of-state 65+ share
- 23%
- Median age, capital city
- 36.6
- Median age, rest of state
- 43.2
- Livable housing standard
- Implemented, 1 May 2024
- Capital city 65+ share
- 14.7%
- Rest-of-state 65+ share
- 19.6%
- Median age, capital city
- 36.4
- Median age, rest of state
- 40.8
- Livable housing standard
- Implemented, 1 October 2023
- Capital city 65+ share
- 18.7%
- Rest-of-state 65+ share
- 25.9%
- Median age, capital city
- 39.2
- Median age, rest of state
- 47
- Livable housing standard
- Implemented, 1 October 2024
- Capital city 65+ share
- 15.7%
- Rest-of-state 65+ share
- 18.3%
- Median age, capital city
- 37.5
- Median age, rest of state
- 40.6
- Livable housing standard
- Voluntary only
- Capital city 65+ share
- 19.4%
- Rest-of-state 65+ share
- 23.8%
- Median age, capital city
- 39.3
- Median age, rest of state
- 45.1
- Livable housing standard
- Implemented, 1 October 2024
- Capital city 65+ share
- 10.6%
- Rest-of-state 65+ share
- 8.1%
- Median age, capital city
- 34.8
- Median age, rest of state
- 32.6
- Livable housing standard
- Implemented, 1 October 2023
- Capital city 65+ share
- 13.9%
- Rest-of-state 65+ share
- %
- Median age, capital city
- 35.7
- Median age, rest of state
- Livable housing standard
- Implemented, 15 January 2024
South Australia and Tasmania had older populations in both their capitals and regional areas. Queensland and Western Australia show the opposite pattern: comparatively young capitals paired with regional areas that are also ageing more slowly than the southern states. The age data alone do not establish why this difference exists.
For construction, this geography matters as much as the national trend. Using the national 17.3% figure as a planning benchmark would understate the position in every rest-of-state region except the Northern Territory, and most sharply in South Australia, Tasmania, Victoria and New South Wales, where regional 65+ shares run five to nine percentage points above the national figure.
By comparison, the national figure was higher than the 65-plus share in Sydney, Melbourne, Brisbane, Perth, Darwin and Canberra, but lower than the shares in Adelaide and Hobart.
Section 03 · Downsizing behaviour
How many older Australians want to downsize, and how many actually do?
Most Australians aged 60 and over preferred to remain in their own home, according to the Productivity Commission's 2015 survey of 1,524 people. The survey found that 83% preferred their own home as their living arrangement.
About one in five had already sold a property and bought a less expensive home since turning 50, and about 5% had sold a property and moved into rental housing. Separately, 15% expected to downsize into a more suitable dwelling or age-specific housing at some point.
| Measure | Figure | What it represents | Caution |
|---|---|---|---|
| Preferred living arrangement | 83% | Own home | Australians aged 60+, 2015 survey |
| Completed down-valuing | About one in five | Sold and bought a less expensive home since age 50 | Not necessarily fewer bedrooms or a smaller home |
| Sold and moved to rent | About 5% | Property sale followed by renting | Since age 50 |
| Expected to downsize | 15% | More suitable dwelling or age-specific housing | An intention, not a completed move |
| Timing | More than 85% | Downsized before age 70 | Among those who had downsized |
| Equity release as the main reason | About one-sixth | Share of downsizers who cited equity release as their primary reason | Under 4% of older homeowners overall |
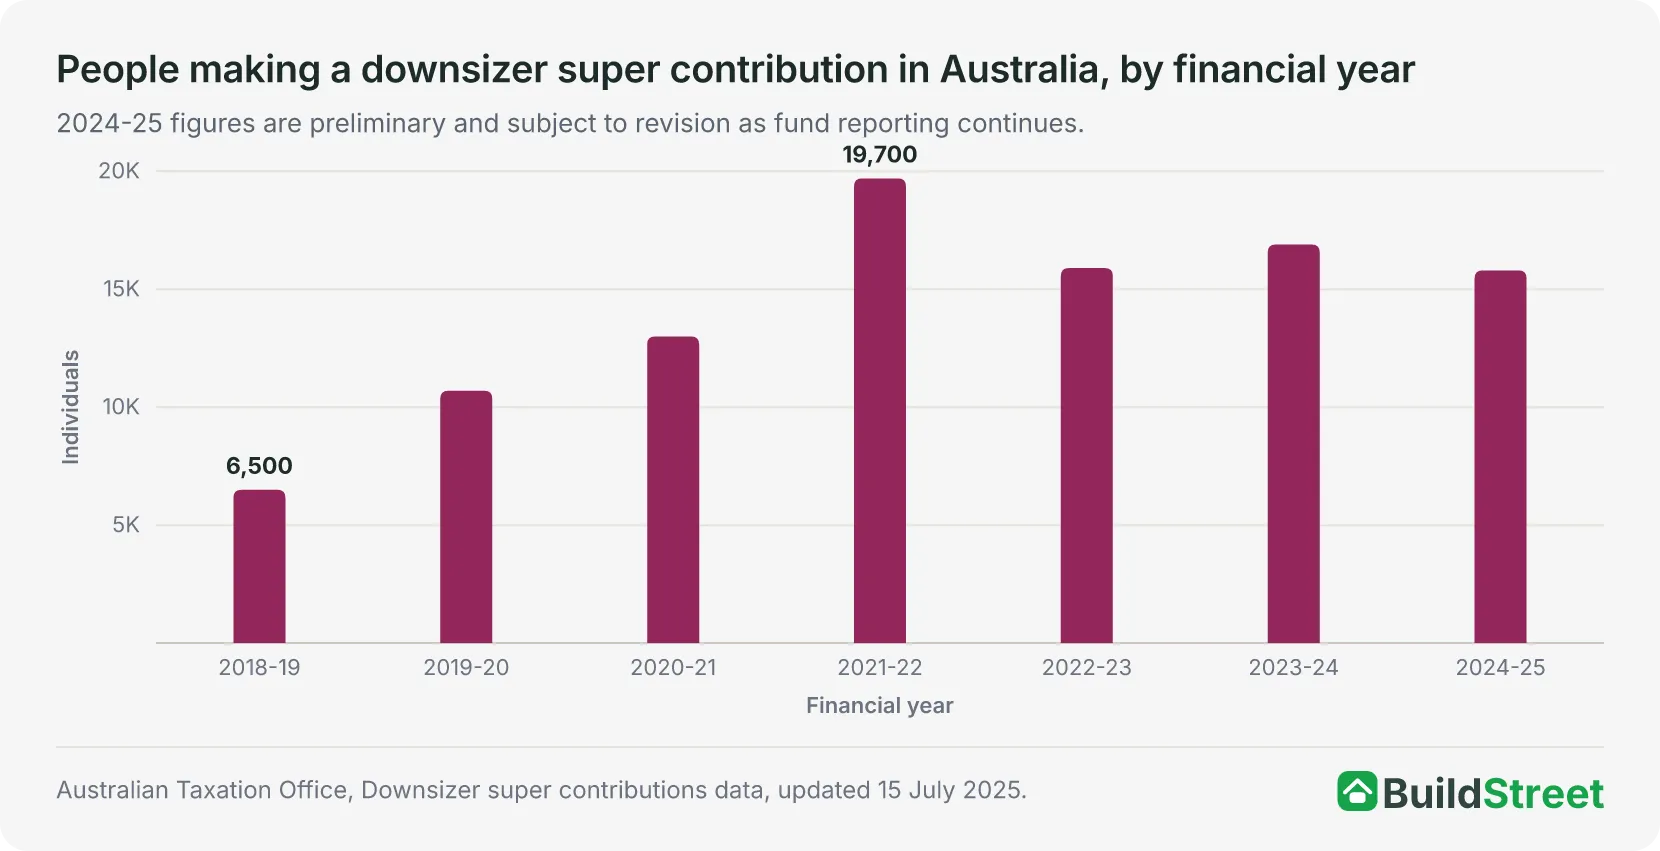
| Downsizer super contribution, 2024-25 | 15,800 people | Made a downsizer contribution to super after selling a home held for at least 10 years | A tax/super event, not a measure of dwelling size or bedroom count |
Source · Productivity Commission, Housing Decisions of Older Australians, December 2015; Australian Taxation Office, Downsizer super contributions data, updated 15 July 2025.
Preliminary ATO data shows that 15,800 people made a downsizer contribution in 2024–25, with contributions totalling $4.165 billion. The figures are subject to revision as superannuation fund reporting continues. Since the scheme began in 2018–19, the data records 98,500 contributors and $25.255 billion in contributions.
Eligibility was progressively lowered from 65 to 60 during 2022-23, then to 55 from 1 January 2023. The highest year on record remains 2021-22, at 19,700 people, before eligibility was widened further. Contributions did not rise further once eligibility widened.
Women have made up 53% to 58% of contributors in every year since the scheme began. However, the data does not show whether contributors moved into smaller homes. A person can make a downsizer contribution after selling and buying an equally sized but less expensive home.
About one in six downsizers cited equity release as their main reason for moving, equal to fewer than 4% of older homeowners overall. The survey therefore did not identify equity release as the main reason for most completed moves.
Section 04 · Housing stock
The mismatch between housing stock and an ageing population
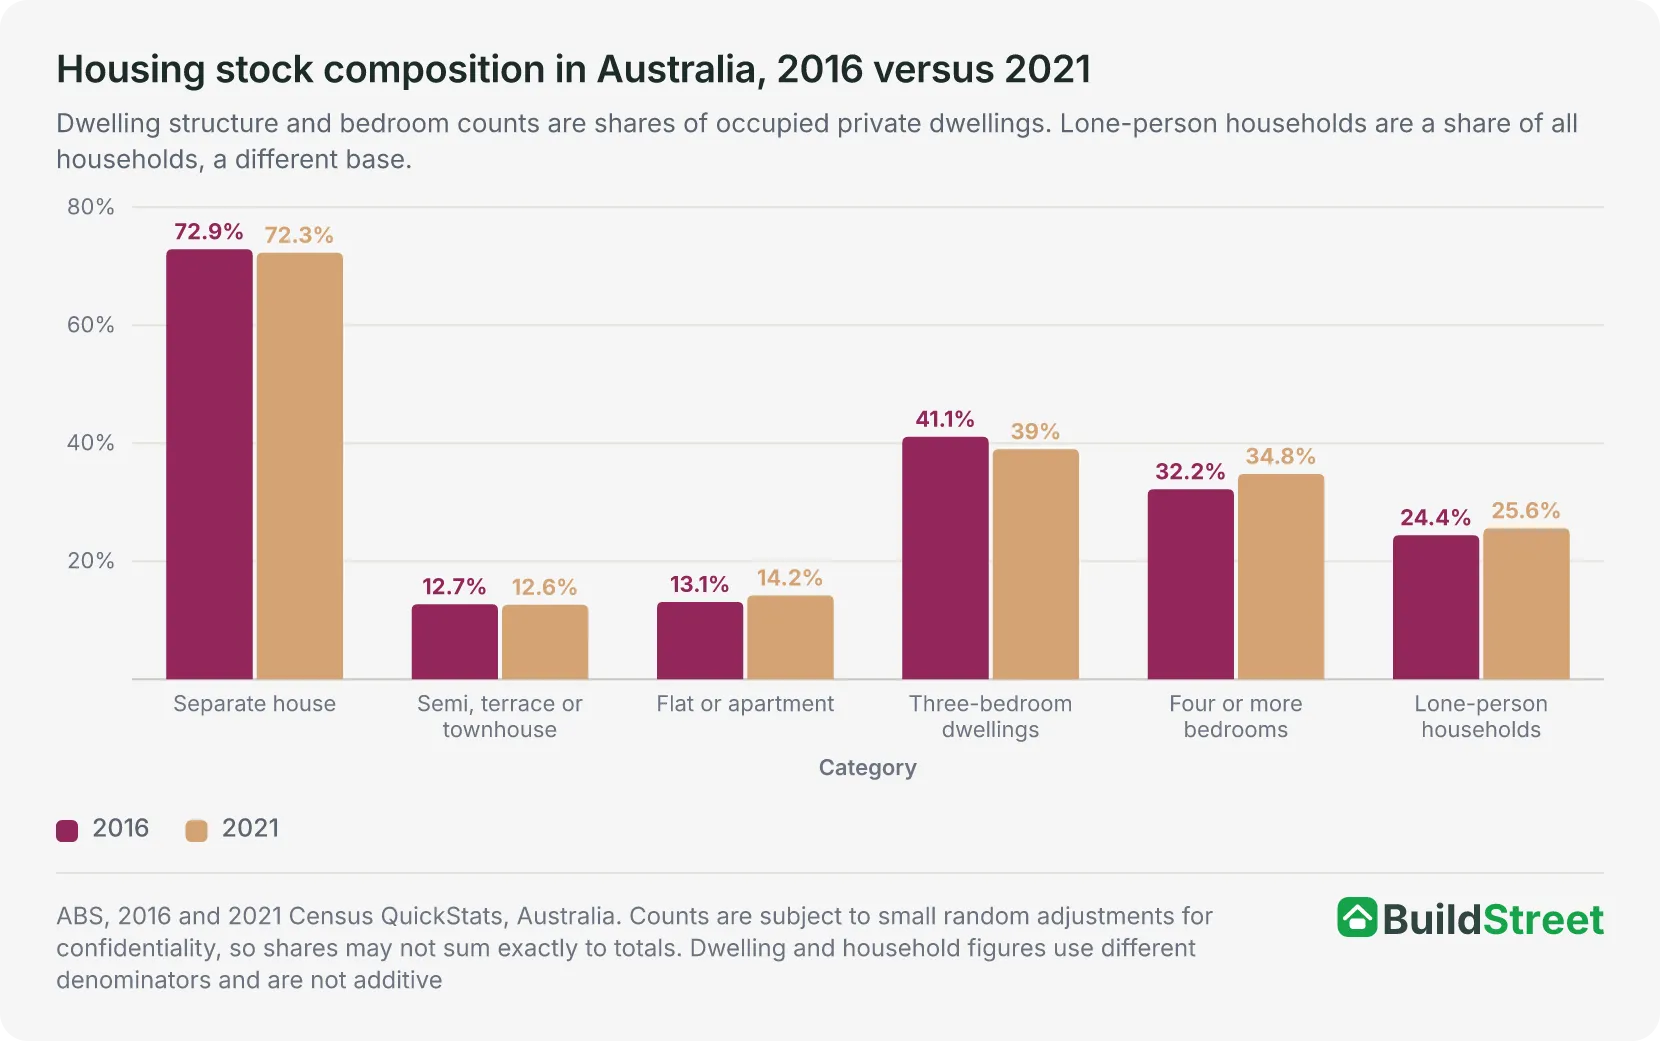
Separate houses accounted for 72.3% of occupied private dwellings at the 2021 Census, down only marginally from 72.9% in 2016. Large detached homes still dominate the national housing stock, even as the population ages and average household sizes decline. Flats and apartments grew from 13.1% to 14.2% of the stock over the same period, the largest proportional shift in either direction, though still a small share of the total.
The share of dwellings with four or more bedrooms rose from 32.2% of the stock in 2016 to 34.8% in 2021, while three-bedroom dwellings fell from 41.1% to 39.0%. This increased the proportion of larger dwellings during a period when lone-person households also became more common. The average dwelling had 3.1 bedrooms in 2021, compared with an average household size of 2.5 people.
Source: AIHW, Older Australians: housing and living arrangements, based on the 2017-18 Survey of Income and Housing and the 2016 Census.
Among older couple households, 89% lived in a separate house in 2017-18, while 67% of older lone-person households did the same. Both figures show that detached housing remained common among older households. Under the 2016 Census occupancy standard, 76% of older couple households and 65% of older lone-person households had at least two spare bedrooms.
Australia's household count is projected to rise through 2046
ABS projections have the number of Australian households rising from 10.0 million in 2021 to between 13.3 million and 13.9 million by 2046. The range reflects three projection series based on different assumptions about future living arrangements. All three use the same medium population projection.
Lone-person households are projected to increase
Lone-person households are projected to rise from 2.6 million in 2021 to between 3.4 million and 4.0 million by 2046. The ABS describes these as scenarios based on stated assumptions, not predictions.
Section 05 · Ageing in place
How ageing in place affects housing turnover and supply
Most older Australian households had remained in the same home for at least five years in 2019–20.
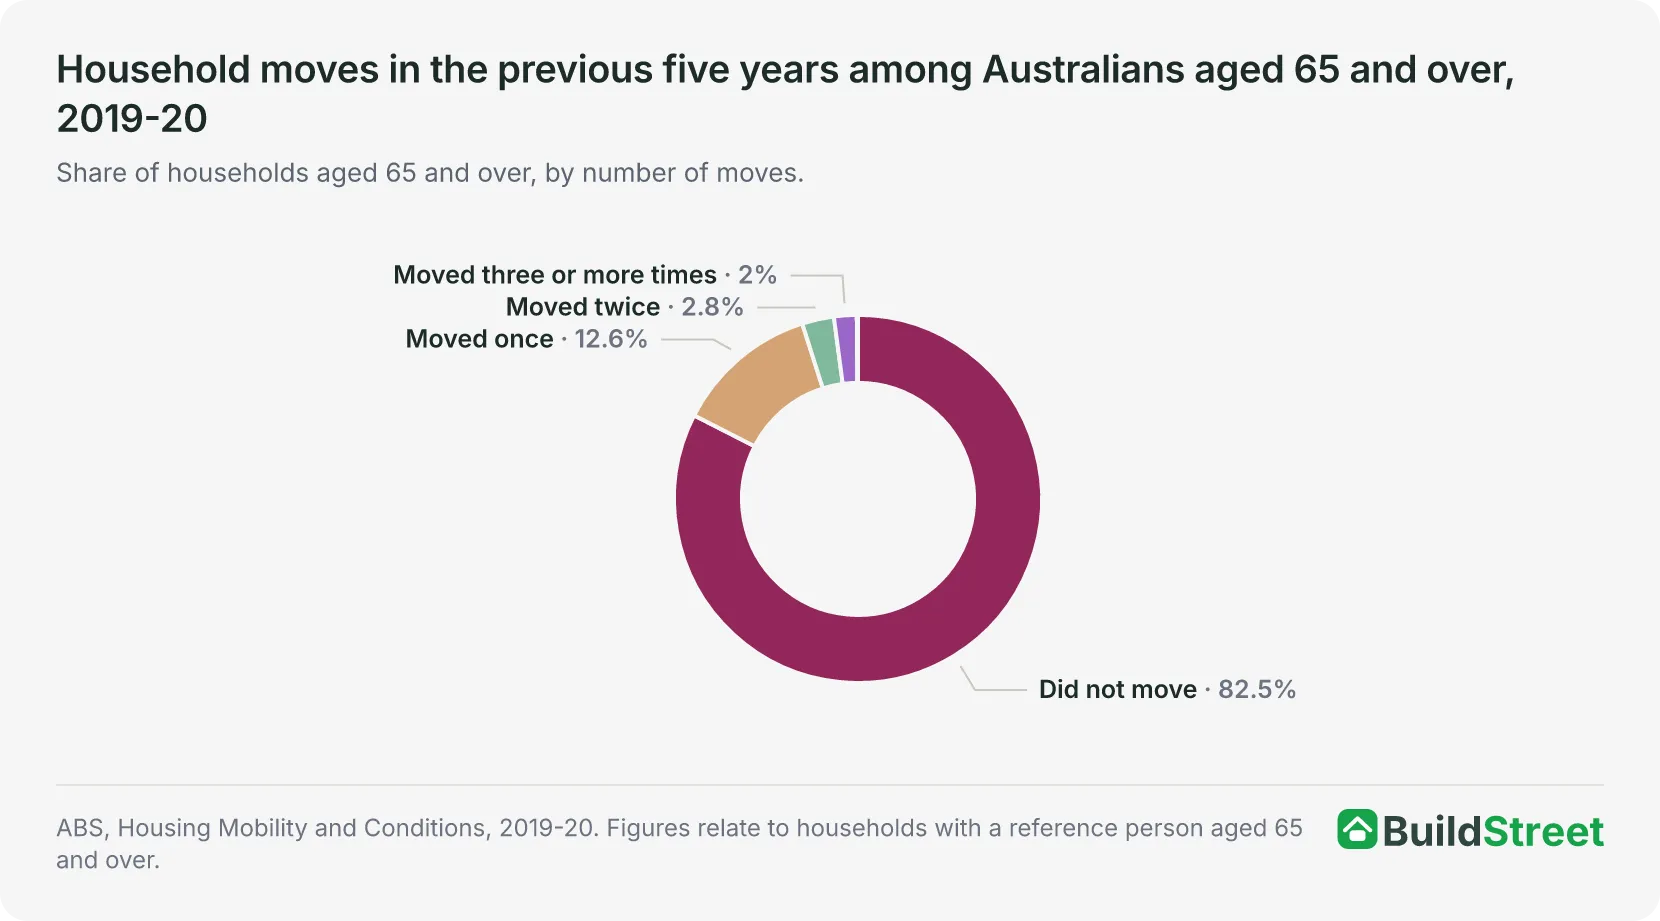
Among households with a reference person aged 65 and over, 82.5% had not moved in the previous five years. Separately, 82.3% had lived in their current dwelling for five years or more.
Among older households that had moved recently, 22.8% cited family reasons for their last move, the most common reason, followed closely by wanting a smaller home, at 22.2%. A further 8.3% cited a lifestyle change. Together, moving to a smaller home and lifestyle changes accounted for close to one-third of recent moves, rather than a majority.
Low mobility among older households can delay when larger homes reach the market, but it does not remove them from the housing stock, and a move by an older household does not automatically create net new supply elsewhere. The household still occupies a dwelling after moving. Whether the move releases a larger home for another household depends on the sequence of transactions that follows, which the ABS mobility data does not track.
Ageing in place may also generate building activity through home modifications rather than new construction, though this cannot yet be measured. The Support at Home programme replaced the Home Care Packages and Short-Term Restorative Care programmes from 1 November 2025. The Assistive Technology and Home Modifications scheme provides separate funding for approved modifications that address a participant's assessed needs. Official data on how this has affected modification volumes or housing turnover is not yet available, since the programme is still new.
Section 06 · Accessible housing
Demand for accessible and adaptable housing in Australia
More than half of Australians aged 65 and over had a disability in 2022. The rate reached 52.3%, up from 49.6% in 2018, representing 2.3 million people. The need for assistance also increased sharply with age.
Aged 65 to 74
28.2%
Needed assistance with at least one everyday activity
Aged 85 and over
77.2%
Needed assistance with at least one everyday activity
Source · Figures cover older people living in households, not those in cared accommodation. Source: ABS, Disability, Ageing and Carers, Australia: Summary of Findings, 2022.
The share needing assistance was almost three times as high among people aged 85 and over as among those aged 65 to 74. This shows that support needs were concentrated among the oldest age groups rather than spread evenly across the population aged 65 and over.
Most older Australians lived in households rather than care accommodation in 2022. The household category, which includes private dwellings and self-care retirement-village accommodation, accounted for 95.9% of older Australians.
Within that group, 39.8% of older people in households, around 1.7 million people, needed assistance with at least one everyday activity in 2022, most commonly:
- Property maintenance (27.3%)
- Health care (21.4%)
- Household chores (19.1%)
What the Livable Housing Design Standard requires
Six jurisdictions have adopted minimum accessibility provisions for new housing under NCC 2022, while New South Wales and Western Australia have not adopted the provisions as a statewide requirement. Building ministers agreed to the standard in April 2021, based on the Silver level of the Livable Housing Design Guidelines. It requires:
- A step-free access path and entrance
- Wider internal doors and corridors
- An accessible toilet
- A step-free shower
- Wall reinforcement for future grabrails
These provisions establish a minimum accessibility baseline for relevant new homes and allow for future adaptations. They do not guarantee that every dwelling will meet the needs of every person with disability.
| Jurisdiction | Status | Key date |
|---|---|---|
| Queensland | Implemented | Phase-in began 1 October 2023 |
| Victoria | Implemented | Mandatory for relevant new homes from 1 May 2024 |
| South Australia | Implemented | Commenced 1 October 2024 |
| Australian Capital Territory | Implemented | Commenced 15 January 2024 |
| Northern Territory | Implemented | Took effect 1 October 2023 |
| Tasmania | Implemented | Commenced 1 October 2024 |
| New South Wales | Not adopted statewide | Applies only where separately adopted |
| Western Australia | Voluntary only | Confirmed voluntary as at May 2026 |
Source · Australian Building Codes Board; NSW Parliament; WA Government Industry Bulletin 176; Tasmanian Government, Consumer, Building and Occupational Services; and state building authorities in Queensland, Victoria, South Australia, the ACT and the Northern Territory.
Section 07 · What gets built
How Australia's ageing population is changing new housing construction
Houses remained the largest category of new dwelling completions in 2024–25, accounting for 65.1% of the combined total for houses and other residential dwellings. This was only slightly below the 67.2% recorded in 2005–06.
Over that period, the house share moved considerably, falling to a low of 52.1% in 2016–17 before recovering. However, the national data does not show a sustained shift towards higher-density housing as the share of Australians aged 65 and over increased from 12.9% to 17.3%.
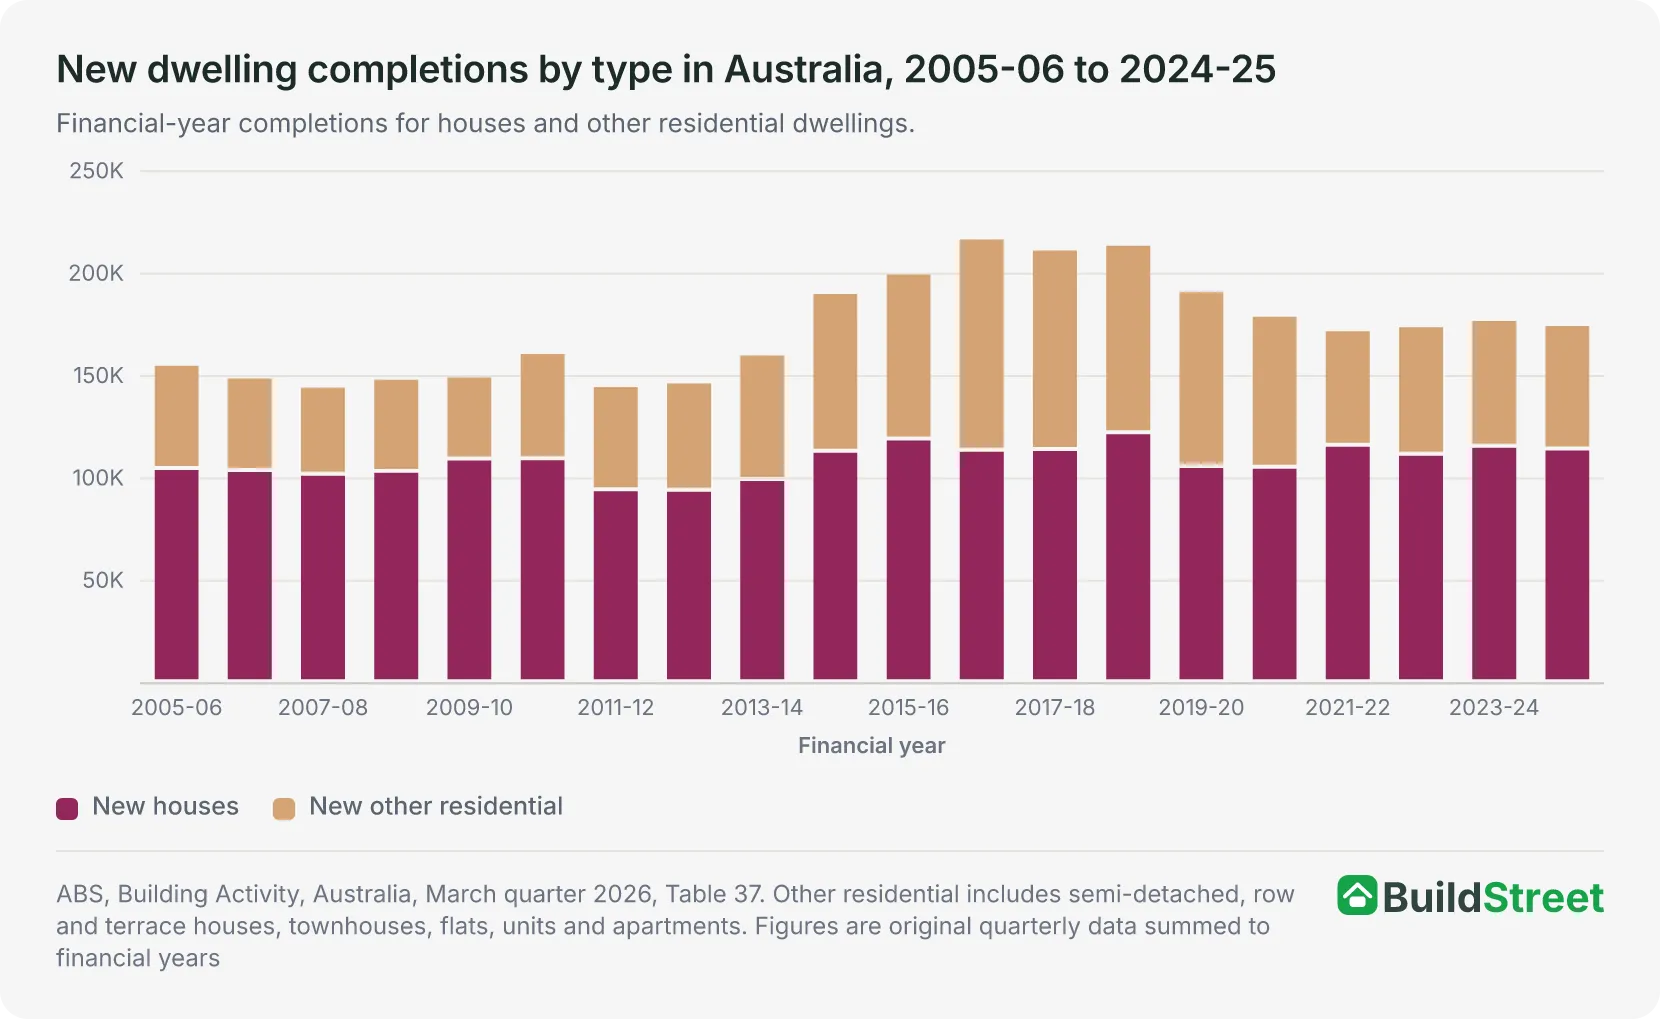
The comparison shows that the 65-plus share of the population increased steadily over the two decades, while the house share of completions rose and fell before ending close to where it began. The data does not show a clear national relationship between population ageing and the broad mix of houses and other residential dwellings.
This does not mean ageing has not affected particular dwelling types, designs or locations. It means that any such effect cannot be isolated in national completions data classified only by building structure.
The latest quarterly figures show the same underlying mix. In the March quarter of 2026, seasonally adjusted new private house completions were 26,201 and new private other-residential completions were 16,365, together 42,566 dwellings.
The ABS's broader total of 43,816 dwellings completed that quarter covers all sectors, including public sector building, not just these two private categories. Separately, ABS Building Approvals data show private house approvals in May 2026 at 10,537, against 6,034 for other dwelling types.
This data classifies dwellings by building structure, not by the age of their intended occupants. They therefore cannot show how many new dwellings were built specifically for older Australians.
Residential aged care is the clearest form of age-specific construction
Australia had 224,493 operational residential aged-care places allocated at 30 June 2025, up from around 201,000 in 2017, an increase of 12% over eight years. The occupancy rate was 89.9% in 2024–25.
Residential aged care is the only part of the housing system examined in this article that can be directly attributed to older residents because the accommodation is purpose-built for that population.
Small residential aged care services fell by 32% between 2017 and 2025, while large services rose by 37%, a more telling shift than the headline place count. The sector is consolidating into fewer, bigger facilities rather than expanding through many small ones, a pattern that construction data classified only as "other residential" would not reveal on its own.
The National Aged Care Design Principles and Guidelines, published in June 2024 describe the intended design of those facilities: accessible, dementia-friendly and home-like residential aged care, with access to outdoor space and connection to the surrounding community. It applies specifically to aged care design, not to the general housing stock covered elsewhere in this article.
2017
About 201,000
Operational residential aged care places
30 June 2025
224,493
Operational residential aged care places, up 12%
Source · Places are places allocated to approved providers, not necessarily all in use at a given time. Source: AIHW, GEN aged care data, Providers of aged care.
What the official data shows about housing construction and ageing
The official evidence supports four findings:
- Baseline accessibility is being built into relevant new housing through NCC 2022, in the six jurisdictions that have adopted it.
- More older Australians living in households are needing assistance with everyday activities as they age, a need the accessibility standards and aged-care changes above are responding to.
- Residential aged care is consolidating into fewer, larger facilities.
- The national mix of new houses versus other residential dwellings remains shaped by many factors that approvals and completions data cannot separate from ageing.
Overall, ageing is producing clearer measurable changes in housing design standards and residential aged-care construction than in the broad national mix of houses and higher-density dwellings.
References
- ABS, Regional population by age and sex, 2024 · Australian Bureau of Statistics
- ABS, National, state and territory population (latest release) · Australian Bureau of Statistics
- Centre for Population, 2025 Population Statement · population.gov.au
- Productivity Commission, Housing Decisions of Older Australians · pc.gov.au
- Australian Taxation Office, Downsizer super contributions data · ato.gov.au
- ABS, 2016 Census QuickStats, Australia · Australian Bureau of Statistics
- ABS 2021 Census of Population and Housing, All persons QuickStats · Australian Bureau of Statistics
- AIHW, Older Australians: housing and living arrangements · aihw.gov.au
- ABS, Housing Mobility and Conditions, 2019-20 · Australian Bureau of Statistics
- ABS, Disability, Ageing and Carers, Australia: Summary of Findings, 2022 · Australian Bureau of Statistics
- ABS: Household and Family Projections, 2021 to 2046 · Australian Bureau of Statistics
- Australian Building Codes Board, Livable Housing Design Standard · abcb.gov.au
- Office of Impact Analysis, Minimum accessibility standards for housing · oia.pmc.gov.au
- NSW Parliament, Livable Housing Australia guidelines (Q&A tracking) · parliament.nsw.gov.au
- Western Australian Government, Industry Bulletin 176 · wa.gov.au
- Tasmanian Government CBOS, Implementation of Stage 2 of the Livable Housing Design Standard · cbos.tas.gov.au
- Department of Health, Disability and Ageing, Support at Home · health.gov.au
- Department of Health, Disability and Ageing, National Aged Care Design Principles and Guidelines · health.gov.au
- AIHW, GEN aged care data, Providers of aged care · gen-agedcaredata.gov.au
- ABS, Building Activity, Australia (latest release, Cat. 8752.0) · Australian Bureau of Statistics
- ABS Building Approvals, Australia (latest release, Cat. 8731.0) · Australian Bureau of Statistics
- Queensland Government, Livable Housing Design Standard · housing.qld.gov.au
- Building and Plumbing Commission Victoria, Livable housing design requirements · bpc.vic.gov.au
- PlanSA — NCC 2022 modern homes provisions · plan.sa.gov.au
- Northern Territory Government, Livable housing design requirements · nt.gov.au
- ACT Government, NCC 2022 ACT Appendix to the Building Code of Australia · planning.act.gov.au
