

Published 23 June 2026 · Updated 29 Sept 2026
Australia approved 30,864 knockdown rebuild (KDR) dwellings in 2024–25, down 29% from the 2021–22 peak of 43,6381. New South Wales and Victoria accounted for nearly seven in ten KDR approvals nationally, though both states recorded year-on-year declines. The average approved value of a KDR detached house reached more than $1 million in June 2025, around 138% above the average approved value of a standard new detached house. More than half of all KDR projects replace one home with one home, meaning most knock-down activity does not add to net housing supply.
 How many homes are built in Australia each year?Two distinct cycles have shaped Australia's housing output since 2010:
 The states with the fastest and slowest home build times in AustraliaBuilding a new home in Australia involves two key waiting periods: approval to commencement (the time from receiving planning approval to breaking ground), and commencement to completion (the time fro…
Section 01 · THE NATIONAL PICTURE
How many knockdown rebuilds happen in Australia each year?
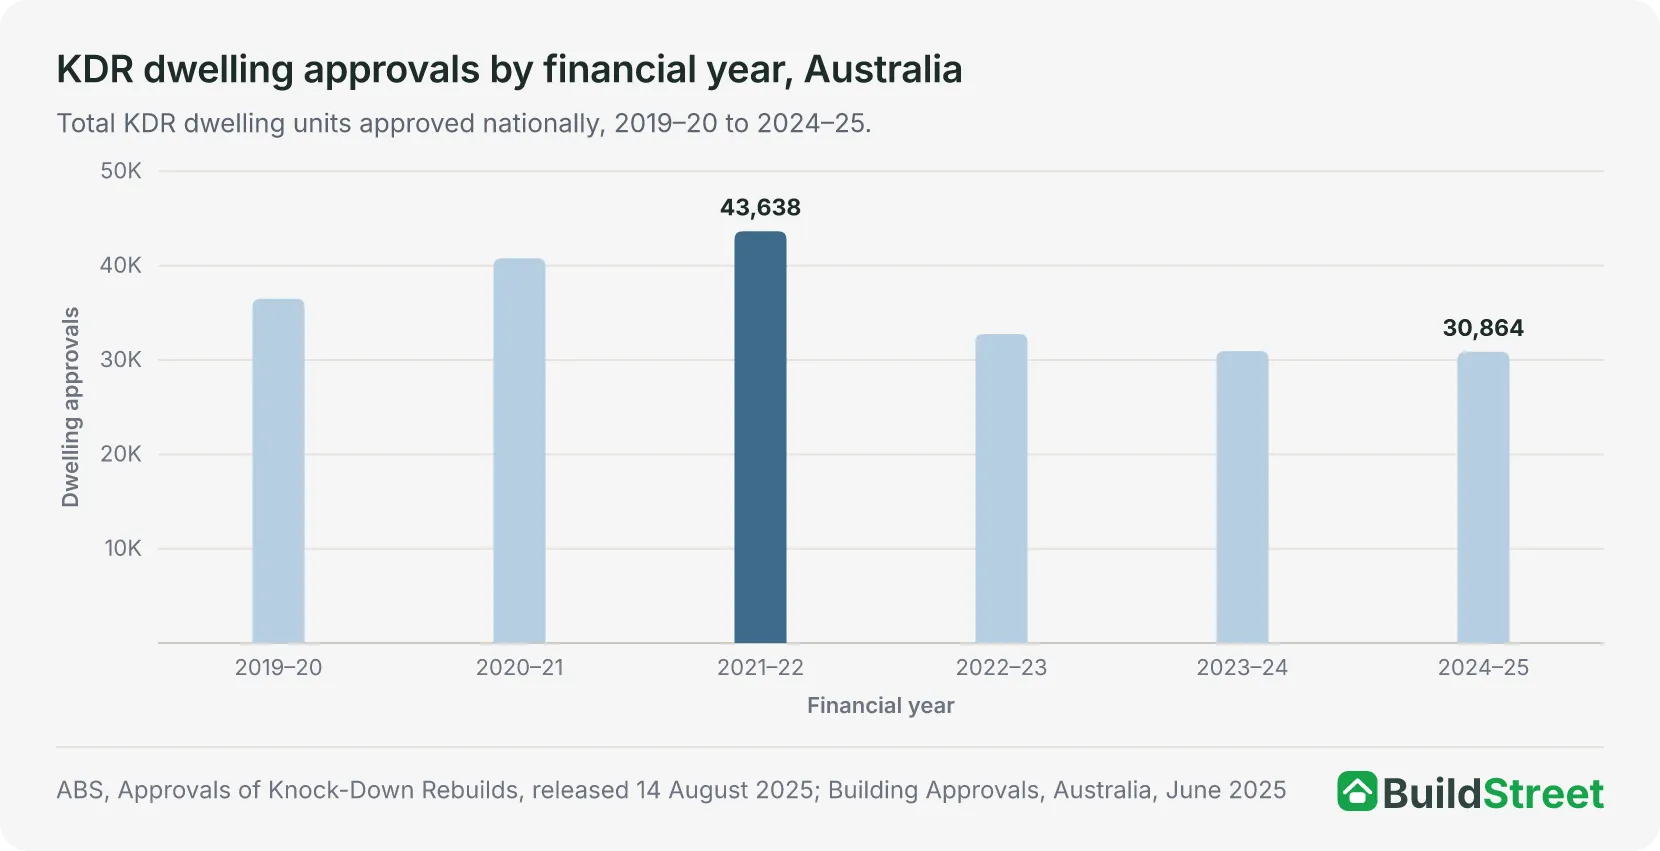
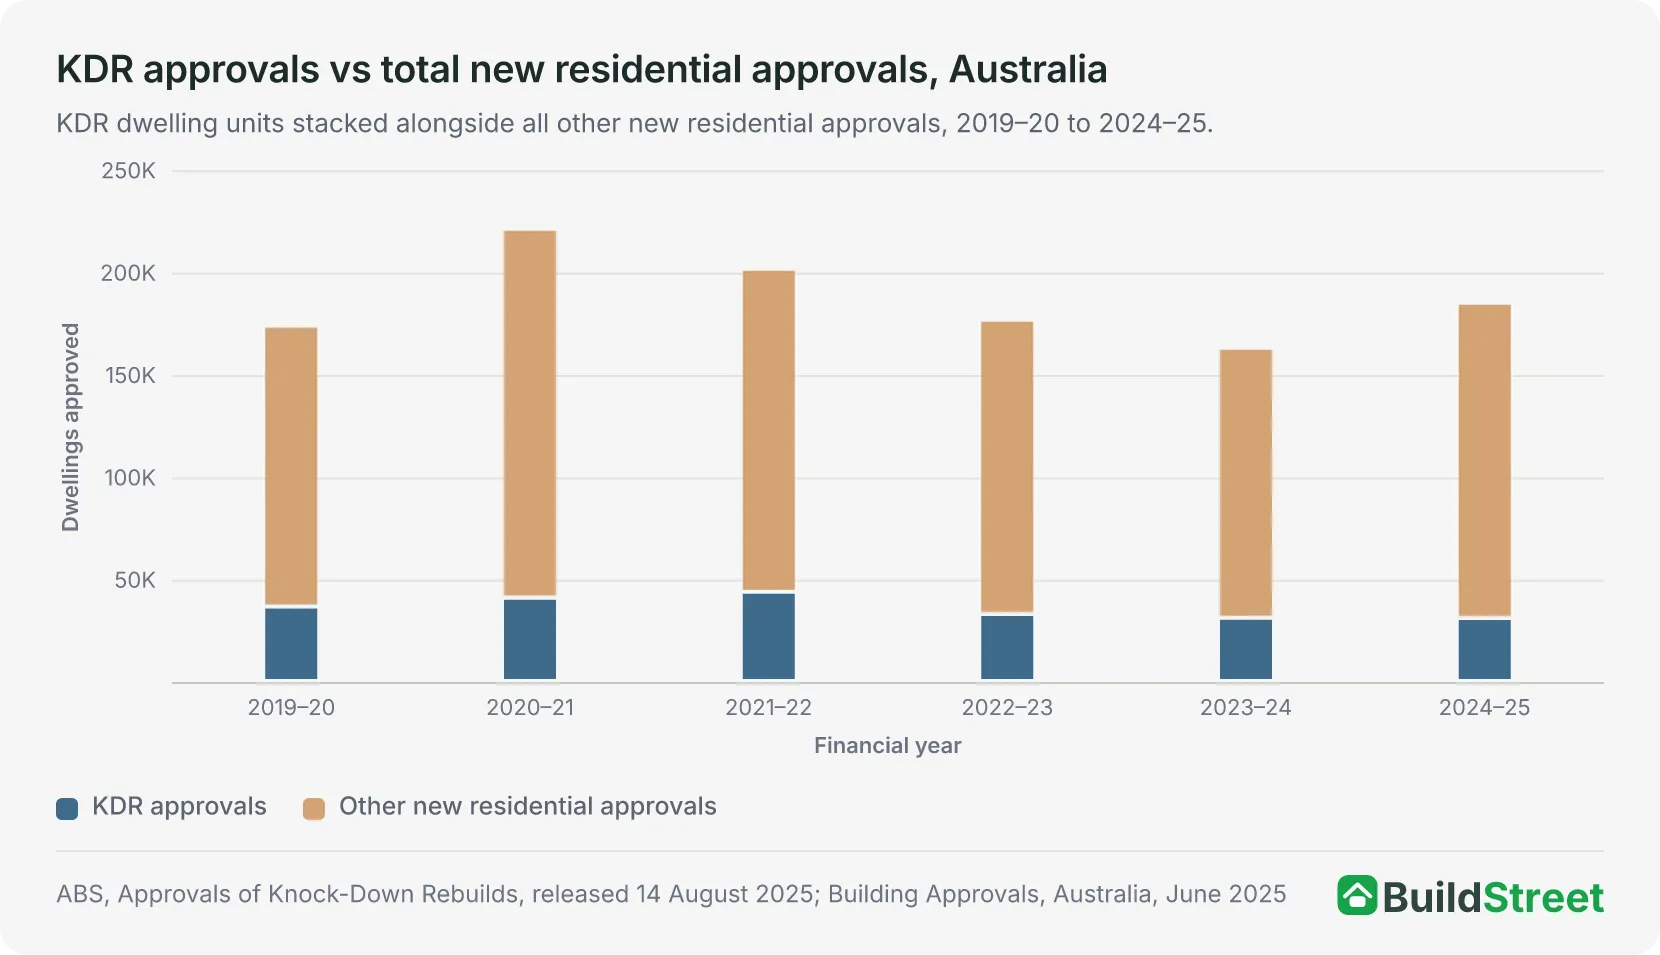
Australia approved 30,864 KDR dwelling units in 2024–25, down 29% from the 2021–22 peak of 43,638. That is roughly one in six of all new residential dwelling approvals nationally, with KDR projects recording their lowest share of total approvals at 16.7%.
KDR approvals moved through three clear phases between 2019–20 and 2024–25:
- 2019–20 to 2021–22: Approvals rose from 36,492 to 43,6381, during a period that coincided with the federal HomeBuilder grant and low interest rates.
- 2022–23: Approvals fell 25% in a single year to 32,755, as interest rates rose and construction costs increased.
- 2023–24 to 2024–25: Activity levelled off, with the 2024–25 total of 30,864 sitting just 86 below the prior year.
Total residential approvals rose to 184,834 in 2024–251, with increases concentrated in apartments and greenfield housing. KDR approvals did not follow the same pattern, so KDR's share of all new residential approvals fell to its lowest level in the ABS data series.
These figures count approved dwelling units, not individual knock-down events. A single site that produces two new homes counts as two approved dwellings, but only one demolition.
KDR share at peak (2021–22)
- 21.7%
More than one in five new dwelling approvals were knockdown rebuilds in 2021–22
KDR share in 2024–25
- 16.7%
The lowest share in the data series. Apartment and greenfield approvals increased over the same period, while KDR approvals remained below their 2021–22 peak.
Section 02 · WHERE IT HAPPENS
Which states have the most knockdown rebuilds?
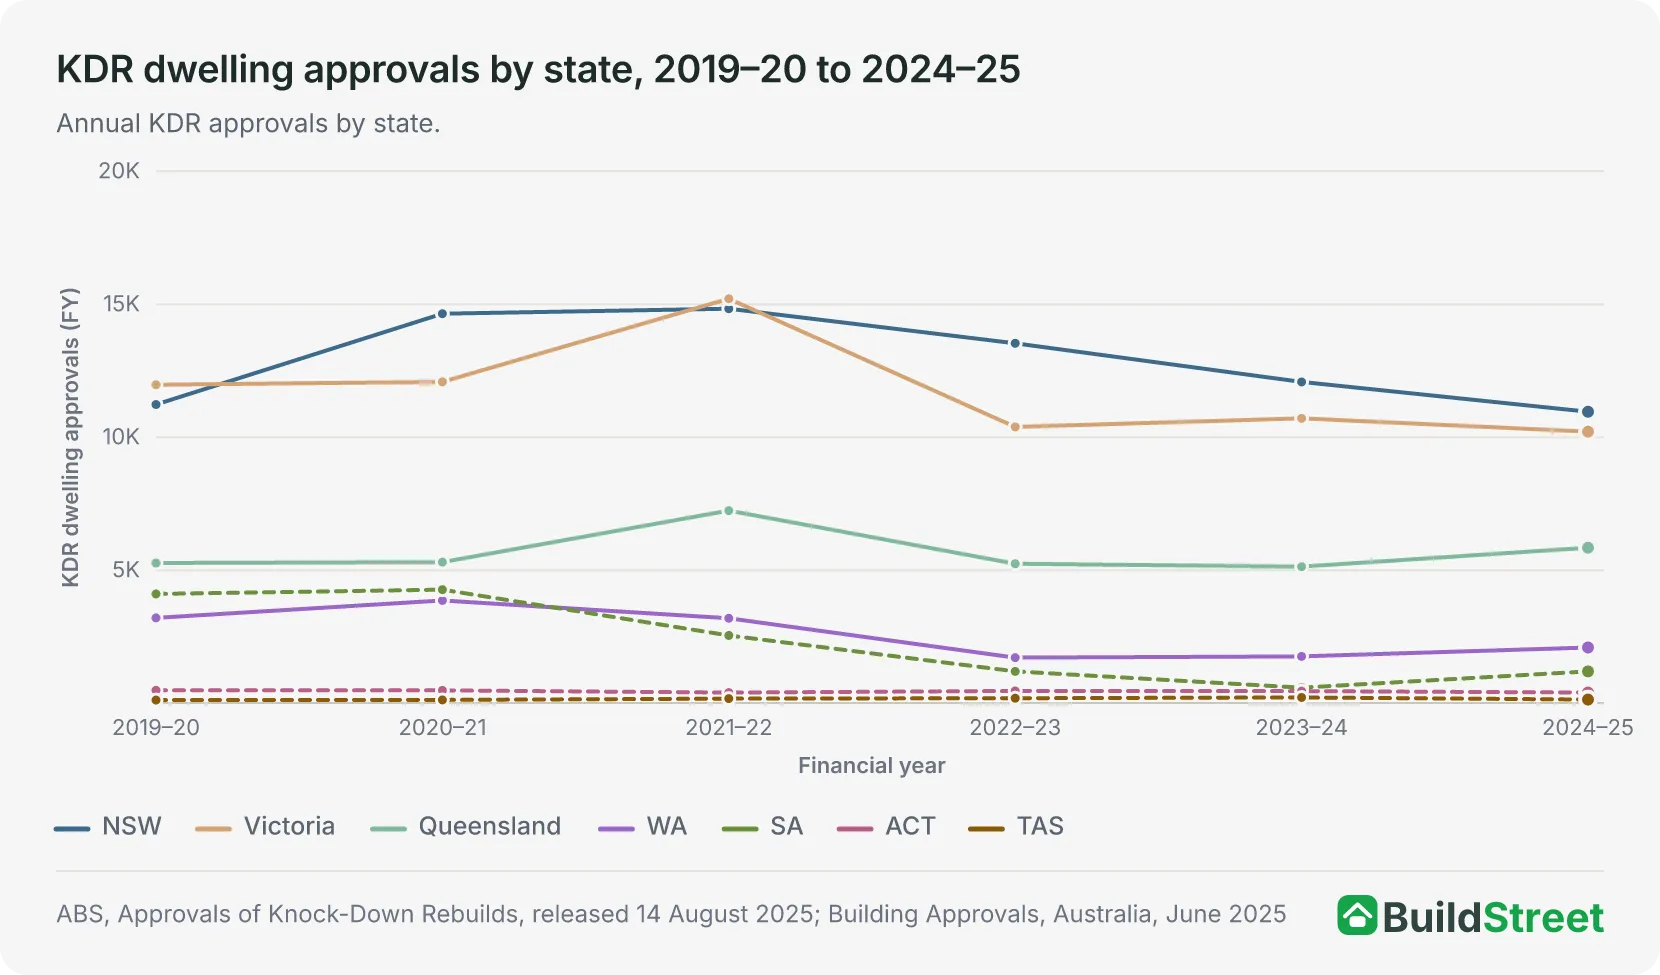
New South Wales (10,959 approvals) and Victoria (10,208) together accounted for 68.6% of all KDR approvals in 2024–25, a pattern that has held every year in the data series. Both states recorded fewer approvals than in 2023–24, with NSW down 9.3% and Victoria down 4.7%, though they remain the two largest KDR markets nationally.
Both states have large established suburbs, ageing housing stock, strong land values, and planning frameworks associated with infill development. These conditions are commonly linked with higher knockdown rebuild activity, although the ABS data does not isolate which factors explain approvals in each state.
Queensland, Western Australia and South Australia all grew in 2024–25. Queensland rose 13.9% to 5,844 approvals, although a single unusually high December 2024 reading of 1,466 (against 273 to 529 in every other month) accounts for all of that rise. Western Australia rose 19% to 2,090. Queensland and Western Australia both grew from smaller bases than NSW and Victoria, which remained the two largest markets.
South Australia's reported figure of 1,193, more than double the 581 recorded in 2023–24, should be treated with caution. Monthly approvals there ran above 90 in nine of the 12 months, peaking at 173 in April 2025, compared with 19 to 85 a month in 2023–24. Since 2021, most South Australian demolitions no longer need an approval, so the ABS captures only part of the state's KDR activity1. The ACT (398) and Tasmania (134) remained low-volume markets.
| State/territory | 2023–24 | 2024–25 | Change | Share (2024–25) |
|---|---|---|---|---|
| New South Wales | 12,080 | 10,959 | −9.3% | 35.5% |
| Victoria | 10,710 | 10,208 | −4.7% | 33.1% |
| Queensland | 5,132 | 5,844 | +13.9% | 18.9% |
| Western Australia | 1,757 | 2,090 | +19.0% | 6.8% |
| South Australia | 581 | 1,193 | +105% | 3.9% |
| Australian Capital Territory | 451 | 398 | −11.8% | 1.3% |
| Tasmania | 213 | 134 | −37.1% | 0.4% |
| Northern Territory | 26 | 38 | +46.2% | 0.1% |
| Australia | 30,950 | 30,864 | −0.3% | 100% |
Source · ABS, Approvals of Knock-Down Rebuilds, released 14 August 2025; Building Approvals, Australia, June 2025. Queensland's 2024–25 figure includes an unusually high December 2024 monthly reading (1,466). South Australia's figures should be interpreted with caution: most demolitions there no longer need an approval, so the ABS captures only part of the state's KDR activity.
Section 03 · WHAT GETS BUILT
Do knockdown rebuilds add new housing?
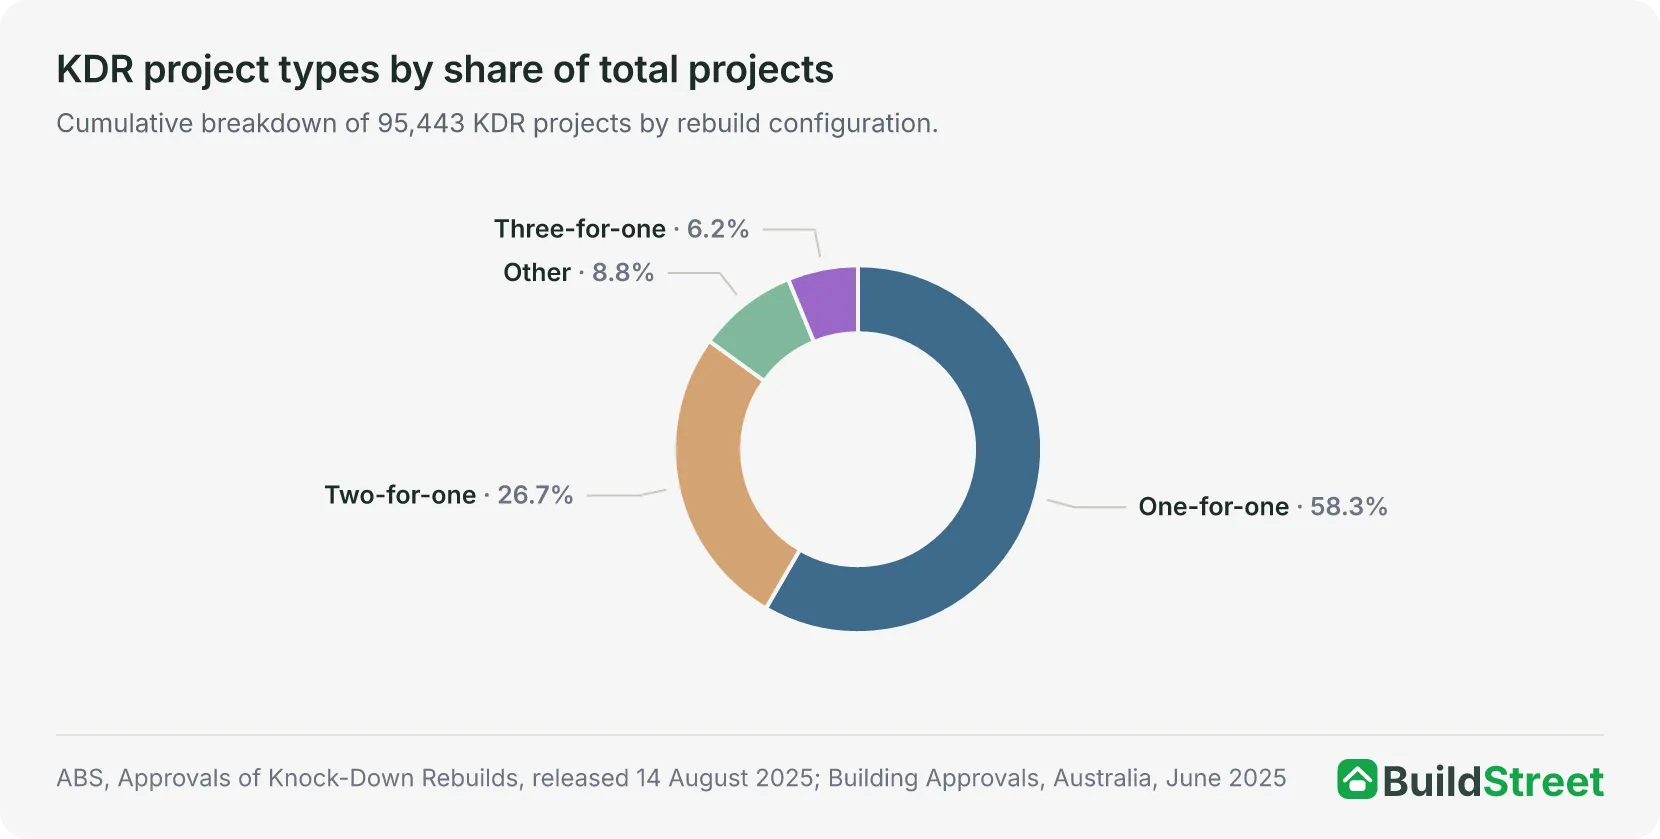
Nationally, 58.4% of KDR projects are one-for-one replacements, meaning one home is knocked down and one new home takes its place1. These projects can improve housing quality and energy efficiency, but they do not add to the overall housing supply.
The remaining 41.6% of projects produce two or more dwellings per site and are the only KDR activity that contributes net new homes. Two-for-one rebuilds account for 26.7% of all projects; three-for-one for a further 6.2%.
Apartment-type projects make up a small share of all KDR work by number, but they average 9.5 new dwellings per knock-down, compared with 1.3 for a house-for-house replacement1. Across all project types, the overall average is 2.1 dwellings per knock-down event, which indicates an approximate 14,700 individual knock-down events behind the 30,864 dwelling units approved in 2024–25.
| Project type | Share of projects | Projects |
|---|---|---|
| One-for-one | 58.4% | 55,692 |
| Two-for-one | 26.7% | 25,480 |
| Three-for-one | 6.2% | 5,904 |
| Other types | 8.8% | 8,367 |
Source · ABS, Approvals of Knock-Down Rebuilds, released 14 August 2025; Building Approvals, Australia, June 2025. Project type counts are cumulative across the full data period.
One-for-one knockdown rebuild rates by state
The share of KDR projects that result in a one-for-one replacement varies considerably by state, ranging from 49.9% in South Australia to 74.9% in the ACT:
- ACT (74.9%) and Queensland (74.4%): most KDR activity in both results in a like-for-like replacement, adding no net homes to the local stock.
- NSW (54.8%) and Victoria (57.0%) both sit close to the 58.4% national average1.
- South Australia (49.9%) has the lowest one-for-one rate of any state or territory, meaning most projects there produce more than one dwelling per site.
The variation may reflect differences in local planning rules, housing stock and the types of sites where KDR activity is concentrated. The ABS data shows the pattern, but does not isolate the cause of the state-level differences.
| State/territory | Total KDR projects | One-for-one projects | One-for-one share |
|---|---|---|---|
| New South Wales | 33,343 | 18,286 | 54.8% |
| Victoria | 33,880 | 19,311 | 57.0% |
| Queensland | 11,367 | 8,457 | 74.4% |
| Western Australia | 7,723 | 4,583 | 59.3% |
| South Australia | 6,995 | 3,492 | 49.9% |
| Australian Capital Territory | 1,647 | 1,233 | 74.9% |
| Tasmania | 389 | 277 | 71.2% |
| Northern Territory | 99 | 53 | 53.5% |
| Australia | 95,443 | 55,692 | 58.4% |
Source · ABS, Approvals of Knock-Down Rebuilds, released 14 August 2025; Building Approvals, Australia, June 2025. Figures are cumulative across the full ABS data period.
Section 04 · WHAT IT COSTS
How much are knockdown rebuild approvals worth compared with standard new builds?
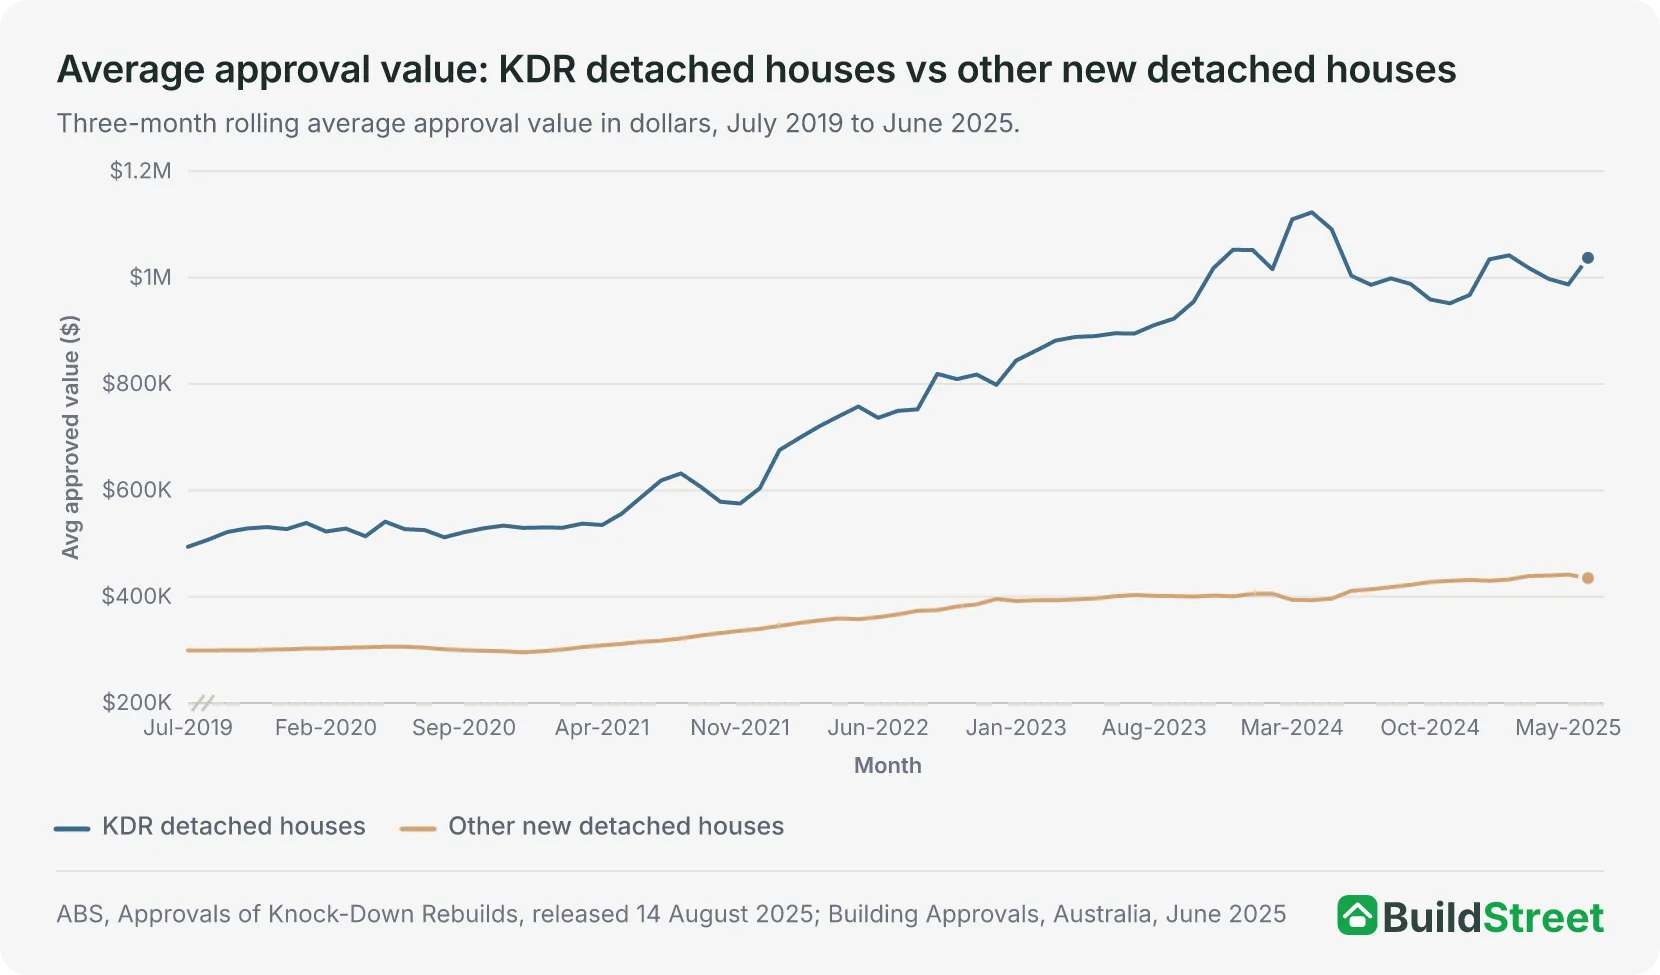
The average approved value of a KDR detached house reached $1,037,336 in June 2025, compared with $434,960 for a standard new detached home1. That is a premium of 138%, up from around 65% in July 2019. KDR approved values have risen 110% since 2019, more than twice the 45% increase recorded for standard new detached houses over the same period.
This comparison is based on approved building values, not final construction costs. KDR projects tend to be in established suburbs where land values are higher, and the homes are typically larger and better specified than volume-built homes on greenfield sites. The data does not adjust for location, size, or quality, so the gap reflects both where KDR happens and what gets built, not construction costs alone.
Section 05 · DEMOLITION DATA
How many homes are approved for demolition in Australia each year?
Nationally, 20,273 house demolitions were approved in 2025–26, up 6.2% from 19,087 in 2024–25. NSW (7,770) and Victoria (7,239) together accounted for 74.0% of that total, somewhat above their combined 68.6% share of KDR approvals in 2024–25. Queensland accounted for a further 3,220 approved house demolitions, or 15.9% of the national total, while South Australia (65) and Tasmania (83) recorded small volumes.
Demolition approvals cover houses approved for demolition, whether or not a rebuild follows. Some sites may stay vacant, change ownership, or proceed under a separate approval pathway. These figures are drawn from a different dataset to the KDR approval data and use a different reporting frequency, so they cannot be directly compared. They should be treated as a related but separate indicator of demolition activity.
| State/territory | 2024–25 | House demolitions approved (2025–26) | Share of national total (2025–26) |
|---|---|---|---|
| New South Wales | 7,128 | 7,770 | 38.3% |
| Victoria | 7,032 | 7,239 | 35.7% |
| Queensland | 2,968 | 3,220 | 15.9% |
| Western Australia | 1,495 | 1,604 | 7.9% |
| Australian Capital Territory | 270 | 254 | 1.3% |
| Tasmania | 89 | 83 | 0.4% |
| South Australia | 67 | 65 | 0.3% |
| Northern Territory | 38 | 38 | 0.2% |
| Australia | 19,087 | 20,273 | 100% |
Source · ABS, Building Approvals, Australia, June 2026, Table 87, demolition approvals for houses, original series, quarters ending September 2024 to June 2026 (2024–25 figures as revised). Figures cover house demolitions only and exclude units, townhouses and other non-house dwellings. Not all demolitions result in a KDR application.
Section 06 · DATA EXPLORER
Monthly knockdown rebuild approvals in Australia
Monthly KDR approvals nationally ranged from a low of 1,502 in January 2025 to a high of 4,448 in March 2021. The chart below shows how approvals trended month by month from July 2019 to June 2025.
- Total KDR (FY)
- 36,492
- NSW
- 11,230
- Victoria
- 11,974
- Share of national
- 63.6%
- NSW + VIC combined
- Total KDR (FY)
- 40,784
- NSW
- 14,645
- Victoria
- 12,082
- Share of national
- 65.5%
- NSW + VIC combined
- Total KDR (FY)
- 43,638
- NSW
- 14,833
- Victoria
- 15,208
- Share of national
- 68.8%
- NSW + VIC combined
- Total KDR (FY)
- 32,755
- NSW
- 13,532
- Victoria
- 10,388
- Share of national
- 73%
- NSW + VIC combined
- Total KDR (FY)
- 30,950
- NSW
- 12,080
- Victoria
- 10,710
- Share of national
- 73.6%
- NSW + VIC combined
- Total KDR (FY)
- 30,864
- NSW
- 10,959
- Victoria
- 10,208
- Share of national
- 68.6%
- NSW + VIC combined
References
- ABS, Approvals of knock-down rebuilds, released 14 August 2025 · Australian Bureau of Statistics ↑ b c d e f g h
- ABS Building Approvals, Australia (latest release, Cat. 8731.0) · Australian Bureau of Statistics
