

Published 11 May 2026 · Updated 22 Sept 2026
House construction prices in Australia surged 40.8% between September 2020 and June 2024, according to ABS producer price data for house construction. That increase has permanently reset the cost baseline. By June 2026 the index stood 49.7% above its September 2020 level and was rising at 5.9% a year, the fastest annual pace since June 2023. On the consumer side, ABS CPI new dwelling prices were up 5.7% in the year to July 2026.
The double-digit increases of 2021 and 2022 have since eased, but they've stacked onto a cost base that was already at a historic high. Prices are unlikely to return to 2019 levels. For anyone building now, the real question is knowing which pressures have genuinely eased, which ones are here to stay, and where the next shocks are likely to come from.
 Australian building material costs: how much prices have increased since 2020Building material costs are still rising, but much more slowly than during the pandemic cost surge.
 How many homes are built in Australia each year?Two distinct cycles have shaped Australia's housing output since 2010:
Why construction costs surged after 2020
The HomeBuilder stimulus launched in 2020 at exactly the wrong moment. It pushed a flood of consumer spending into the residential sector just as global supply chains were breaking down. Structural timber doubled in price within months. Steel followed. Freight rates hit records. Builders who had signed fixed-price contracts before the surge watched their margins disappear entirely. Construction became the top sector for corporate insolvencies, a position it hasn't given up since 2022.
Copper prices are rising and adding pressure
With timber finally settling down, the next major input shock for the construction industry is copper. Prices reached around US$14,800 per tonne in September 2026, a rise of roughly 47% year-on-year1. This isn't a temporary supply chain problem. It's structural demand driven by global electrification, renewable energy grids and AI data centres. Industry forecasters are expecting at least two more price rises in electrical cabling before the end of 2026.
Section 01 · The Cost Reset
Why have construction costs in Australia risen so sharply after 2020?
Australia's homebuilding cost base did not just rise after 2020. It reset. What had been a relatively steady pattern of price growth gave way to a sharp and sustained escalation, driven by stimulus-fuelled demand, supply chain disruption, labour shortages and higher risk pricing across the sector. The ABS Producer Price Index for house construction tracks the prices building businesses receive for their work, capturing not only materials but also labour, contractor margins and risk pricing. Between 2006 and 2019, the index rose at a relatively steady pace of about 2.7% a year. From 2020, that stability broke down. Six consecutive quarters of double-digit annual growth between December 2021 and March 2023, peaking at 20.5% in September 2022, pushed costs higher at an extraordinary pace. By June 2026, the index had reached 182.6, a 47.0% increase from 124.2 in December 2020, and it was rising at 5.9% a year again, the fastest annual pace since June 2023.
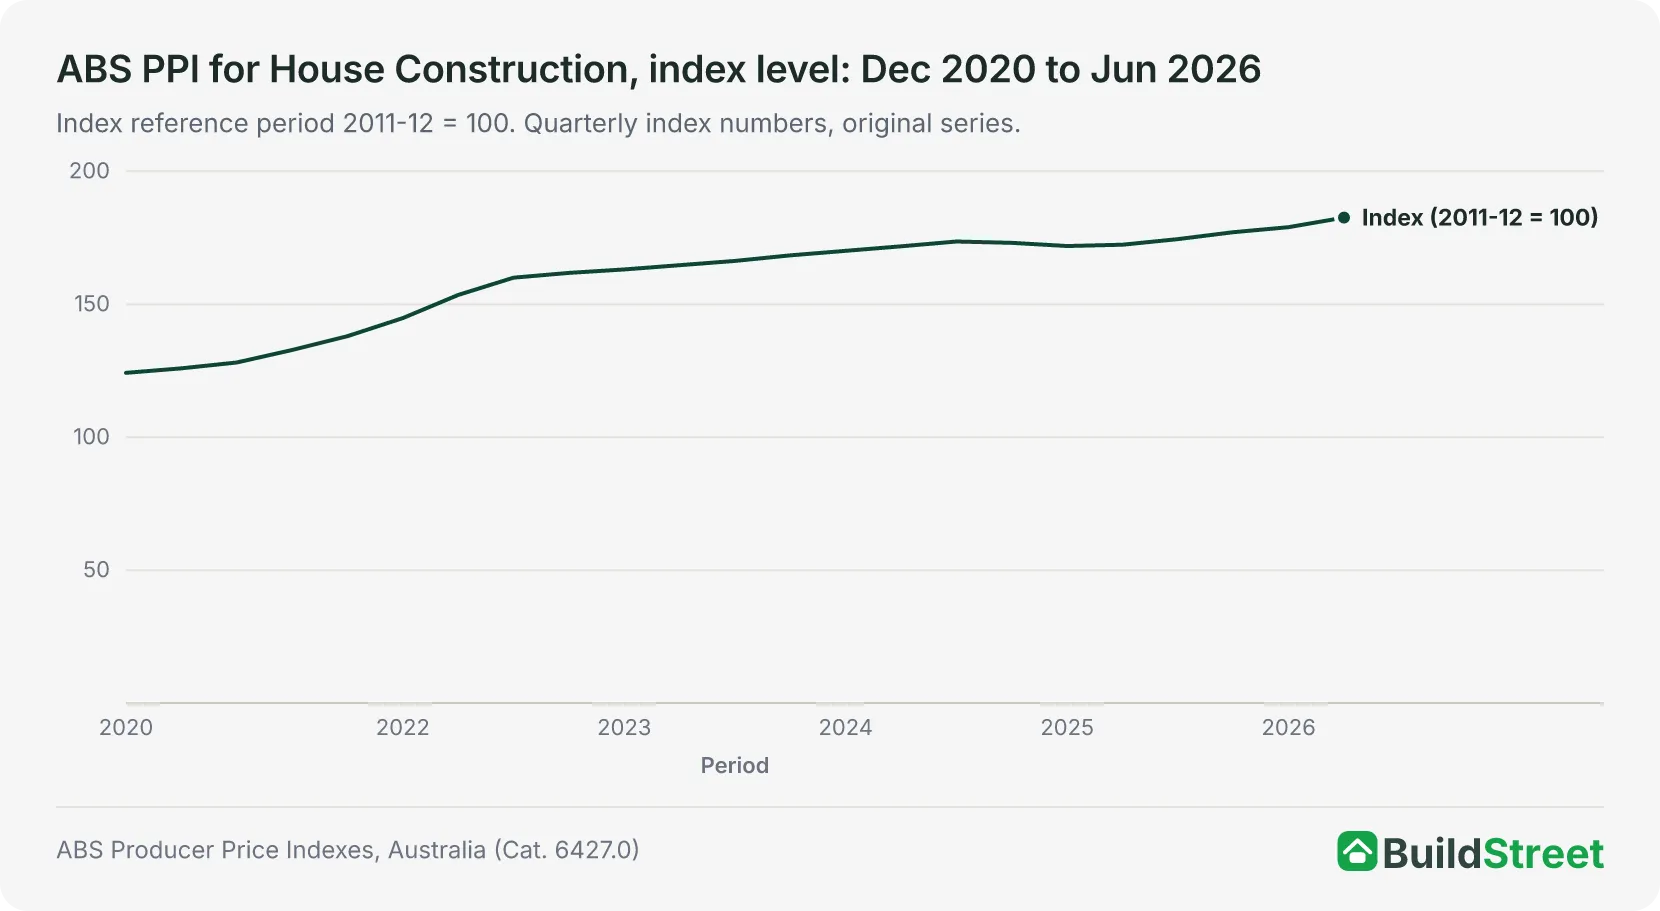
Dec 2020
124.2 · +2.9%
Pandemic onset. Temporary deflation fears gave way to massive fiscal stimulus. The HomeBuilder program launched, flooding demand into the sector.
Dec 2021
138.0 · +11.1%
Early supply shock. Global shipping constraints and initial material shortages started pushing input costs well above pre-pandemic norms.
Sep 2022
Peak160.0 · +20.5%
Hyper-escalation. Timber and steel prices hit records. Labour mobility collapsed as trades were locked into backlogs across multiple states simultaneously.
Dec 2022
161.8 · +17.2%
Persistent inflation. Despite some supply chain easing, elevated costs entrenched themselves across the industry. Builder insolvencies began accelerating.
Jun 2023
164.7 · +7.3%
Disinflation phase. The growth rate began slowing, but was still compounding onto a base that had already surged more than 20% in two years.
Dec 2023
168.4 · +4.1%
Stabilisation. Builders absorbed costs through renegotiation. Domestic labour shortages replaced material price shocks as the primary pressure.
Jun 2024
171.8 · +4.3%
Secondary rebound. Public infrastructure projects began competing heavily with residential builders for concrete, steel and skilled labour.
Dec 2025
177.1 · +2.3%
Post-peak plateau. Growth slowed, but from a cost base that is now 42.6% above where it was in late 2020. The new normal is structurally more expensive.
Jun 2026
182.6 · +5.9%
Re-acceleration. House construction prices rose 2.0% in the June quarter, the largest increase since September 2022, as higher fuel and freight costs pushed annual growth to its fastest pace since mid-2023.
Source · ABS Producer Price Indexes, Australia, June 2026 (Cat. 6427.0), Table 17, house construction (3011); ABS Consumer Price Index, Australia (July 2026).
Section 02 · Sector Spend
The construction spend surge behind slower housing delivery
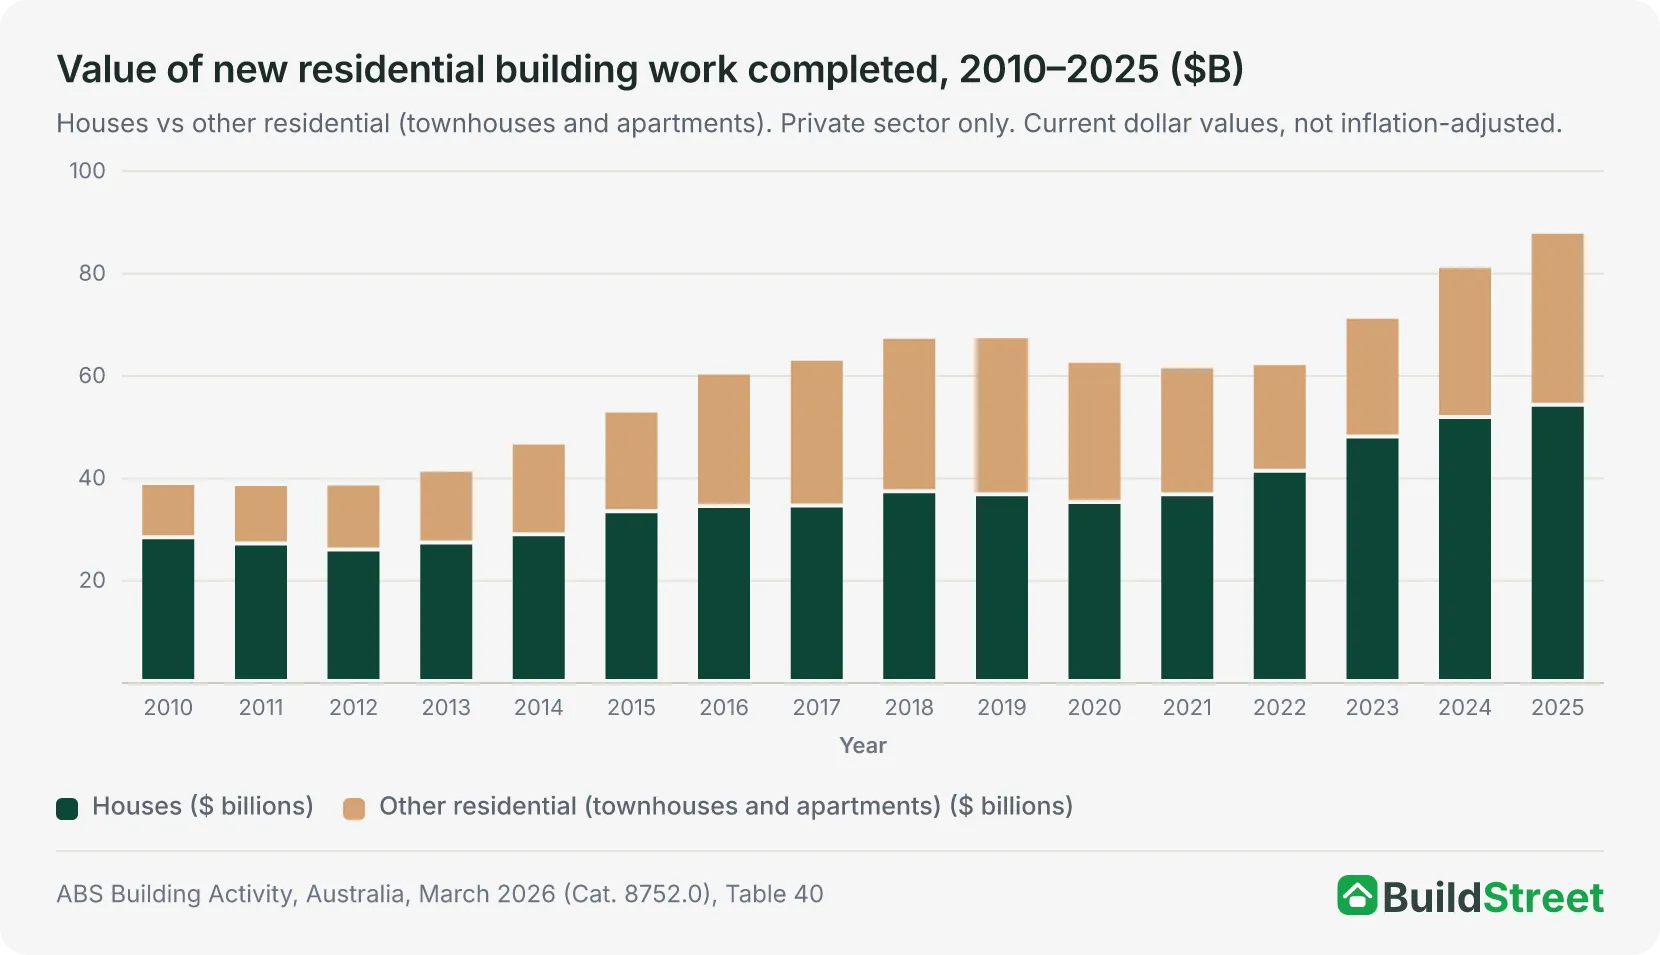
Australia spent more on residential construction in 2025 than at any point in recent years, but the increase says more about cost inflation than a building boom. The total nominal value of new residential construction completed reached $87.8 billion, up 40.3% from $62.6 billion in 2020. While that points to strong growth on paper, the underlying mix shows how much of the increase has come from higher costs rather than more homes being delivered. House construction remained the dominant segment at $54.0 billion, up 54% from 2020, despite detached housing completions shifting only marginally over the period. That makes the $19.0 billion increase overwhelmingly a cost story. Other residential building (townhouses and apartments together) is in a different cycle. Its completed value fell to a $21.0 billion trough in 2022 as the apartment pipeline emptied, and has since climbed to $33.8 billion in 2025, up 23% on 2020 and finally above its 2019 peak of $30.9 billion.
Section 03 · National Averages
What it actually costs to build: national averages over time
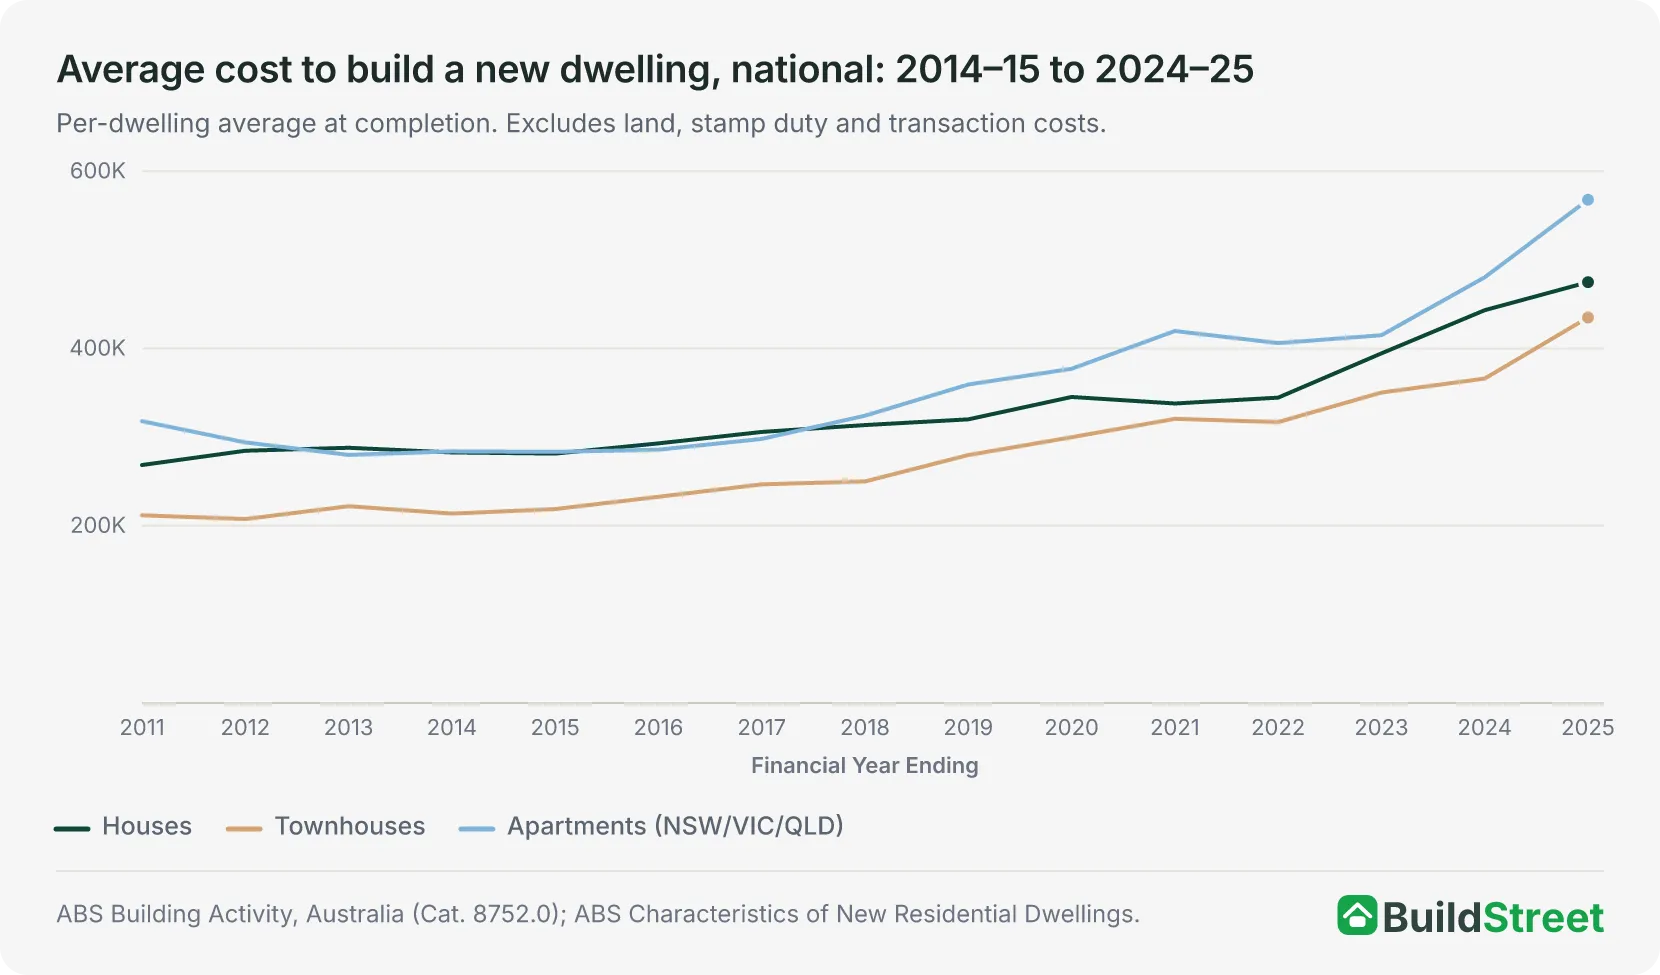
The nominal dollar value of construction tells one story, and the average cost of building an individual home tells another. Since 2020–21, the national average cost to build a new house has risen from $338,051 to $474,939 in 2024–25. Townhouses and apartments have followed a similar pattern. Crucially, average floor areas have not fallen enough to offset those cost increases. The average new house is slightly larger than it was in 2020–21, meaning Australians are paying more per square metre for roughly the same amount of space.
Townhouse · National
$474,939
- Avg floor area (2024–25)
241.5 m²
- Cost per m²
~$1,967/m²
- Floor area in 2020–21
230 m²
- Cost per m² in 2020–21
~$1,470/m²
- Cost per m² change
+$497/m² (+34%)
Townhouse · National
$435,089
- Avg floor area (2024–25)
174.5 m²
- Cost per m²
~$1,967/m²
- Floor area in 2020–21
166.4 m²
- Cost per m² in 2020–21
~$1,928/m²
- Cost per m² change
+$565/m² (+29%)
Apartment · NSW/VIC/QLD
$567,947
- Avg floor area (2024–25)
174.5 m²
- Cost per m²
~$4,533/m²
- Floor area in 2020–21
116.1 m²
- Cost per m² in 2020–21
~$3,616/m²
- Cost per m² change
+$917/m² (+25%)
Cost per m² is derived by dividing average build cost by average floor area for each financial year. Apartment floor area includes common areas and hallways divided across all dwellings in a building, which tends to inflate the per-m² figure relative to houses and townhouses.
Section 04 · City Outlook
Not all cities are equal: Brisbane overheats while Sydney gets a brief breather
Construction cost pressures are no longer moving in lockstep across Australia. A clear two-speed market is emerging, with Brisbane and parts of Queensland accelerating sharply while Sydney and Melbourne experience a more moderate pace of escalation. Tender Price Index data, which captures what contractors actually charge for a job, including margins and risk premiums as well as material costs, points to a widening gap between the major east coast markets. At the heart of that divergence is infrastructure demand. In Queensland, large-scale projects are drawing trades and materials away from residential work, intensifying cost pressures in the housing sector.
| City | 2025 TPI growth | 2026 TPI forecast | What's driving it |
|---|---|---|---|
| Brisbane | 5.0% | 7.0–7.5% | 2032 Olympics prep, $3.8B stadium and statewide energy rollout absorbing all available trades capacity. |
| Gold Coast | 4.5% | 6.0% | Olympics pipeline rapidly consuming skilled tradespeople across South East Queensland. |
| Townsville | 6.0% | 6.0% | Sustained defence and infrastructure demand creating extreme capacity constraint with no relief in sight. |
| Perth | 5.4% | 5.3–5.5% | Nation-leading population growth and Australia's most active detached housing market keeping pressure steady. |
| Adelaide | 3.5% | 5.1% | Major healthcare and defence projects entering peak construction, draining residential labour supply. |
| Darwin | 5.0% | 5.2% | Limited Tier 1 contractor competition and sustained federal defence infrastructure spending. |
| Canberra | 3.75% | 4.5% | Hospital and security precinct early works pulling trades away from the residential sector. |
| Melbourne | 4.0% | 4.0% | High baseline with builder insolvencies reducing some demand, but thinning competition at the same time. |
| Sydney | 4.5% | 4.0–4.5% | Temporary subcontractor availability improvement; affordability ceiling dampening new build demand. |
Source · RLB Australia Market Intelligence Update Q1 2026; Altus Group, Australian Construction Price Outlook Q4 2025. TPI measures contractor pricing including margin and risk loading, making it a more forward-looking indicator than materials price indices alone. Forecasts reflect committed infrastructure pipelines and should be read as indicative ranges.
Sydney's relative slowdown is not a sign of a healthier market. Construction prices have climbed to a point where they're now suppressing demand, with builders holding quotes down just to win work. The current improvement in subcontractor availability is likely temporary. Once the major high-density pipelines and the Western Harbour Tunnel move into their active construction phases later in 2026, that breathing room will close quickly.
Section 05 · What's Eased
The good news: what's gotten cheaper since the 2022 peak
Not every cost input has kept rising. Several of the most acute pressures from 2021 and 2022 have genuinely eased, giving builders and buyers some real, if partial, relief:
- Global shipping and logistics. The worst of the disruption (container shortages, port backlogs and erratic international freight) has largely passed. Shipping costs have come back to normal, which removes one of the most unpredictable variables from builder cost estimates.
- Diesel prices. After hitting record highs and pushing up the cost of moving materials across Australia's long distances, diesel has fallen back to pre-pandemic levels. That feeds through into more stable logistics costs for building supplies.
- Structural timber. Timber, which forms the core of most Australian residential builds, is in a period of price stability in 2026. Domestic stockpiles are high, and competitively priced imported timber has eased pressure on framing quotes considerably.
Section 06 · Lingering Pressures
Why some construction costs are still climbing
The easing in timber and logistics has been partly offset by a different set of pressures, many of them structural rather than cyclical and unlikely to reverse quickly.
Copper is especially disruptive because it tends to hit late in the build, when projects have the least flexibility to absorb additional costs. Because it sits at the centre of global electrification, renewable energy expansion and AI data centre construction, the pressure on copper prices appears structural rather than temporary. Labour conditions are similarly tight. With state governments simultaneously pushing ahead with hospitals, highways and housing, the conditions for wage pressure to ease are still not in place.
Section 07 · Cost of Money
How interest rates have changed the cost of building since 2020
Rising construction costs aren't the only burden on borrowers. The past five years have also brought the sharpest monetary policy tightening in over a decade, and for anyone borrowing to build, the monthly cost of carrying the debt has surged separately from what it costs to construct the home.
April 2020 · Pandemic baseline
- Typical variable rate
2.8–3.4%
- Monthly repayment ($730k, 25 yrs)
~$3,460
- Avg NSW loan size
lower baseline
- QLD loan size growth (1 yr)
—
August 2026 · Current
- Typical variable rate
6.0–6.5%
- Monthly repayment ($730k, 25 yrs)
$4,700–$4,930
- Avg NSW loan size (2026)
$872,752
- QLD loan size growth (1 yr)
+16% (~$100k)
Monthly repayment estimates use principal and interest on a 25-year term. Actual repayments will vary by lender and loan structure. Source: RBA Statement on Monetary Policy, August 2026; RBA Statistical Table F6, housing lending rates to July 2026.
Higher construction costs and higher interest rates are compounding each other. A buyer who needed to borrow $730,000 in 2020 is now, in many cases, borrowing considerably more because the build itself costs more, while also servicing that larger debt at a rate roughly 330 basis points higher2. The monthly gap isn't just $1,3503. It's $1,350 on a loan that is itself significantly bigger than it would have been six years ago.
Section 08 · Adapting
Building smarter in 2026: modular construction and smaller homes are reducing cost pressures
Faced with unpredictable labour availability, material cost spikes, long delays and expensive finance, the Australian market is adapting. Two approaches are gaining real traction among cost-conscious buyers and developers.
Smaller, high-performance footprints. The old ambition of maximising floor area is giving way to the economics of 2026. Fewer square metres means fewer expensive trades, less material and a smaller exposure to cost blowouts. Passive house systems, which once added 15–20% to build cost, now typically add around 5–10% as local expertise and supply chains have caught up. That makes the trade-off between footprint and performance much easier to justify.
Modular and prefabricated construction. The Australian prefab market has grown by over 20% annually in recent years. Modules are built in climate-controlled factories while on-site preparation happens in parallel, cutting total timelines by 30-60%. The main benefit is cost certainty, arguably the single most valuable thing in a market where variation risk has become the norm.
Modular / Prefabricated
- Cost certainty
High cost certainty (fixed-price standard)
- Weather delays
Minimal weather delays (built indoors)
- Build time
30–60% faster than traditional
- Structure
Welded steel chassis, often termite-proof
- Site impact
Low site impact (crane install, low waste)
- Indicative cost
~$380,000 fixed (150 m² 3BR example)
Traditional site-built
- Cost certainty
Low (prime cost and provisional sum exposure)
- Weather delays
Frequent stoppages common
- Build time
12–24 months typical
- Structure
Timber or block frame, standard
- Site impact
Extended noise, waste and disruption
- Indicative cost
$400,000–$450,000+ variable
Cost estimates are indicative ranges and will vary significantly by location, specification and contractor. Source: S2A Modular, Modular vs Traditional Construction in 2026.
For buyers going ahead with a traditional build, industry professionals consistently recommend holding a 10–15% cash contingency buffer, kept liquid rather than borrowed, to cover the variation shocks that remain common in a structurally inflated market. With national costs forecast to rise a further 4.0–7.5% through 2026, depending on the city, every quarter of delay has a real dollar cost attached to it.
References
- Trading Economics, Copper price (CFD tracking the benchmark market), 22 September 2026 · tradingeconomics.com ↑
- RBA Statistical Table F6 Housing Lending Rates workbook (series FLRHOOTA and FLRHOFTA) · Reserve Bank of Australia ↑
- RBA Statement on Monetary Policy, August 2026 — Financial Conditions · Reserve Bank of Australia ↑
- ABS Producer Price Indexes, Australia (Cat. 6427.0) — latest release · Australian Bureau of Statistics
- ABS Building Activity, Australia, March 2026 (Cat. 8752.0) · Australian Bureau of Statistics
- ABS Insights into Output of Building Construction Prices · Australian Bureau of Statistics
- ABS Characteristics of New Residential Dwellings, 15-Year Summary · Australian Bureau of Statistics
- Altus Group, Australian Construction Price Outlook Q4 2025 · altusgroup.com
- RLB Australia Market Intelligence Update, Q1 2026 · rlb.com
- CIE / HIA, Taxation's Major Impact on Housing (2025 Report) · hia.com.au
- RBA Statement on Monetary Policy, February 2026 · Reserve Bank of Australia
- Scale Suite, Australian Business Insolvency by Industry 2026 · scalesuite.com.au
- S2A Modular, Modular vs Traditional Construction in 2026 · s2amodular.com
