

Published 6 May 2026 · Updated 21 Sept 2026
Building a new home in Australia involves two key waiting periods: approval to commencement (the time from receiving planning approval to breaking ground), and commencement to completion (the time from first sod to handover). Both phases vary by state, and both have been affected by the post-COVID construction slowdown.
 How long does it take to build a house in Australia?The average time from approval to handover is now about 11.5 months for a house, 14.8 months for a townhouse and almost 33 months for an apartment in Australia. While homes still take much longer to b…
 How many homes are built in Australia each year?Two distinct cycles have shaped Australia's housing output since 2010:
Section 01
How long does it take to build a home in Australia?
Building a new home involves two main stages: the wait from approval to commencement, and the build itself from commencement to completion. Both stages matter, but the real blowout has been in construction, not in getting projects started.
What you build matters almost as much as where you build it. Detached houses remain the quickest to complete, taking an average of 9.2 months1 nationally in 2025. Townhouses are slower at 11.7 months. Apartments take the longest at 28.7 months2, pushing the average build time close to two and a half years from commencement to handover. In NSW, apartment completion times reached 31.8 months in 2025, the longest recorded in this dataset.
Once the approval phase is added in, the gap becomes even clearer. The total time from planning approval to completion is 11.5 months for houses and 14.8 months for townhouses. Apartments are in a different category altogether, taking almost 33 months from approval to completion, or close to three years.
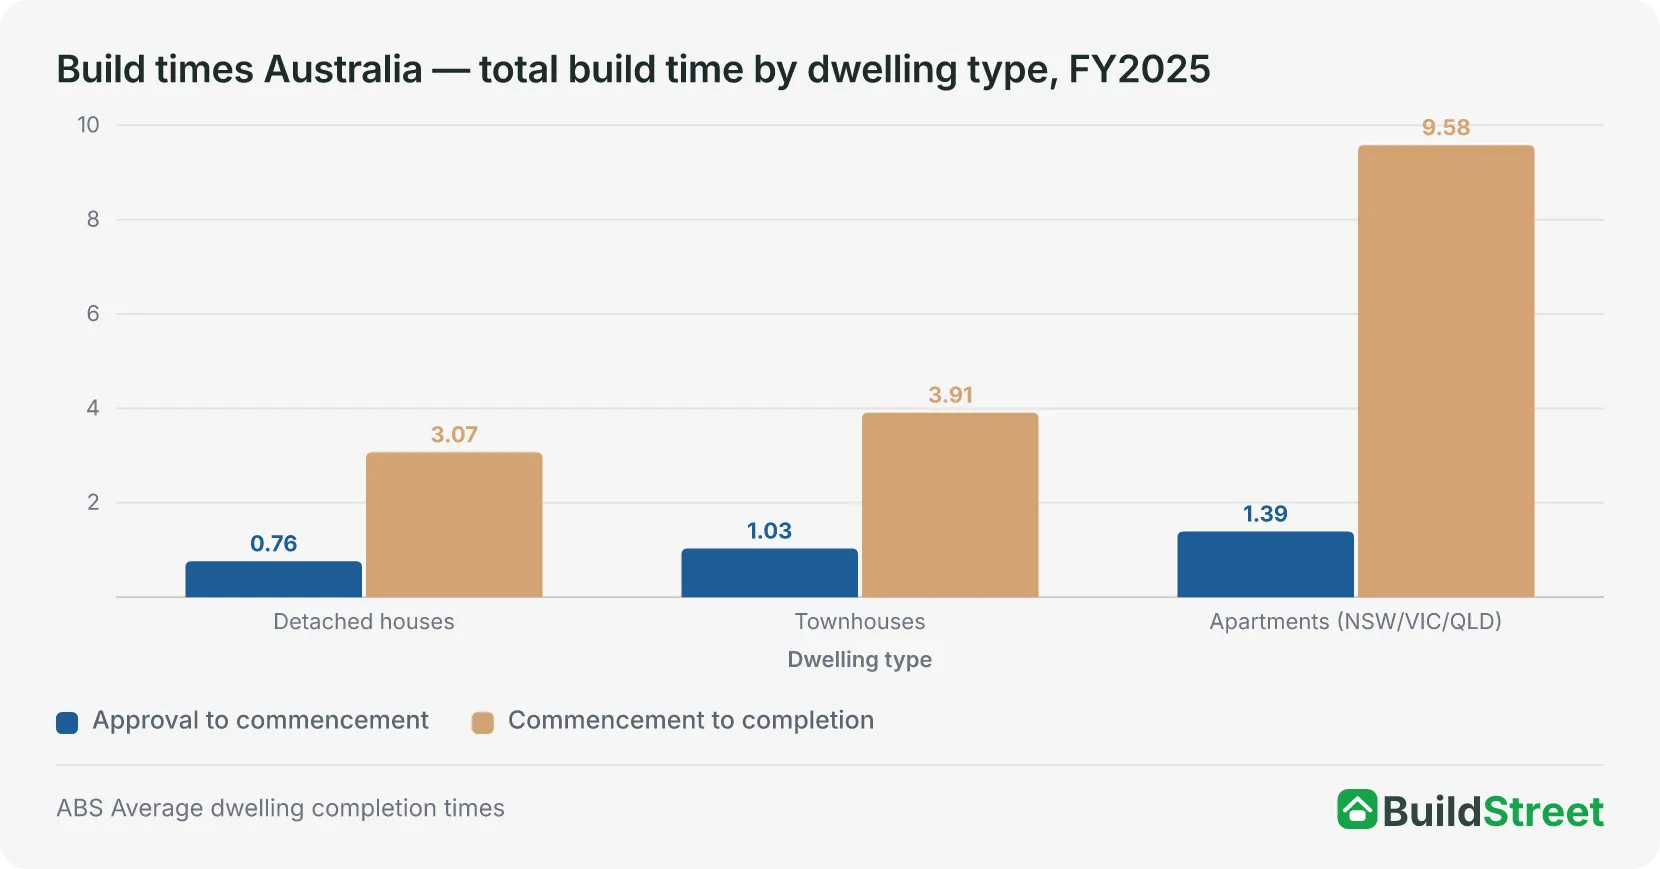
| Dwelling type | Approval → commencement | Commencement → completion | Total |
|---|---|---|---|
| Detached houses | 0.762.3 mo | 3.079.2 mo | 3.8311.5 mo |
| Townhouses | 1.033.1 mo | 3.9111.7 mo | 4.9414.8 mo |
| Apartments (NSW/VIC/QLD) | 1.394.2 mo | 9.5828.7 mo | 10.9732.9 mo |
Source · ABS Building Activity Survey.
Section 02
Approval-to-commencement times by state
Once a building approval is granted, the next question is how quickly construction actually begins. Nationally, new houses in Australia took an average of 2.3 months3 to move from approval to commencement in 2025, or roughly ten weeks. But that average masks a wide gap between states.
The ACT was the fastest at 1.7 months, followed closely by the Northern Territory and Victoria at 1.8 months. South Australia was the slowest at 3.6 months3, more than double the ACT's pace. It has held that position for most of the past decade, suggesting a structural issue rather than a short-term delay.
For townhouses, New South Wales recorded the slowest start times in the country in 2025, at 4.6 months3. That is almost double its 2021 low of 2.3 months. Even so, approval-to-commencement times have remained far more stable than construction times. The biggest post-COVID blowout in build times has happened after projects get underway, not before.
Fastest to break ground
ACT — 0.57 qtrs · 1.7 months
The ACT consistently breaks ground the fastest after approval. At just 1.7 months, it is less than half the time it takes in South Australia. The ACT's smaller approval pipeline and concentrated building activity in Canberra help keep pre-construction delays short.
Slowest to break ground
SA — 1.19 qtrs · 3.6 months
South Australia has held the slowest approval-to-commencement position for most of the past decade. At 3.6 months, SA takes more than double the ACT. This points to structural causes — including slower council processes and a smaller builder base — rather than short-term pressure.
Townhouse watch — NSW
NSW — 1.53 qtrs · 4.6 months (townhouses)
For townhouses specifically, NSW now has the slowest build start time in the country. That is nearly double its 2021 low of 0.78 quarters. Pre-construction delays in NSW for medium-density builds have grown significantly, likely reflecting planning complexity and site preparation pressures in Sydney.
Key insight
Phase 1 is stable — COVID impact was mostly in Phase 2
Across all states, approval-to-commencement times have remained relatively stable over the past decade. The big blowout in home build times since 2021 happened almost entirely in the commencement-to-completion phase — the actual construction period — not in the pre-construction pipeline.
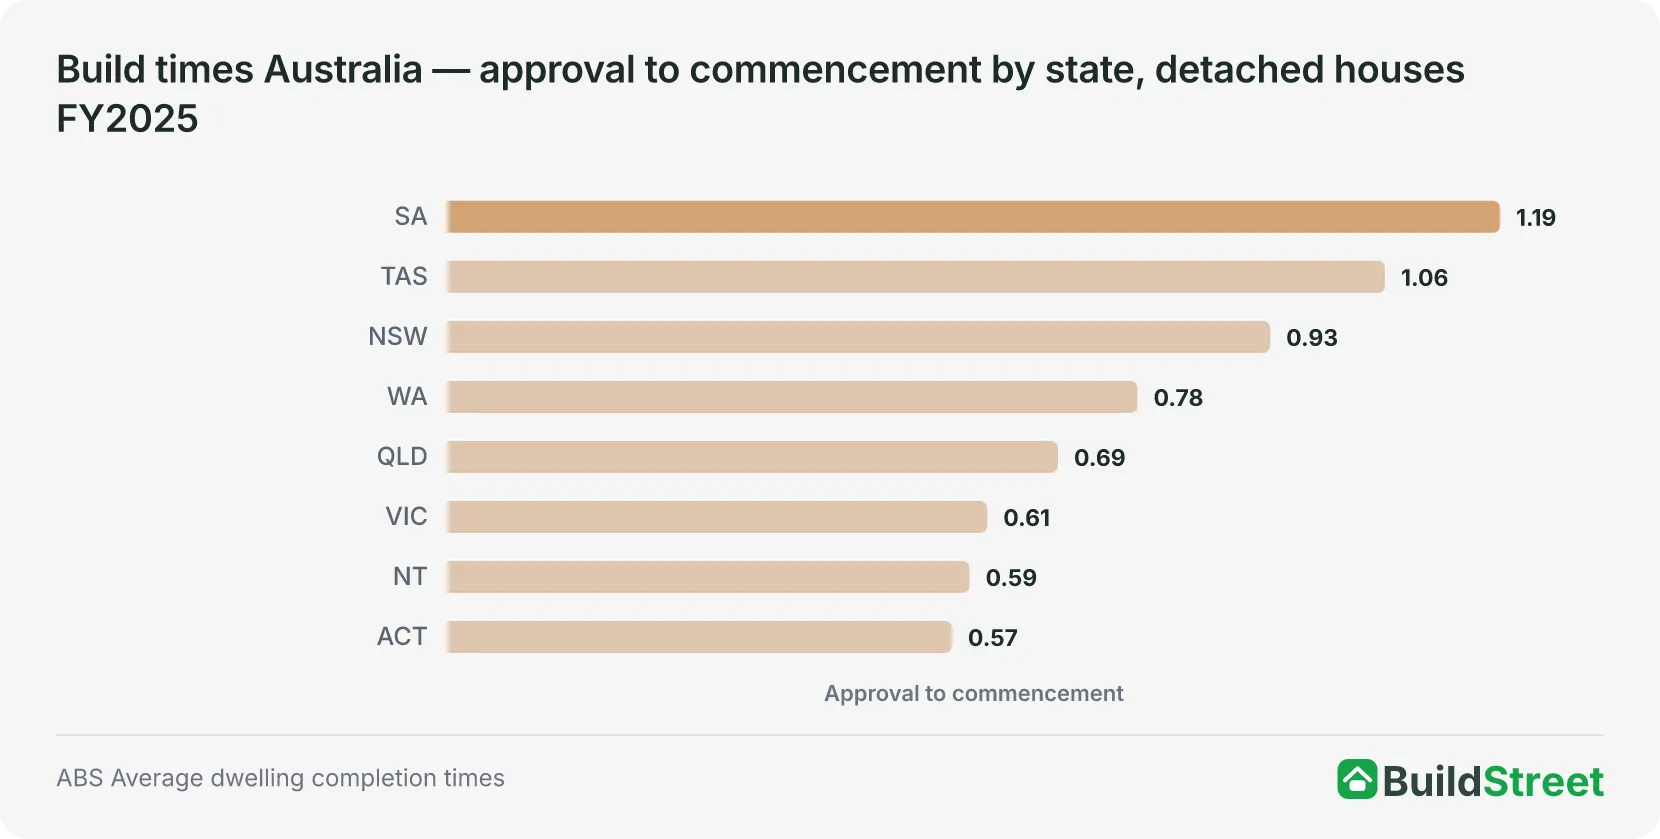
Full data: commencement-to-completion times by year
| State | FY2015 | FY2016 | FY2017 | FY2018 | FY2019 | FY2020 | FY2021 | FY2022 | FY2023 | FY2024 | FY2025 |
|---|---|---|---|---|---|---|---|---|---|---|---|
| NSW | 0.74 | 0.82 | 0.88 | 0.83 | 0.81 | 0.76 | 0.81 | 0.91 | 0.9 | 0.87 | 0.93 |
| VIC | 0.56 | 0.63 | 0.58 | 0.58 | 0.61 | 0.61 | 0.56 | 0.64 | 0.62 | 0.65 | 0.61 |
| QLD | 0.56 | 0.57 | 0.56 | 0.58 | 0.66 | 0.56 | 0.64 | 0.75 | 0.75 | 0.7 | 0.69 |
| SA | 0.98 | 0.99 | 1.07 | 1.04 | 1.11 | 1.15 | 0.98 | 1.44 | 1.1 | 1.28 | 1.19 |
| WA | 0.72 | 0.7 | 0.7 | 0.67 | 0.63 | 0.65 | 0.67 | 1.03 | 0.81 | 0.76 | 0.78 |
| TAS | 0.74 | 0.8 | 0.99 | 0.87 | 0.88 | 0.85 | 0.96 | 1.12 | 0.95 | 1.05 | 1.06 |
| NT | 0.56 | 0.57 | 0.58 | 0.54 | 0.47 | 0.59 | 0.52 | 0.57 | 0.51 | 0.59 | 0.59 |
| ACT | 0.69 | 0.6 | 0.62 | 0.6 | 0.57 | 0.53 | 0.59 | 0.76 | 0.63 | 0.68 | 0.57 |
| Australia | 0.66 | 0.69 | 0.7 | 0.68 | 0.71 | 0.68 | 0.68 | 0.85 | 0.77 | 0.77 | 0.76 |
Source · ABS Building Activity, June 2025
Section 03
Commencement-to-completion times by state
This is where the numbers are most striking. House build times blew out after 2021 as supply chain delays, labour shortages, and the HomeBuilder-driven surge in demand pushed construction capacity to its limit.
Queensland and the NT have the fastest house completion times, both at 7.1 months2 in 2025. The Sunshine State has been the fastest of the six states in every year of the past decade, helped by less complex houses and a labour market that has generally been less strained than the southern states.
At the other end is Western Australia. WA has the longest home build times of any state, with commencement-to-completion times peaking at 15.6 months2 in 2024, about 50% above the national average. Extended border closures worsened labour shortages just as demand was rising. That eased to 13.1 months in 2025, but WA remains well above the national average and its pre-COVID level. The ACT, at 11.3 months, and South Australia, at 10.1 months, are also slower than average.
The national average for houses fell from a peak of 10.4 months in 2024 to 9.2 months in 2025. Conditions are easing, but build times across Australia are still about 40% longer than they were before COVID.
Slowest in Australia
WA — 4.37 qtrs · 13.1 months — 42% above national average
Western Australia has the longest house build times of any state. Its peak was 5.19 quarters (15.6 months) in 2024, about 50% above the national average at the time. Extended border closures compounded an already severe labour shortage. 2025 shows a 15.8% improvement, but WA is still 84% above its pre-COVID average of 2.37 quarters.
Fastest in Australia
QLD & NT — 2.36 qtrs · 7.1 months — 23% below national average
Queensland has been the fastest of the six states for house completions in every year of the past decade. Simpler home types, a less strained labour market, and strong regional building capacity all help. Queensland also improved by 12.9% in 2025, showing that being already fast does not prevent further gains.
Biggest improver
SA — 16.3% faster year-on-year
South Australia recorded the biggest percentage improvement of any state in 2025, dropping from 4.04 quarters (12.1 months) in 2024 to 3.38 quarters (10.1 months). The state had accumulated one of the worst backlogs during the boom years, and its pipeline is now clearing faster than most.
The good news
Every state improved — 2025 is the first year all 8 states got faster
For the first time since the COVID boom, every state and territory recorded a shorter commencement-to-completion time for houses in 2025 compared to 2024. The improvements range from 2.9% in the NT to 16.3% in SA. The national average is still 40% above pre-COVID, but the direction has clearly turned.
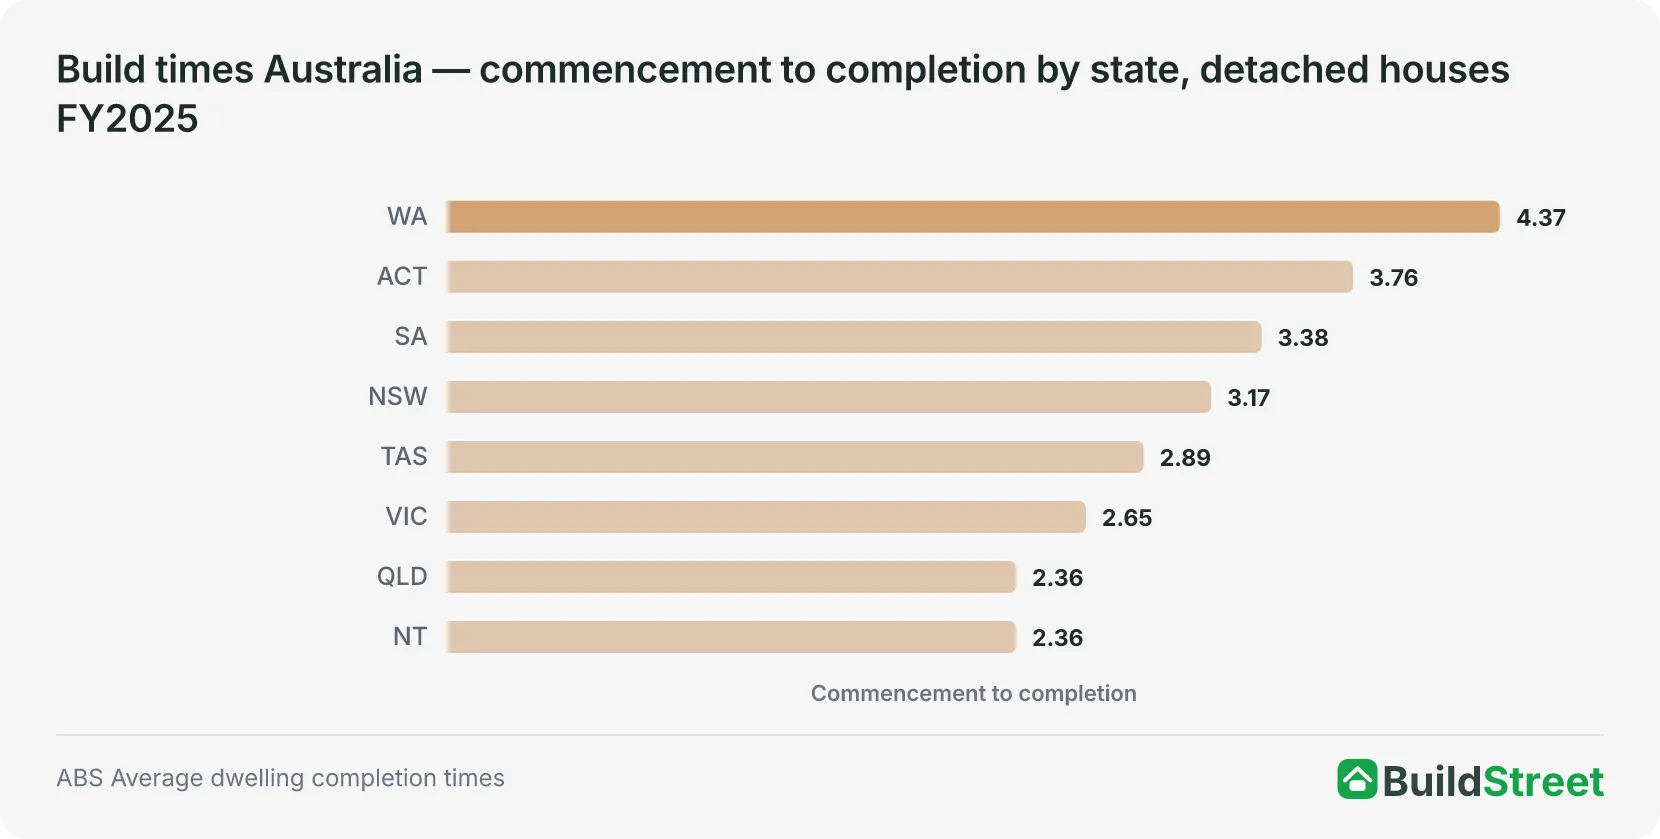
| State | FY2015 | FY2016 | FY2017 | FY2018 | FY2019 | FY2020 | FY2021 | FY2022 | FY2023 | FY2024 | FY2025 |
|---|---|---|---|---|---|---|---|---|---|---|---|
| NSW | 2.22 | 2.19 | 2.3 | 2.35 | 2.37 | 2.37 | 2.36 | 2.82 | 3.14 | 3.39 | 3.17 |
| VIC | 2.24 | 2.15 | 2.24 | 2.36 | 2.35 | 2.2 | 2.17 | 2.51 | 3.07 | 3.12 | 2.65 |
| QLD | 1.65 | 1.69 | 1.7 | 1.7 | 1.73 | 1.72 | 1.86 | 2.31 | 2.81 | 2.71 | 2.36 |
| SA | 2.17 | 2.17 | 2.12 | 2.28 | 2.27 | 2.25 | 2.37 | 2.91 | 3.73 | 4.04 | 3.38 |
| WA | 2.67 | 2.73 | 2.34 | 2.23 | 2.33 | 2.37 | 2.43 | 3.21 | 4.88 | 5.19 | 4.37 |
| TAS | 2.28 | 2.23 | 2.43 | 2.27 | 2.25 | 2.57 | 2.55 | 2.9 | 3.28 | 3.24 | 2.89 |
| NT | 1.8 | 1.67 | 1.64 | 1.79 | 1.89 | 1.83 | 1.83 | 2.28 | 2.27 | 2.43 | 2.36 |
| ACT | 2.18 | 2.35 | 2.44 | 2.59 | 2.49 | 2.64 | 2.68 | 2.97 | 3.47 | 3.97 | 3.76 |
| Australia | 2.2 | 2.2 | 2.14 | 2.19 | 2.22 | 2.18 | 2.2 | 2.64 | 3.34 | 3.47 | 3.07 |
Section 04
Build time trends in Australia since 2015
The past decade falls into two distinct phases. From 2015 to 2021, build times were relatively stable across all major dwelling types. Houses typically took between 6.4 and 6.7 months2 to complete, townhouses between 8.8 and 10.6 months, and apartments between 18 and 26.1 months. Apartments were always slower, but the overall pattern was steady.
That changed from 2022. Build times lengthened as the HomeBuilder stimulus drove demand higher, supply chains for materials came under pressure, and builders struggled to keep up as projects stacked up across multiple states.
The latest 2025 data suggests the worst of that blowout may be easing, at least for lower-density housing. National house build times have fallen from a peak of 10.4 months in 2024 to 9.2 months in 2025. Townhouse build times have also improved, dropping from 12.9 months to 11.7 months over the same period. But the recovery is uneven. Western Australia remains the clearest pressure point. Even after improving from its 2024 peak of 15.6 months, detached house build times in WA were still 13.1 months in 2025, nearly double their pre-COVID level.
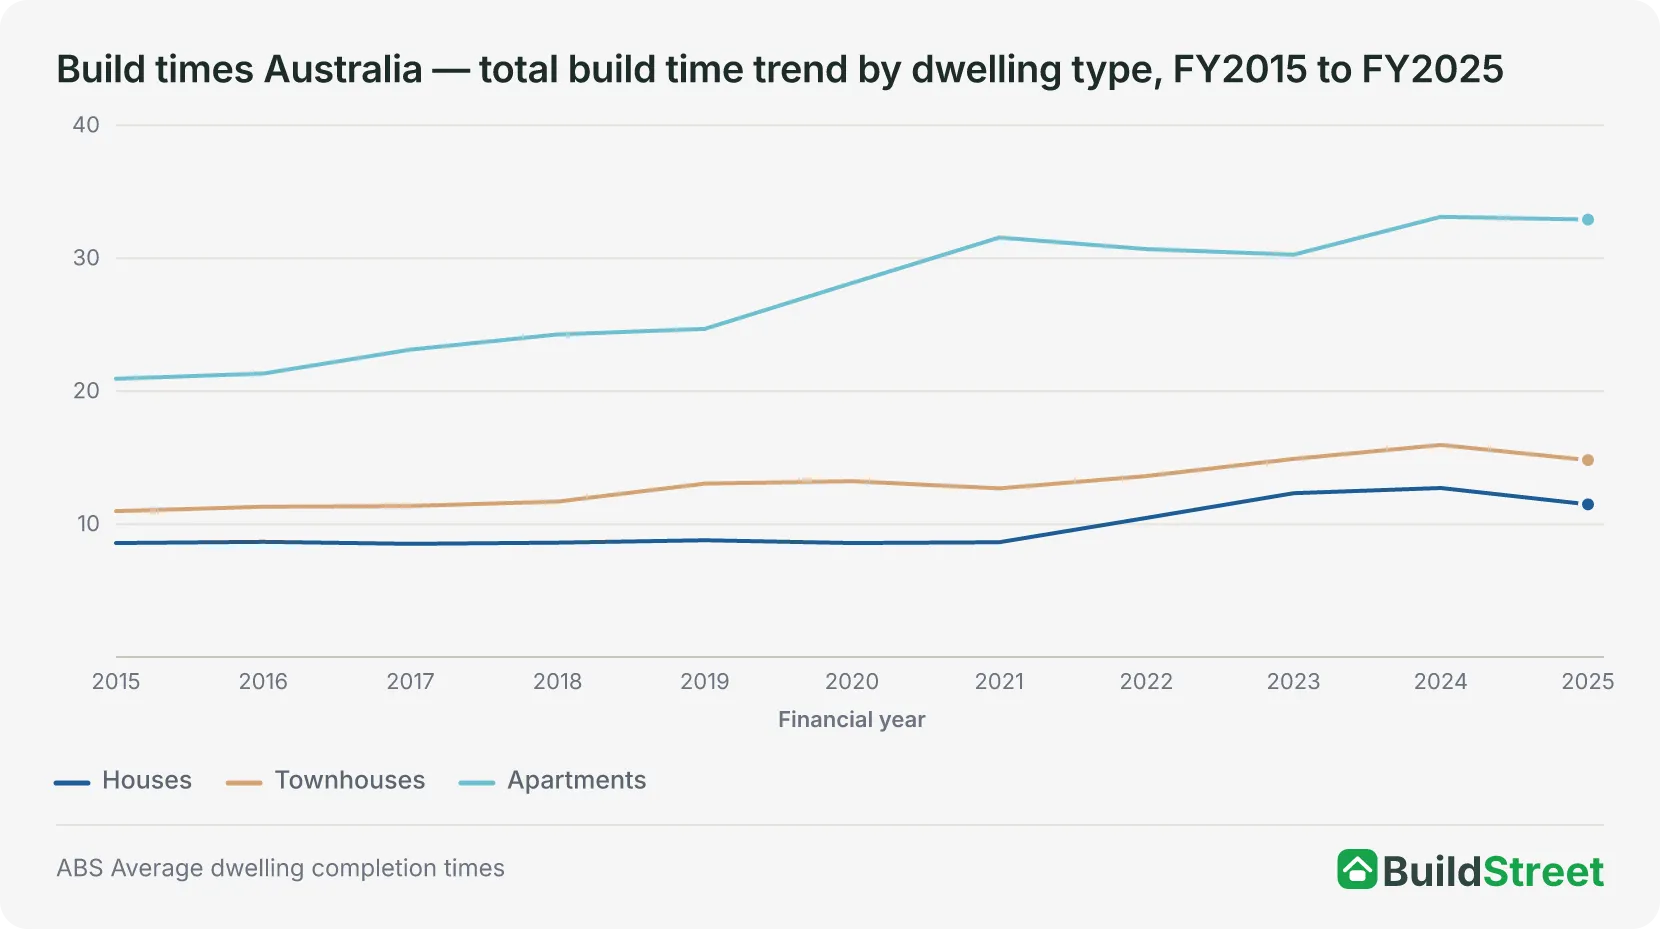
| Financial Year | Houses | Townhouses | Apartments |
|---|---|---|---|
| FY2015 | 2.868.6 mo | 3.6611 mo | 6.9820.9 mo |
| FY2016 | 2.898.7 mo | 3.7711.3 mo | 7.1121.3 mo |
| FY2017 | 2.848.5 mo | 3.7911.4 mo | 7.7123.1 mo |
| FY2018 | 2.878.6 mo | 3.911.7 mo | 8.0924.3 mo |
| FY2019 | 2.938.8 mo | 4.3513.1 mo | 8.2324.7 mo |
| FY2020 | 2.868.6 mo | 4.4113.2 mo | 9.3828.1 mo |
| FY2021 | 2.888.6 mo | 4.2312.7 mo | 10.5231.6 mo |
| FY2022 | 3.4910.5 mo | 4.5413.6 mo | 10.2330.7 mo |
| FY2023 | 4.1112.3 mo | 4.9714.9 mo | 10.0930.3 mo |
| FY2024 | 4.2412.7 mo | 5.3216 mo | 11.0433.1 mo |
| FY2025 (latest) | 3.8311.5 mo | 4.9414.8 mo | 10.9732.9 mo |
Source · ABS Building Activity Survey. Apartments: NSW, VIC, QLD only. Total time from approval to completion, national averages.
References
- Building Activity, Australia, June 2025 · Australian Bureau of Statistics ↑
- ABS Building Activity, Australia — Average dwelling completion times (jun-2025) · Australian Bureau of Statistics ↑ b c d
- ABS Building Activity, Australia, June 2025 — Average Dwelling Commencement Times · Australian Bureau of Statistics ↑ b c
