

Published 6 Aug 2026
Australia's price-to-income index reached 150.3 in the December quarter of 2025, measured against its own long-run average of 100. That was the highest reading among the 21 OECD countries with data for the quarter, ahead of Canada at 147.3 and the OECD aggregate at 108.4.
Measured instead against a fixed 2015 base, Australia's index was 121.8, an increase of 79.4% since the March quarter of 2000. The OECD aggregate rose 18.8% over the same period, while Canada's index increased by 95.2%.
A third measure examines housing-cost burden rather than house prices relative to income. In 2021, 6.5% of Australians lived in households spending more than 40% of disposable income on rent or mortgage payments, below the OECD average of 9.2%. Australia's figure predates the rise in the Reserve Bank of Australia cash rate target that began in May 2022.
 Migration and housing demand across Australia's capital citiesNet overseas migration added 302,184 people to Australia's population in 2024–25, accounting for 72.5% of the country's total population growth that year. The eight capital cities received 258,100 peo…
 How Australia's home building rate compares to other countriesAustralia completed 6.27 dwellings per 1,000 people in 2025, the lowest rate in 26 years and the seventh consecutive annual decline. That is 173,228 new homes for a population of 27.6 million.
Section 01 · Measurement
How is housing affordability measured across countries?
Housing affordability is measured internationally using several approaches, including price-to-income ratios, housing expenditure as a share of income, residual income, housing quality and household perceptions.
Two commonly used expenditure-to-income thresholds are a 30% rule of thumb, under which housing costs are compared with gross household income, and a separate 40% overburden threshold based on disposable income. Neither is a hard boundary.
Each group of measures answers a different question:
- Price-to-income ratios compare house prices to nominal disposable income per head at national level.
- Expenditure-to-income ratios measure what households pay out of their income.
- Residual income measures what a household has left once housing is paid for.
- Housing quality measures describe the condition and size of the dwelling.
- Subjective indicators record how households rate their own housing.
| Families of housing affordability measures used internationally, per the OECD's HC1.5 indicator (last updated 27 May 2021) | ||
|---|---|---|
| Measure family | Example indicator | Principal limitation stated by the OECD |
| Price-to-income ratios | House-price-to-income; rent-price-to-income | Aggregate only; says nothing about distribution or housing quality, and excludes borrowing costs |
| Housing expenditure-to-income ratios | Housing cost burden; overburden rate above 40% | The threshold is fixed and arbitrary regardless of household circumstances |
| Residual income measures | Shelter poverty; housing-induced poverty | Can misdiagnose general cost-of-living problems as housing problems |
| Housing quality measures | Rooms per person; overcrowding; deprivation | Cross-country and cross-cultural differences in what counts as quality |
| Subjective indicators | Satisfaction with availability of affordable housing | Expectations differ across individuals, countries and cultures |
Source · OECD Affordable Housing Database, indicator HC1.5 Overview of affordable housing indicators, Table HC1.5.1.
The OECD also publishes cross-country housing-quality indicators HC2.1 to HC2.3 and the subjective indicator HC1.4. These measure different dimensions of housing affordability and are not used in this article. The OECD does not publish a standard cross-country indicator for residual income measures.
The choice between the 30% and 40% thresholds is arbitrary, and neither holds the same meaning across the income distribution: for a low-income household, even spending 10% or 20% of income on housing costs may leave little for other essentials.
Section 02 · Price-to-income indices
Australia's price-to-income index compared with other economies
Australia's price-to-income index reached 121.8 in the December quarter of 2025, against a 2015 base of 100. Canada recorded 128.0, the United States 126.9, and the OECD aggregate 114.8.
The comparison covers the period from the March quarter of 2000 to the December quarter of 2025, the longest window with endpoints common to all eight series. The figures are seasonally adjusted, although the OECD's underlying series extends further back than the window shown.
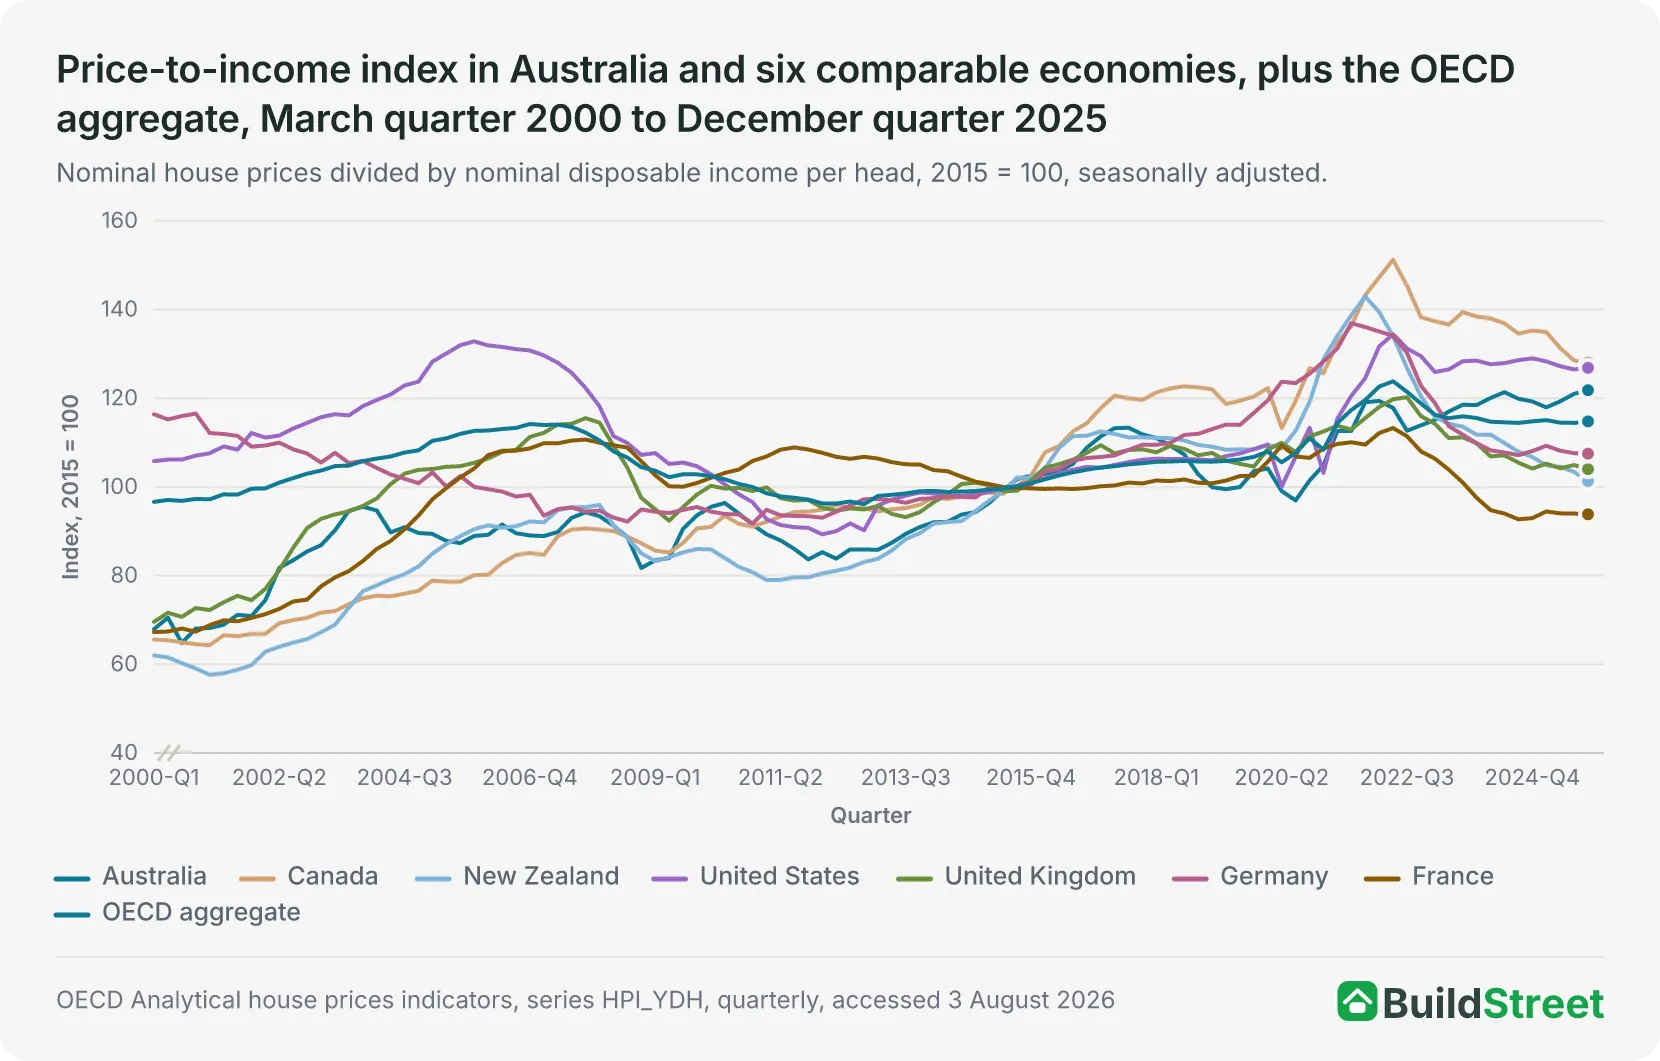
All eight series pass close to 100 around 2015, because that is the base year. Germany starts at 116.4 in the March quarter of 2000, above that base, and falls through the 2000s, while Australia, Canada, New Zealand and France all start in the 60s and rise towards it.
The 2015 base is a fixed point rather than a national benchmark, so it does not show how far a country sits from its own history. The OECD publishes a second version of the series for that purpose, setting each country's own long-term average at 100. A reading of 150 places the ratio 50% above that country's historical norm.
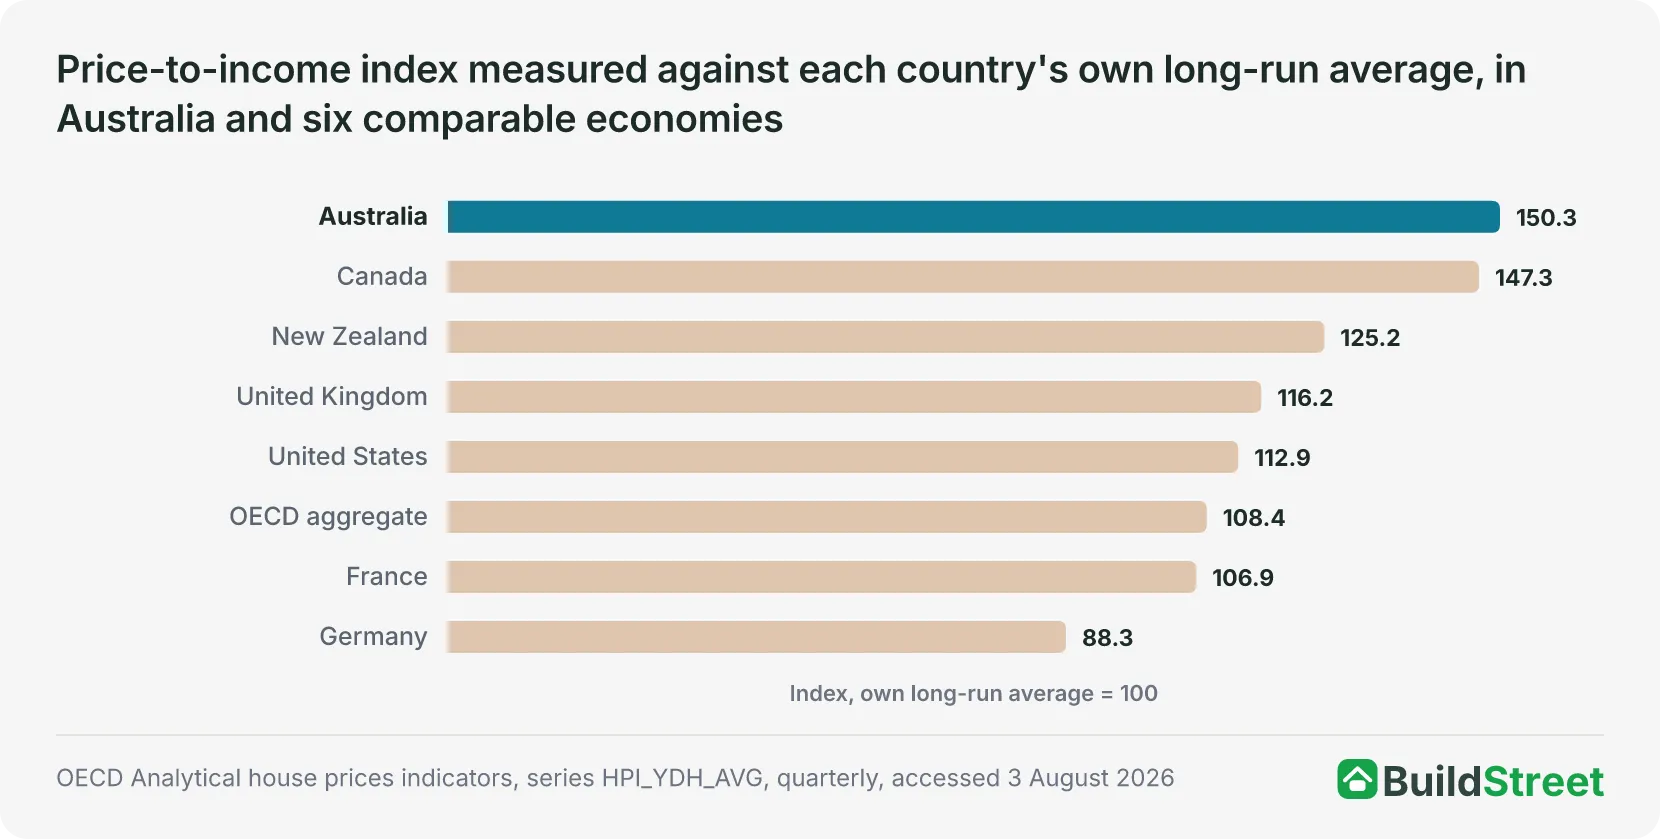
Australia records 150.3 on this basis, the highest of the 21 OECD member countries with a value for the quarter. Canada follows at 147.3. Germany sits at 88.3, below its own long-run average.
Against the 2015 base, Australia and the OECD aggregate read 121.8 and 114.8, a difference of 7.0 index points. Against national norms, the same two read 150.3 and 108.4, a difference of 41.9 index points.
| Price-to-income index in Australia and comparable economies, selected quarters, 2000 to 2025 | ||||||
|---|---|---|---|---|---|---|
| Country or aggregate | 2000-Q1 | 2015-Q1 | 2019-Q4 | 2025-Q4 | Change 2000→2025 | vs own long-run avg. |
| Australia | 67.9 | 96.4 | 103.6 | 121.8 | +79.4% | 150.3 |
| Canada | 65.6 | 98.7 | 120.4 | 128.0 | +95.2% | 147.3 |
| New Zealand | 62.0 | 96.9 | 108.4 | 101.3 | +63.5% | 125.2 |
| United Kingdom | 69.6 | 100.4 | 104.6 | 104.0 | +49.5% | 116.2 |
| United States | 105.8 | 98.9 | 108.5 | 126.9 | +19.9% | 112.9 |
| France | 67.3 | 100.6 | 102.5 | 93.8 | +39.5% | 106.9 |
| Germany | 116.4 | 99.9 | 116.7 | 107.5 | −7.6% | 88.3 |
| OECD aggregate | 96.6 | 99.4 | 106.8 | 114.8 | +18.8% | 108.4 |
Source · OECD Analytical house prices indicators, series HPI_YDH and HPI_YDH_AVG, accessed 3 August 2026.
Canada leads on change since 2000 at +95.2%. Australia leads on distance from national norm at 150.3. The two columns order the same eight areas differently, and neither ordering replaces the other.
Four areas have observations after the December quarter of 2025. Australia reached 125.1 in the March quarter of 2026, the highest quarterly reading in the period from the March quarter of 2000 onwards. Canada's latest quarter is the June quarter of 2026, while Germany's and France's are the March quarter of 2026. The other four series end in the December quarter of 2025, so their latest-quarter values are not directly comparable.
Section 03 · Australian cities
How house prices and housing costs compare across Australian capital cities
Greater Hobart's house price index rose 99.7% between the March quarter of 2015 and the December quarter of 2021, the largest increase of Australia's eight capital-city regions, while Greater Darwin's fell 10.9% over the same period. This created a gap of 110.6 percentage points between the two.
This section draws on two separate measures of Australian cities: house price movement, and housing costs as a share of income. Neither offers a global ranking of city affordability, and no such ranking appears in the official sources reviewed for this page. The OECD price series runs from the September quarter of 2003 to the December quarter of 2021 across eight regions, measures nominal prices only, and includes no income denominator.
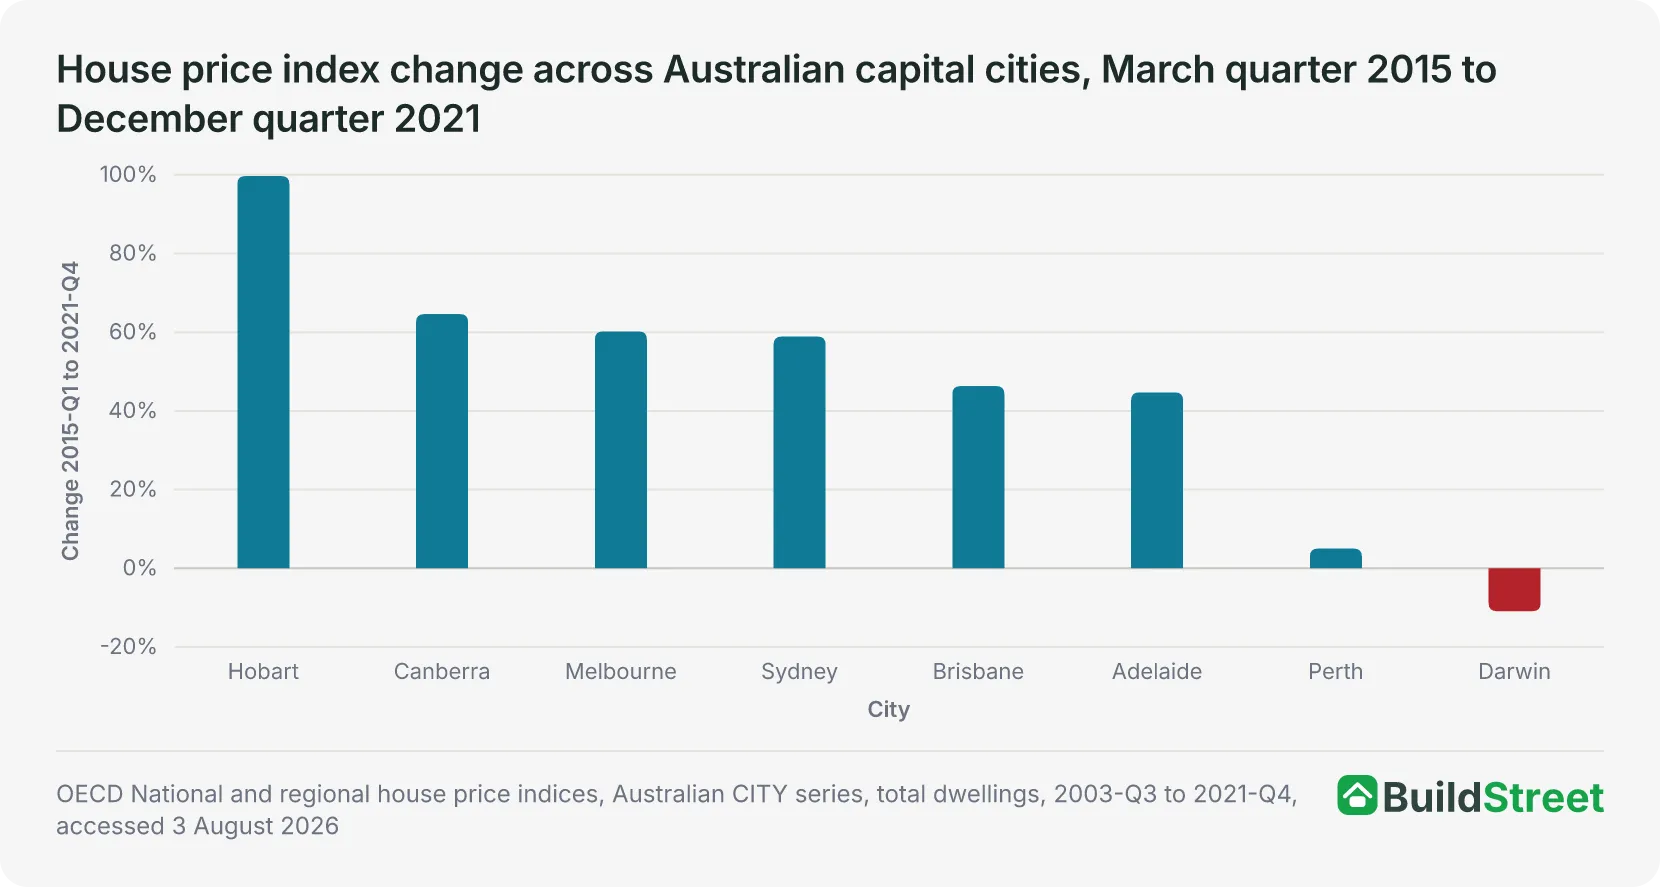
Greater Sydney rose 58.9% over the same seven years, ranking fourth among the eight regions, behind Greater Hobart, Canberra at 64.6% and Greater Melbourne at 60.2%.
A national figure averages across that range. The same limitation applies to the national figures quoted for every other country in this article.
Housing costs, including rent, rates and mortgage repayments, accounted for a median 14.8% of gross household income across Australia's capital cities in the 2019-20 financial year, the most recent year available. The figure ranged from 13.3% in Greater Adelaide to 16.8% in Greater Sydney.
| Median housing costs as a share of income by Australian capital city, 2019–20 | ||||
|---|---|---|---|---|
| Greater capital city area | All households (%) | 95% margin of error (± pp) | Owners with mortgage (%) | Private renters (%) |
| Greater Sydney | 16.8% | 1.0 | 18.9 | 24.4 |
| Greater Brisbane | 15.5 | 1.1 | 15.8 | 22.5 |
| Greater Darwin | 15.4 | 1.8 | 16.5 | 20.3 |
| Greater Perth | 13.8 | 1.6 | 16.5 | 20.5 |
| Greater Melbourne | 13.6 | 1.0 | 17.2 | 20.4 |
| Greater Hobart | 13.6 | 2.1 | 15.8 | 24.7 |
| Australian Capital Territory | 13.6 | 1.4 | 16.3 | 20.2 |
| Greater Adelaide | 13.3 | 1.2 | 14.8 | 21.4 |
| All greater capital city areas | 14.8 | 0.5 | 16.9 | 21.8 |
Source · ABS, Housing Occupancy and Costs, 2019-20 financial year, data cube 11, Table 11.2, released 25 May 2022.
Greater Sydney records 16.8%, the highest published estimate among the eight areas, with a margin of error of 1.0 percentage point. That interval overlaps those of Greater Brisbane and Greater Darwin, so the published table alone does not establish a statistically clear ordering among the three.
Greater Melbourne, Greater Hobart and the ACT each record 13.6%, while Greater Adelaide records 13.3%. All four intervals overlap, so the table does not support ranking them against one another.
Greater Hobart recorded the largest price rise to 2021 but sits in the lower group on cost burden at 13.6%. Price growth and cost burden order the cities differently.
The national medians from the same survey are 13.7% for all households, 16.4% for owners with a mortgage and 22.3% for private renters.
Section 04 · Renter burdens
How much income do renters spend on rent in Australia and other countries?
The median Australian renter spent 23.1% of disposable income on rent in 2021. New Zealand recorded 25.9%, Canada 24.5%, the United States 24.4%, and the OECD aggregate 21.8%.
The OECD publishes a housing cost burden rather than a rent-to-income ratio. It covers rent for private and subsidised tenants together, measured against equivalised disposable household income, in three versions:
- the median across all renters
- the median for renters in the bottom income quintile
- the share of the total population living in households that spend more than 40% of disposable income on housing costs
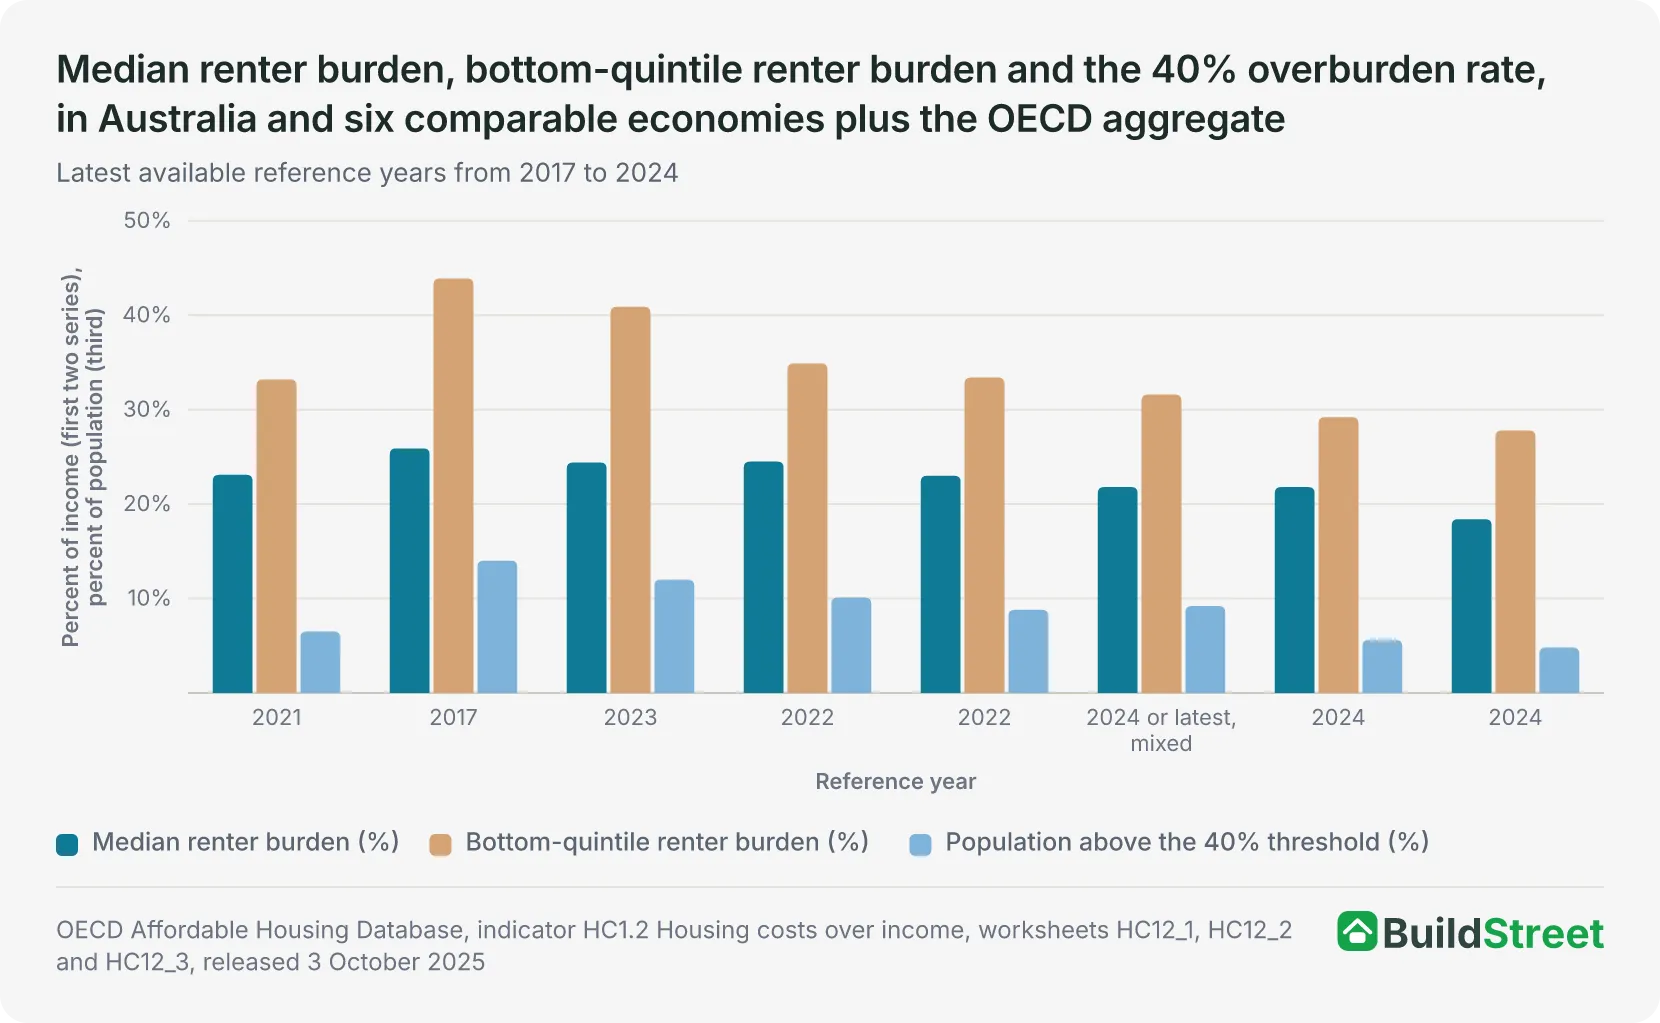
Australia's median renter burden of 23.1% ranks fourth among the eight areas. Its bottom-quintile burden of 33.2% sits close to the OECD aggregate of 31.6%. Its overburden rate, which counts people rather than households, is 6.5%, the third lowest behind Germany at 4.8% and France at 5.6%.
Each measure covers a different group and uses a different base: all renters, the lowest-income fifth of renters, and the whole population rather than households. Australia sits in a different position on each measure.
Sorted against the full OECD dataset, Australia places 18th among the 35 countries with bottom-quintile renter data and 23rd of the 40 with total-population overburden data. The OECD does not publish these ranks; both come from sorting the published country values.
| Renter and owner housing-cost burdens in Australia and six comparable economies, plus the OECD aggregate, latest available reference year for each, 2017 to 2024 | |||||
|---|---|---|---|---|---|
| Country or aggregate | Reference year | Median renter (%) | Owner with mortgage (%) | Bottom-quintile renter (%) | Population above 40% (%) |
| New Zealand | 2017 | 25.9 | 15.7 | 43.9 | 14.0 |
| Canada | 2022 | 24.5 | 16.0 | 34.9 | 10.1 |
| United States | 2023 | 24.4 | 15.1 | 40.9 | 12.0 |
| Australia | 2021 | 23.1 | 18.2 | 33.2 | 6.5 |
| United Kingdom | 2022 | 23.0 | 17.0 | 33.4 | 8.8 |
| France | 2024 | 21.8 | 18.1 | 29.2 | 5.6 |
| Germany | 2024 | 18.4 | 13.6 | 27.8 | 4.8 |
| OECD aggregate | 2024 or latest, mixed | 21.8 | 15.6 | 31.6 | 9.2 |
Source · OECD Affordable Housing Database, indicator HC1.2, worksheets HC12_1, HC12_2 and HC12_3, released 3 October 2025.
Australia records the highest owner-with-mortgage burden of the eight areas at 18.2%. France follows at 18.1% and the United Kingdom at 17.0%. Australia and France are the only two areas in comparison where the owner burden exceeds the OECD aggregate of 15.6% by more than two percentage points.
Australia's data relates to 2021, when the Reserve Bank of Australia cash rate target remained at 0.10% for the full year; the target reached 4.35% by June 2026. The German and French readings cover 2024. Reference years differ across the table, which limits direct comparison.
Rent prices are tracked separately as a real index, deflated by each country's own consumer price index rather than measured against income.
Note: This index measures rent prices after inflation, not the share of income rents absorb, and the two can move in opposite directions. Changes are calculated from unrounded index values. Source: OECD Affordable Housing Database, indicator HM1.2 Housing prices, table HM1.2.A3, released 3 October 2025.
Australian real rents in 2024 measured 91.9 against the 2015 base of 100, or 8.1% below it. They stood 5.4% above their 2000 level, the second-largest increase of the seven economies after the United States at 19.2%.
Real rents fell over the same period in Germany, New Zealand, Canada and France. Rent prices and renter burdens can move in opposite directions, because the burden measure divides rent by income while the rent index divides rent by consumer prices.
Section 05 · Change since 2000
How price-to-income indices have changed since 2000
Australia's price-to-income index rose 79.4% between the March quarter of 2000 and the December quarter of 2025, calculated from the OECD index values at those two quarters. Canada rose 95.2%, and the OECD aggregate increased by 18.8%.
The comparison uses the March quarter of 2000 and the December quarter of 2025 for all eight areas, the longest span with an endpoint common to every series.
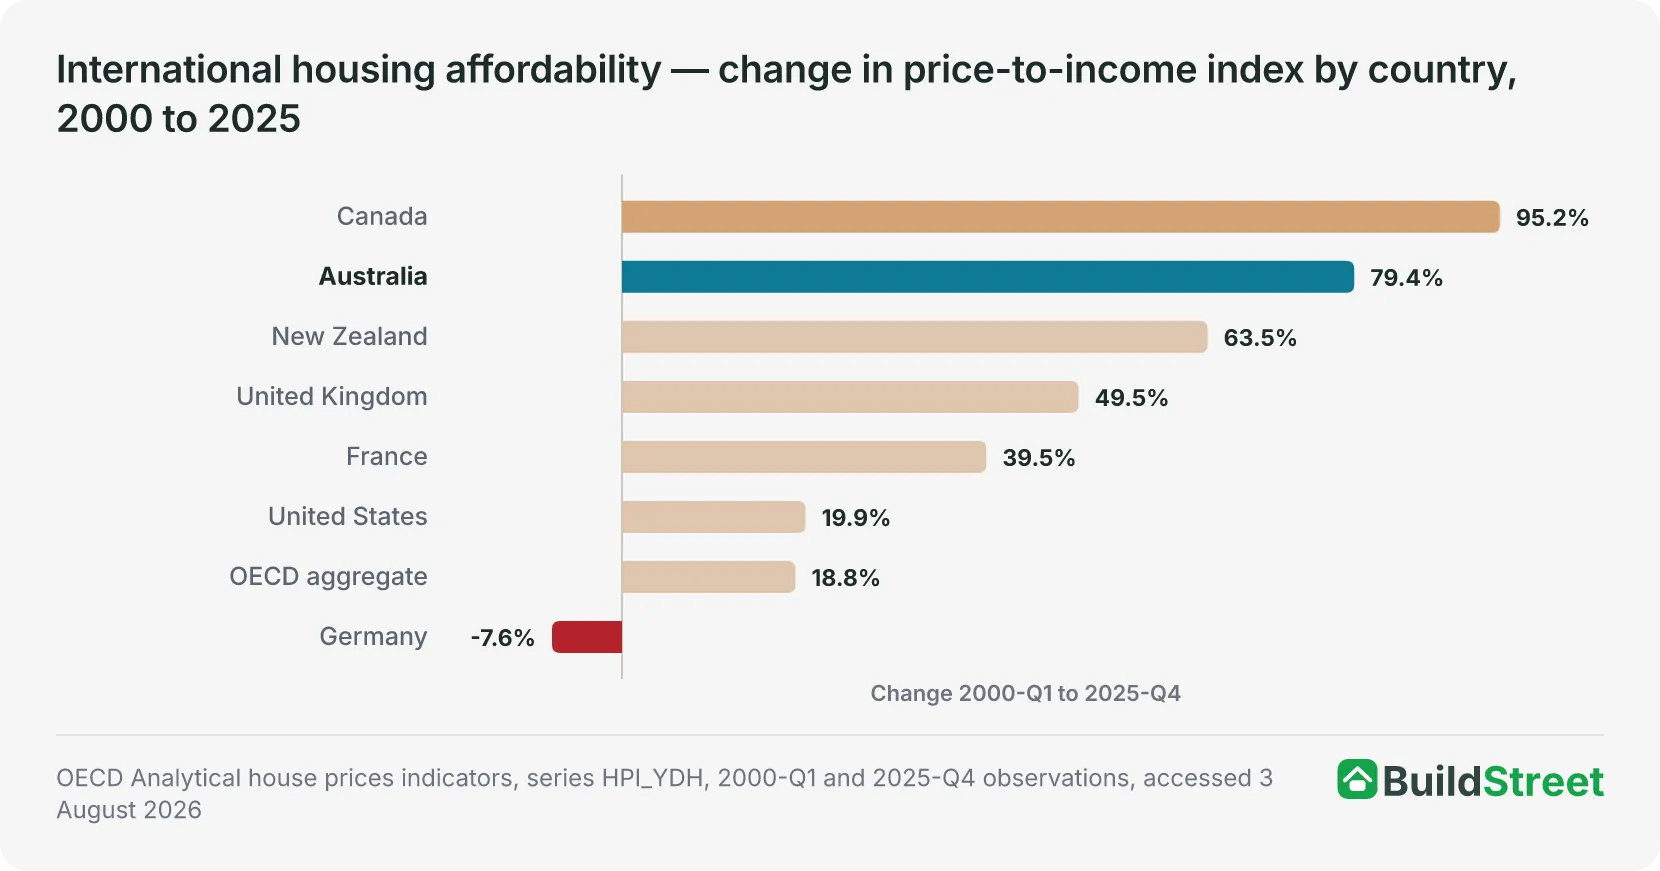
Seven of the eight areas rose over the period. Germany fell 7.6%, starting at 116.4 in the March quarter of 2000, above its own long-run average, and declining through the 2000s.
A full-period figure can hide reversals within the period. Three examples show this:
- New Zealand's index peaked at 142.9 in the December quarter of 2021 and fell to 101.3 by the December quarter of 2025.
- France's fell from 100.6 in the March quarter of 2015 to 93.8 in the December quarter of 2025.
- Australia's fell from 119.4 in the March quarter of 2022 to 113.9 in the December quarter of 2022, then rose again.
Index change above Australia's
- Canada
+95.2%
- Australia, for reference
+79.4%
Index change below Australia's
- New Zealand
+63.5%
- United Kingdom
+49.5%
- France
+39.5%
- United States
+19.9%
- OECD aggregate
+18.8%
- Germany
−7.6%
Source · OECD Analytical house prices indicators, series HPI_YDH, accessed 3 August 2026. All changes cover 2000-Q1 to 2025-Q4, the latest quarter common to all eight series.
Australia's index rose 17.6% between the December quarter of 2019 and the December quarter of 2025, the largest increase of the eight areas over that window. The United States rose 16.9%, the OECD aggregate 7.5%, and Canada 6.3%.
Four of the eight fell over the same six years:
- United Kingdom, down 0.6%
- New Zealand, down 6.5%
- Germany, down 7.9%
- France, down 8.5%
Canada led the full period since 2000 and Australia led the six years to the December quarter of 2025, so the two windows order the same areas differently.
Section 06 · Comparison limits
Why international housing affordability comparisons have limitations
Three of the seven national house price series feeding the price-to-income index depart from the common pattern of pricing all dwelling sales across the country. Australia values the entire dwelling stock rather than transactions, the United States prices existing single-family sales only, and Canada's series covers just 11 cities rather than the whole country.
| Coverage of the national house price series underlying the OECD price-to-income index, in Australia and six comparable economies, as at August 2026 | |||
|---|---|---|---|
| Country | Geographic coverage | What is priced | Seasonal adjustment |
| Australia | Whole country | Total stock of new and existing dwellings, all types | By the OECD, X-12 ARIMA |
| Canada | Urban areas, 11 main cities | Sales of existing dwellings, all types | By the OECD, X-12 ARIMA |
| United States | Whole country | Sales of existing dwellings, single-family only | By the source |
| United Kingdom | Whole country | Sales of new and existing dwellings, all types | By the OECD, X-12 ARIMA |
| France | Whole country | Sales of new and existing dwellings, all types | By the source |
| Germany | Whole country | Sales of new and existing dwellings, all types | By the OECD, X-12 ARIMA |
| New Zealand | Whole country | Sales of new and existing dwellings, all types | By the OECD, X-12 ARIMA |
Source · OECD Analytical house prices indicators, series metadata, accessed 3 August 2026.
The three differences are:
- Australia values the total stock of dwellings rather than transactions.
- The United States prices sales of existing single-family dwellings only.
- Canada covers 11 main cities rather than the whole country.
The remaining four series cover sales of new and existing dwellings across the whole country. Seasonal adjustment also differs. Five of the seven series are adjusted using the same method, while the United States and France are adjusted nationally before their figures are included in the OECD index.
The price-to-income measure excludes household borrowing costs entirely, according to the OECD.
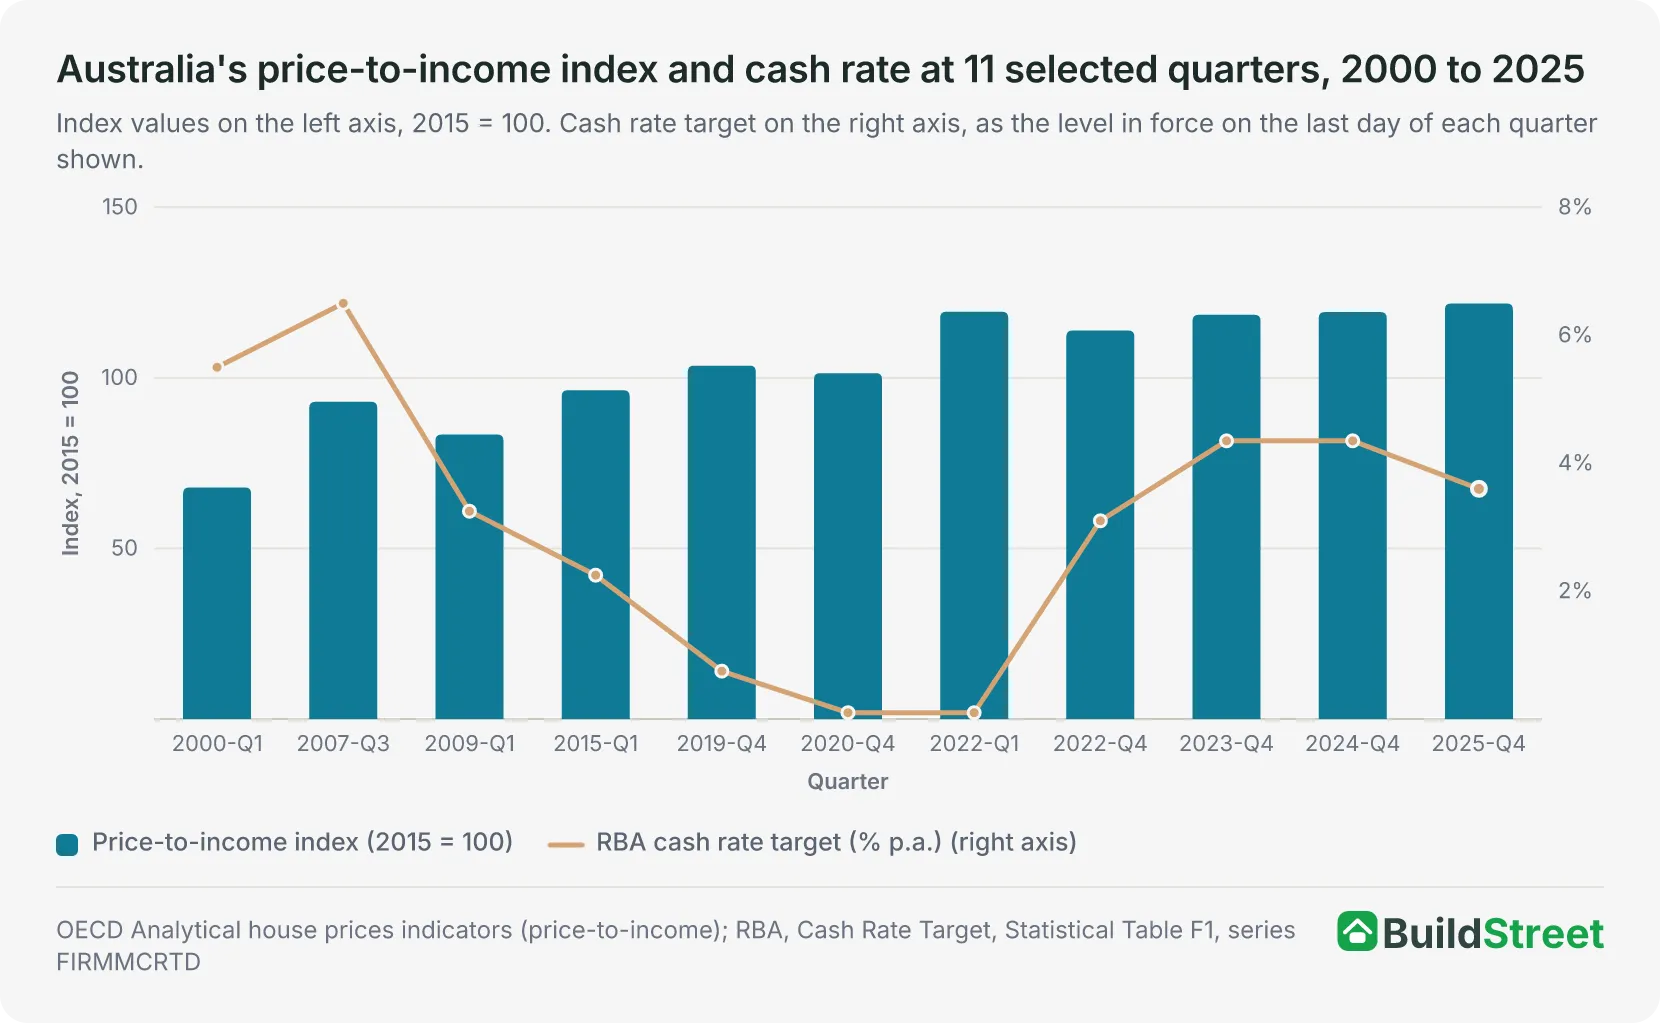
Australia's index rose 5.1% between the December quarter of 2021 and the March quarter of 2026, its latest available quarter. The RBA cash rate target rose 4.25 percentage points between 31 December 2021 and 17 June 2026, from 0.10% to 4.35%. The price-to-income index measures changes in house prices relative to disposable income per head, not changes in borrowing costs.
The average rate on outstanding owner-occupier housing loans was 6.20% in May 2026, the latest month in the RBA's Table F6, and 6.22% on new owner-occupier loans funded that month. The RBA describes these rates as indicative and subject to revision. The series begins in July 2019, so no official equivalent measure extends back to 2000.
The same ABS survey reports two different housing-cost-to-income ratios for 2019–20: 14% under the published definition and 12% under the alternative definition.
Income definitions differ between the two sources. The ABS ratios use gross household income without adjustment for household size. The OECD burdens use disposable income, equivalised by the square root of household size. The two are not interchangeable, which is why the ABS city figures and the OECD country figures appear in separate sections.
The ABS counts Rent Assistance as income and does not offset it from housing costs. In 2019-20 it made up 8% of the reported income of households receiving it, on the ABS estimate.
Reference years in the OECD burden data
- New Zealand
2017
- Australia
2021
- Canada, United Kingdom
2022
- United States
2023
- France, Germany
2024
Income concepts in use
- OECD burdens
Equivalised disposable
- United States within OECD
Gross
- United Kingdom within OECD
Net, unadjusted
- ABS ratios
Gross, unequivalised
Outside the scope of these measures
- Borrowing costs
Excluded
- Dwelling quality and size
Not captured
- Distribution of costs
Not in the index
- Outright owners
No separate median shown
Source · OECD Affordable Housing Database, indicators HC1.2 and HC1.5; ABS, Housing Occupancy and Costs methodology, 2019-20.
The OECD workbook published in October 2025 records New Zealand's 2024 price-to-income index at 119.6. The live database accessed in August 2026 averages 109.1 for the same year, a difference of 10.5 index points. Both figures are means of four quarterly observations, so the difference reflects a revision between vintages rather than a difference in calculation.
References
- OECD Analytical house price indicators, dataflow DSD_AN_HOUSE_PRICES (price-to-income, series HPI_YDH and HPI_YDH_AVG) · sdmx.oecd.org
- OECD Affordable Housing Database, indicator HC1.2 Housing costs over income · webfs.oecd.org
- OECD Affordable Housing Database, indicator HC1.5 Overview of affordable housing indicators · webfs.oecd.org
- OECD Affordable Housing Database, indicator HM1.2 Housing prices · webfs.oecd.org
- OECD National and regional house price indices, dataflow DSD_RHPI (Australian CITY series, total dwellings) · sdmx.oecd.org
- ABS Housing Occupancy and Costs, 2019-20 financial year · Australian Bureau of Statistics
- ABS Housing Occupancy and Costs methodology, 2019-20 · Australian Bureau of Statistics
- ABS media statement, Survey of Income and Housing results will not be released · Australian Bureau of Statistics
- ABS Total Value of Dwellings, March quarter 2026 · Australian Bureau of Statistics
- ABS Residential Property Price Indexes: Eight Capital Cities, December quarter 2021 (final issue) · Australian Bureau of Statistics
- RBA Cash Rate Target · Reserve Bank of Australia
- RBA Statistical Table F6 Housing Lending Rates workbook (series FLRHOOTA and FLRHOFTA) · Reserve Bank of Australia
