

Published 6 Aug 2026
Australia completed 6.27 dwellings per 1,000 people in 2025, the lowest rate in 26 years and the seventh consecutive annual decline. That is 173,228 new homes for a population of 27.6 million.
Canada completed 5.65 per 1,000 people in 2022, while the United States completed 4.36 and the United Kingdom completed 2.45 in 2025. Australia still builds more homes for the size of its population than any of the three.
Australian dwelling completions rose 6.7% between 2000 and 2025, while the population rose 45.1%. Australia completed more homes than it did in 2000, but fewer per person, because population growth outpaced the increase in completions.
 Australia's national housing target and how completions are tracking against itWhat the target commits to, which official series measures progress against it, and where the current run rate sits.
 How long it takes to build a house in AustraliaTypical build times by dwelling type, and where the gap between approval and completion opens up.
Section 01 · Australian rate
How many homes does Australia build per 1,000 people?
Australia completed 6.27 dwellings per 1,000 people in 2025. That was down 4.9% from 2024 and 26.5% below the 8.53 recorded in 2000. It was also the lowest reading in the 26 years from 2000 to 2025. The rate has now fallen for seven consecutive years.
Builders completed 173,228 homes in 2025, about 6.7% more than the 162,315 completed in 2000. Output has remained within a fairly narrow band for two decades, while the population has continued to grow. As a result, completions have fallen on a per-capita basis even though the number of completed dwellings has increased.
The measure counts homes that were completed, not approvals and commencements. Completions lag approvals, so the two can move in opposite directions in the same year.
Three of the four countries compared here publish a completion count of their own, each built to its own definition. New Zealand does not publish a directly comparable national completion series, so its figures are presented separately as a labelled proxy.
| How home building is measured in Australia, Canada, the UK, the US and New Zealand, from January to July 2026 | ||
|---|---|---|
| Country | Measure | Scope and limits |
| Australia | Dwelling units completed | All sectors, all building types; quarterly original series summed to calendar years |
| Canada | Dwelling units completed | All areas, total units; the national annual series ends at 2022 |
| United Kingdom | Permanent dwellings completed | UK total, rounded to the nearest 10; calendar years 2020 to 2022 are unavailable |
| United States | Housing units completed | Privately owned units only; publicly owned housing is excluded |
| New Zealand | New dwelling units consented | Consents record approval to build, not the completion of a dwelling; used only as a labelled proxy |
Source · ABS Building Activity, Australia, March quarter 2026; ONS UK house building, July 2026; US Census Bureau New Privately-Owned Housing Units Completed; Statistics Canada table 34-10-0126-01; Stats NZ Building consents issued: December 2025; OECD HM1.1 definitions and methodology, April 2024.
Section 02 · Country comparison
How Australia's home building rate compares with Canada, the UK, the US and New Zealand
Australia's home building rate was higher than Canada's, the United States' and the United Kingdom's on the latest available figures. The gap was narrowest with Canada and widest with the United Kingdom.
Australia completed 6.27 dwellings per 1,000 people in 2025. Canada managed 5.65 in 2022, the United States 4.36 and the United Kingdom 2.45. Based on these latest available figures, Australia's rate was 11% higher than Canada's, 44% higher than the United States' and about 156% higher than the United Kingdom's.
New Zealand recorded a higher rate of 6.88 consents per 1,000 people, but this measures dwelling consents rather than completions and is not directly comparable with the other four countries. Stats NZ publishes a rate of 6.9 per 1,000 residents; the small difference reflects the use of a different population estimate.
Canada's national series stops at 2022, so its figure is three years older than the 2025 readings for the other four countries. The comparison uses each country's latest available figure rather than a common reference year.
In 2022, Australia completed 6.68 per 1,000 people to Canada's 5.65, a difference of 1.03. Measured against Canada's 2022 rate, Australia's 2025 rate of 6.27 leaves a smaller gap of 0.62. The matched 2022 comparison therefore shows a wider difference between the two countries.
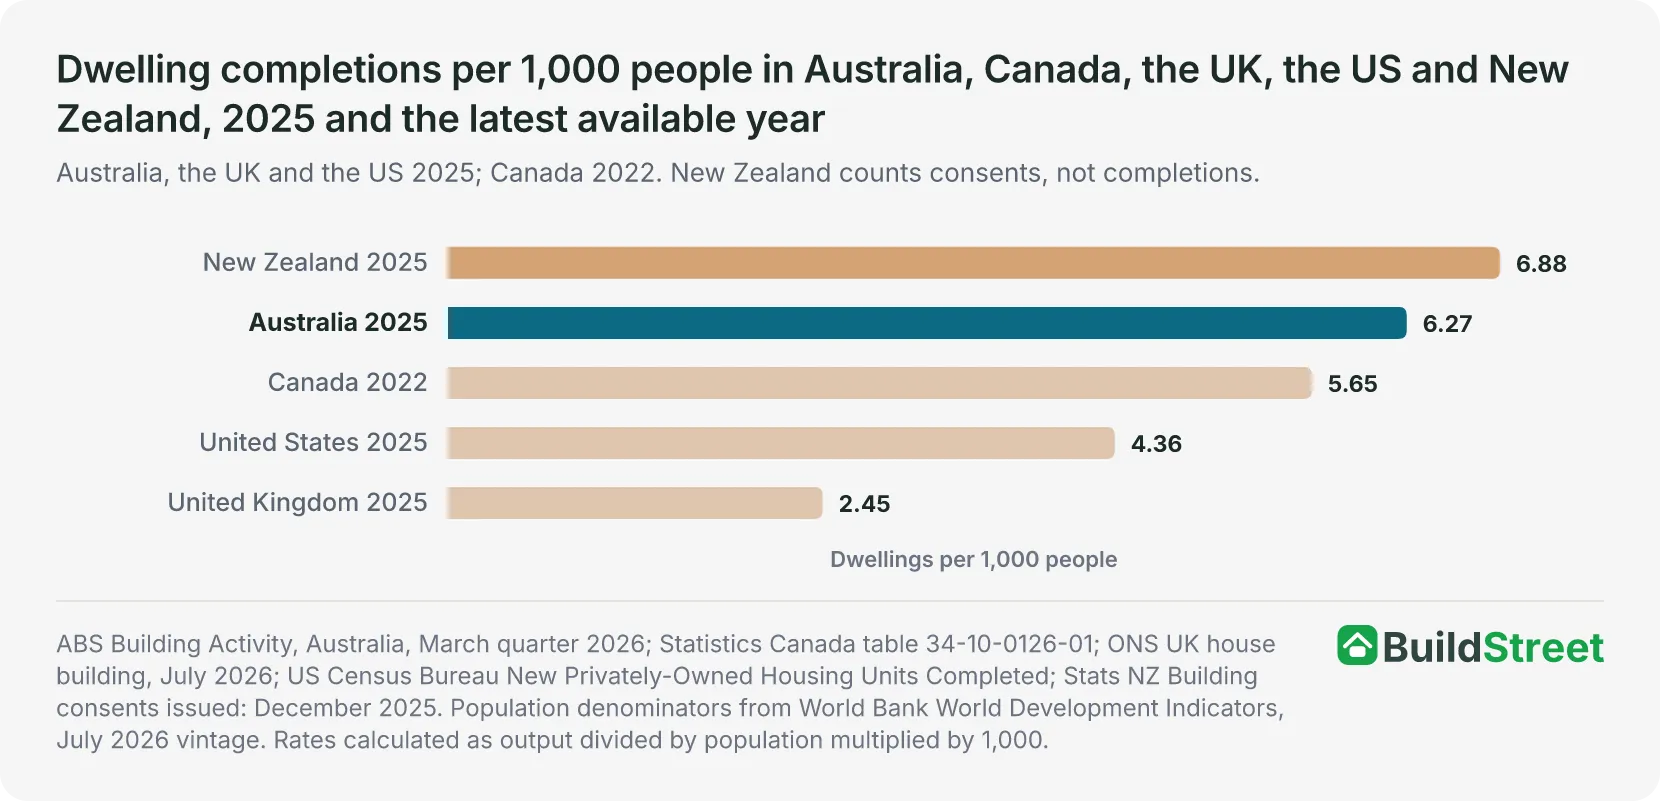
Australia and the United Kingdom recorded similar dwelling totals in 2025, yet sit at opposite ends of the completion-rate range at 6.27 and 2.45. The difference reflects the United Kingdom's larger population and shows why total output and per-capita rates can produce different comparisons.
| Housing output and output per 1,000 people in Australia, Canada, the UK, the US and New Zealand, 2025 and latest available year | ||||
|---|---|---|---|---|
| Country | Year | Housing output | Population | Per 1,000 people |
| Australia | 2025 | 173,228 | 27,614,411 | 6.27 |
| New Zealand (consents) | 2025 | 36,619 | 5,324,700 | 6.88 |
| Canada | 2022 | 219,942 | 38,950,132 | 5.65 |
| United States | 2025 | 1,488,500 | 341,784,857 | 4.36 |
| United Kingdom | 2025 | 170,390 | 69,487,000 | 2.45 |
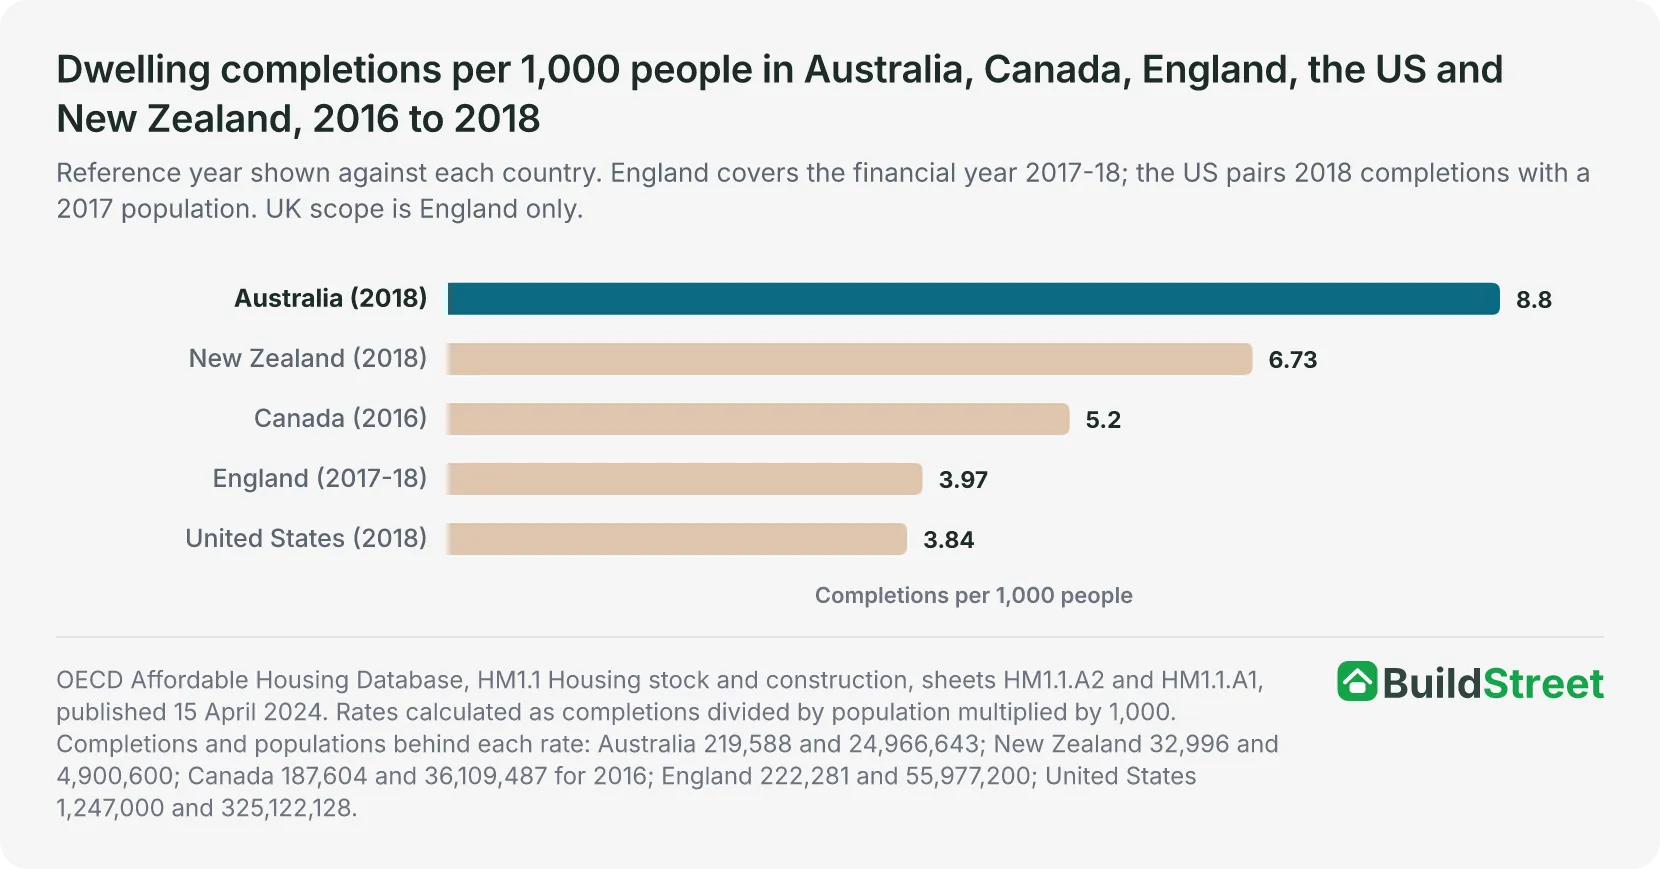
The Organisation for Economic Co-operation and Development's (OECD) historical comparison, which uses dwelling completions for all five countries, shows Australia at 8.80 completions per 1,000 people and the United States at 3.84. Australia's rate was 4.96 higher and about 2.3 times the US rate.
The OECD comparison is centred on reference years from 2016 to 2018 and mixes reference periods and geographic coverage. It provides a historical benchmark rather than a current, like-for-like ranking.
Section 03 · OECD ranking
How Australia ranks among OECD countries for home building
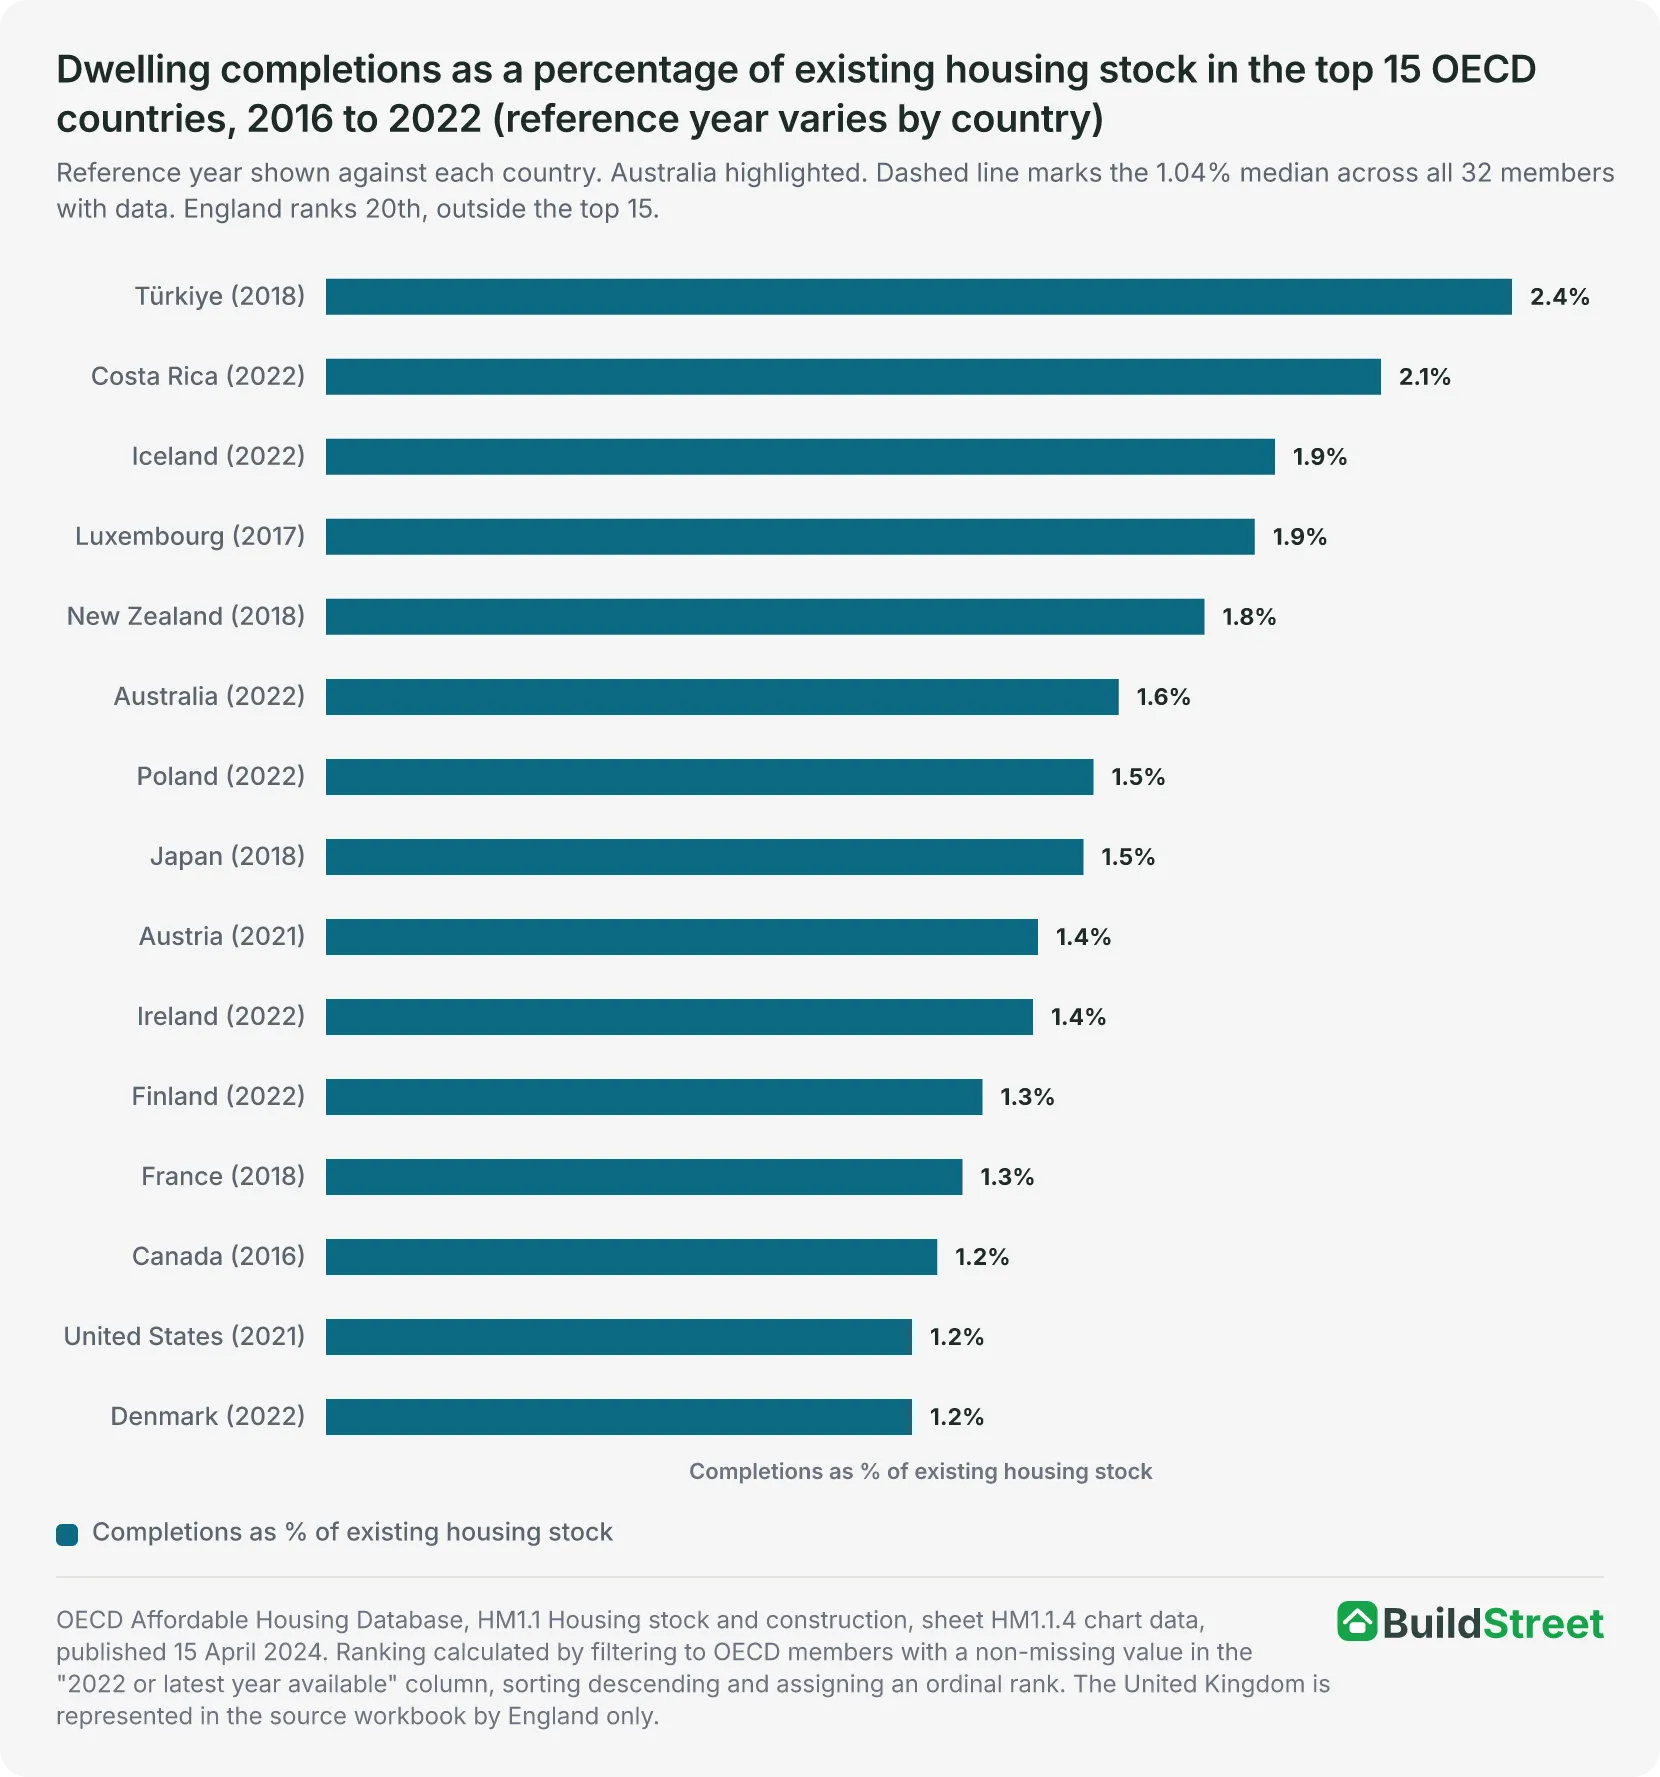
Australia ranked sixth of the 32 OECD members with available data, building the equivalent of 1.58% of its existing housing stock in 2022. That was 0.54 percentage points above the 1.04% median, or about 52% higher, but down from 1.71% and second place around 2011. This is not a same-year ranking: reference years run from 2016 to 2022, and the United Kingdom is represented as England only.
Eighteen of the 32 members recorded a share of at least 1%. Türkiye, Costa Rica, Iceland, Luxembourg and New Zealand recorded the five highest rates, with the first four exceeding 1.8%. Australia's 1.58% puts it in the upper quarter, behind Türkiye, Costa Rica, Iceland, Luxembourg and New Zealand.
This measure sets one year of completions against the housing already standing rather than against the population. Countries with larger existing housing stocks may therefore record lower percentages even when they complete a similar number of homes per person.
Among the five comparison countries, New Zealand ranked 5th at 1.75% for the 2018 reference year, Australia 6th at 1.58% for 2022, Canada 13th at 1.22% for 2016, the United States 14th at 1.17% for 2021, and England 20th at 0.93% for 2021-22.
Those reference years span six calendar years, so the ranking reflects differences in timing as well as differences in housing construction.
Australia's share fell from 1.71% around 2011 to 1.58% in the latest observation, a decline of 0.13 percentage points. Its ranking moved from second among 31 members to sixth among 32 members.
Eight of the 31 OECD members with observations in both periods recorded a decline. They were Australia, Japan, France, Chile, Switzerland, Slovenia, Spain and Portugal. The remaining 23 recorded an increase.
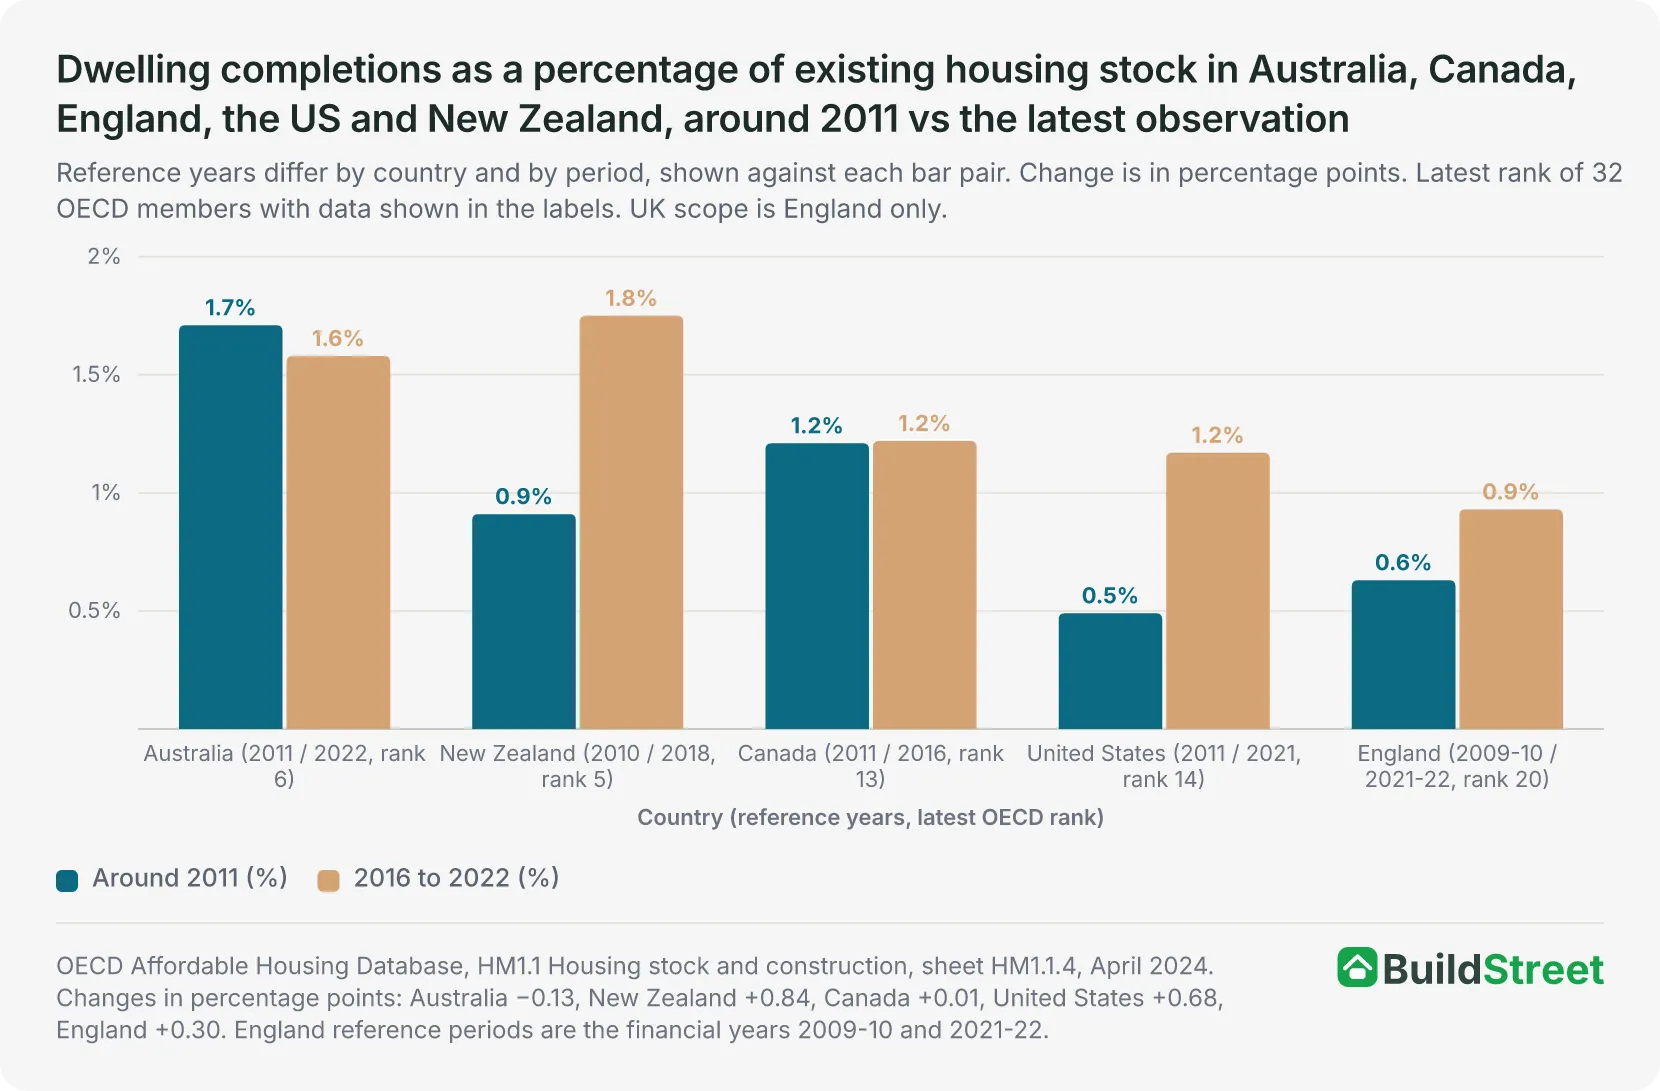
Because reference years differ between and within the two columns, the comparison indicates a direction of travel rather than a measured change over a fixed period. The OECD identifies this as a limitation of the dataset.
Section 04 · Per-capita vs totals
How per-capita building rates differ from total dwelling numbers
Australia and the United Kingdom completed almost the same number of homes in 2025, 173,228 and 170,390 respectively. However, the UK population of 69.5 million is 2.52 times Australia's 27.6 million. Total dwelling numbers are therefore strongly influenced by population size.
Divided by population, those near-identical totals become 6.27 completions per 1,000 people in Australia and 2.45 in the United Kingdom. The total figures show similar levels of output, while the per-capita rates show that Australia completed about 2.5 times as many dwellings per person.
The United States completed 1,488,500 homes in 2025, more than eight times Australia's total. However, its rate was 4.36 per 1,000 people, below Australia's rate. The United States had the largest total output of the countries compared, but a lower per-capita rate than Australia.
Source: ABS Building Activity, Australia, March quarter 2026; ONS UK house building, July 2026; US Census Bureau New Privately-Owned Housing Units Completed. Population denominators from World Bank World Development Indicators, July 2026 vintage. UK completions are provisional; US completions cover privately owned units only.
Dividing dwelling completions by population reduces the effect of differences in country size, but the rate does not account for:
- household formation, so a country where household sizes are shrinking needs more homes per person than one where they are not
- vacancy rates and second homes
- dwelling size, quality, type, location and tenure
- homes demolished or otherwise removed from the housing stock.
The rate also does not show how many homes a country already has.
Australia had the highest annual dwelling completion rate among the four countries with completion data, but ranked fourth among the five countries for existing housing stock per person. Annual completions are one year's output; the stock is everything already standing, so changes in the annual completion rate affect the stock gradually.
Reference years vary by country. England, the United States and Canada use 2021 figures, while Australia and New Zealand use 2022 figures. The UK figure covers England rather than the whole United Kingdom.
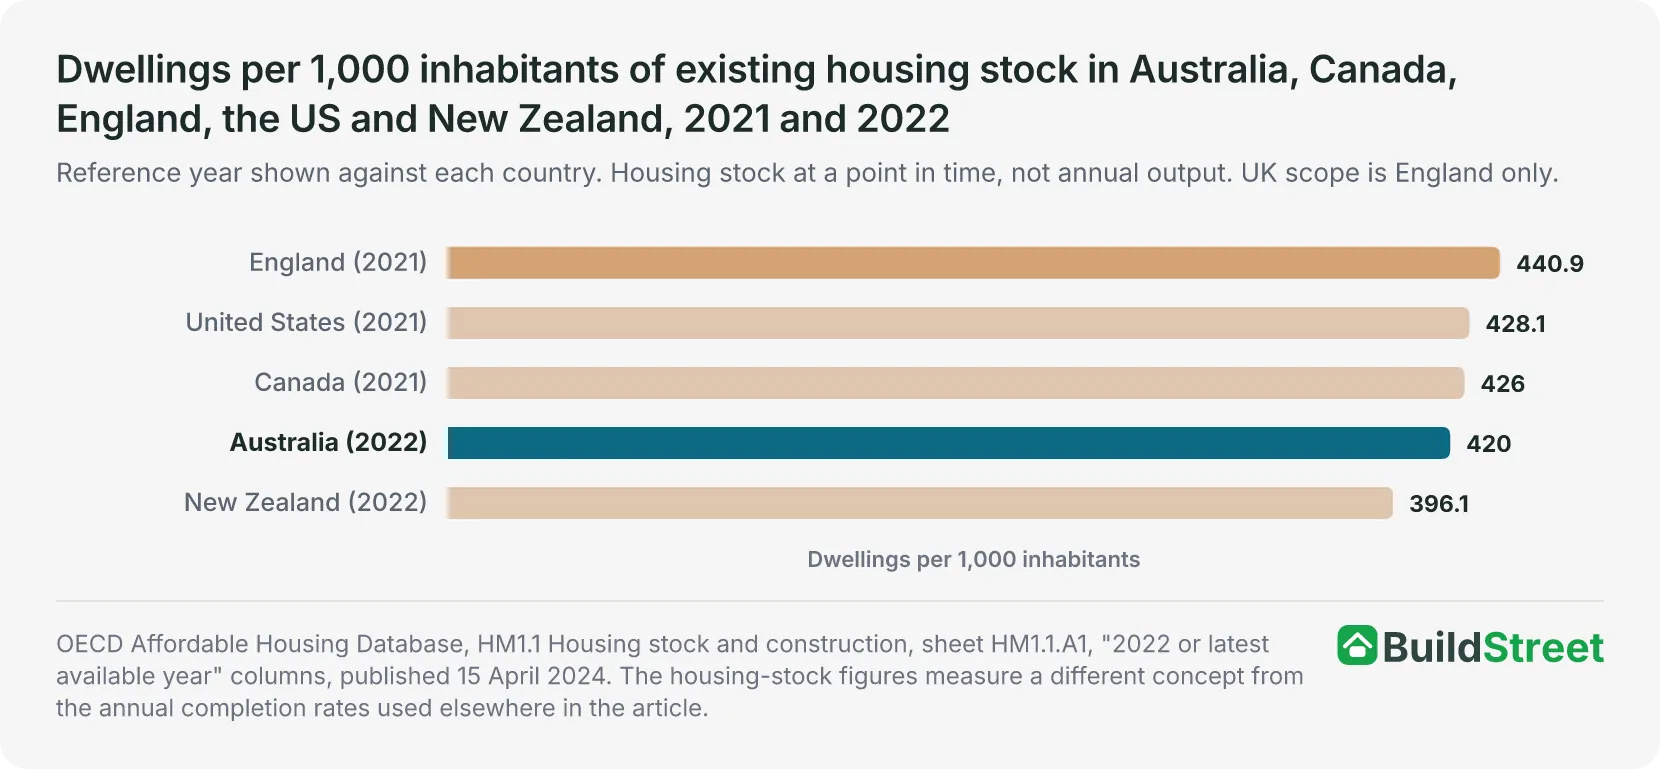
England recorded 440.9 dwellings per 1,000 inhabitants, compared with 396.1 in New Zealand, a difference of 44.8. Australia's rate was 20.9 dwellings per 1,000 inhabitants below England's. These are differences between ratios measured in different reference years, not changes over time.
Housing stock figures also count every dwelling regardless of whether they are:
- occupied or vacant
- habitable
- located where housing demand is concentrated;
- the size and type sought by households
Section 05 · Population growth
How home building rates compare with population growth across countries
Australia's average completion rate of 7.41 per 1,000 people was the highest among the four countries with completion data. Its average population growth rate of 1.50% was also the highest among all five countries. Australia's completion rate was also above New Zealand's average consent rate of 6.16 per 1,000 people.
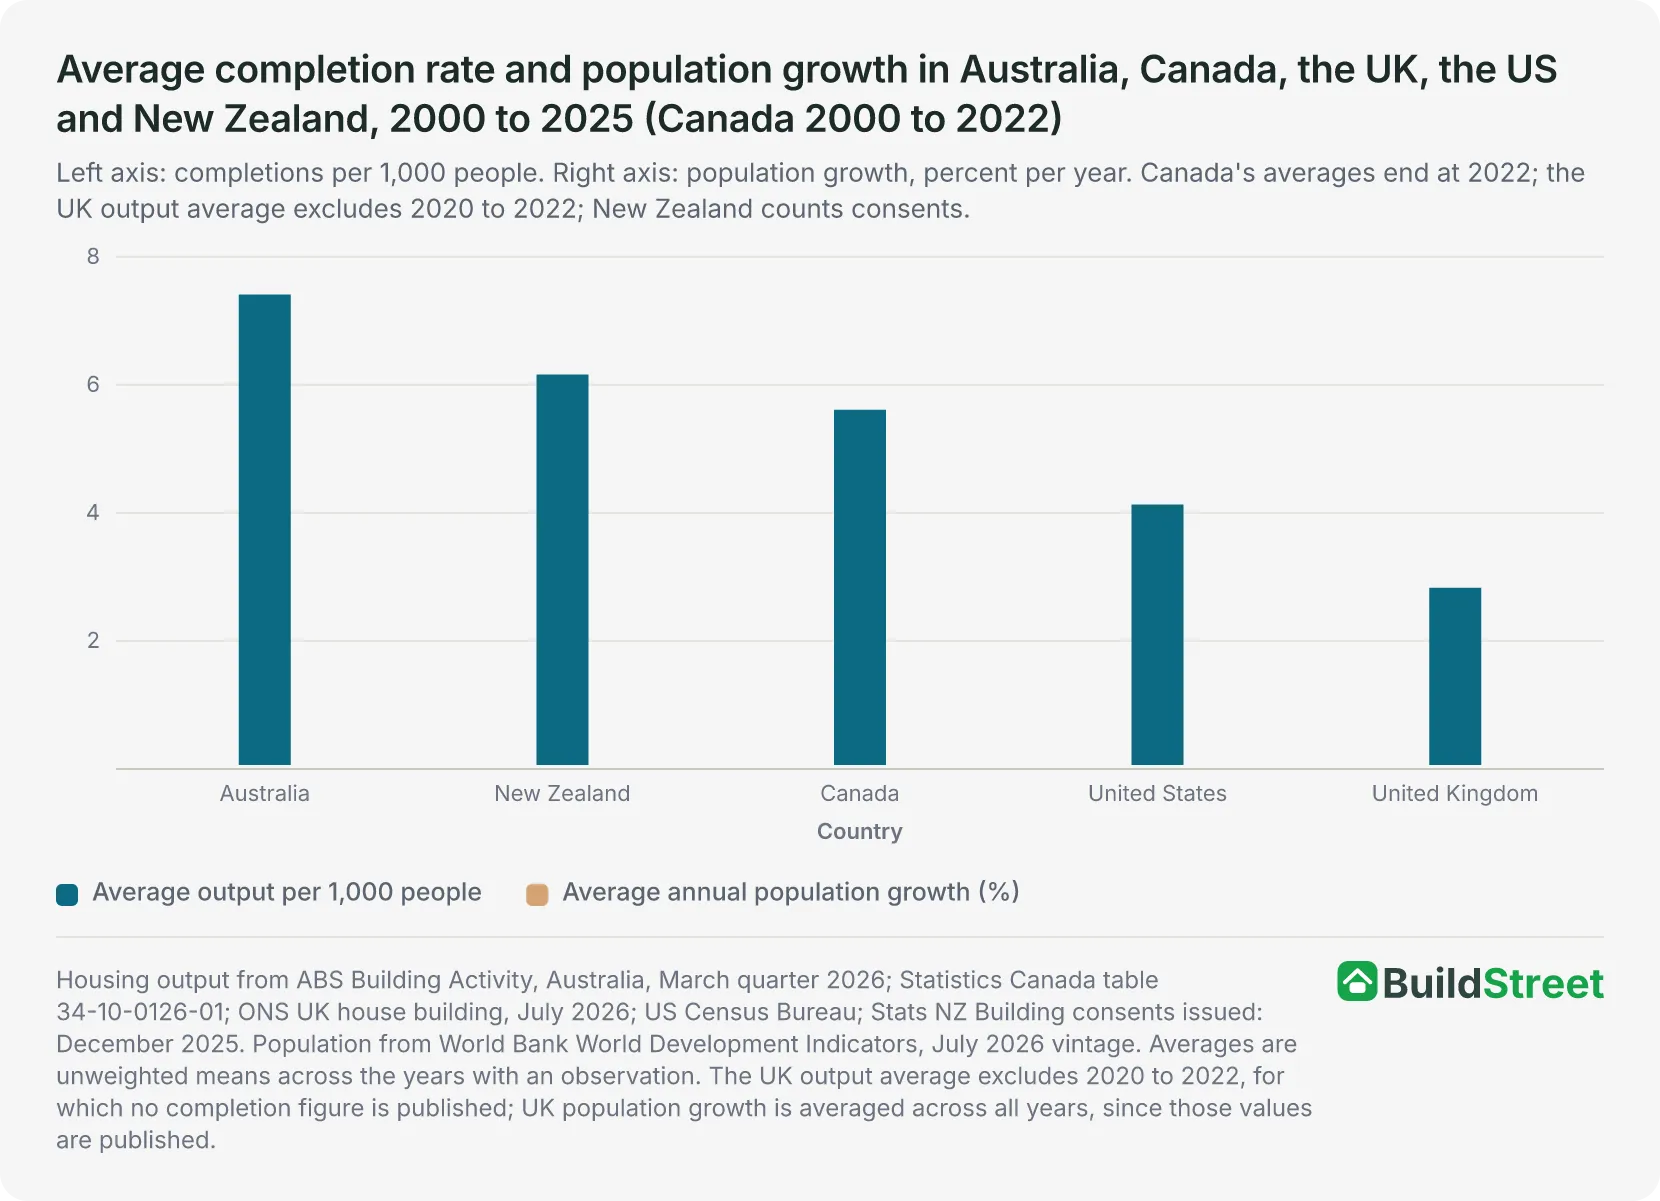
The countries appear in the same order on both measures: those with higher average population growth also recorded higher average housing output per person. This is a pattern in the data rather than evidence that one measure caused the other.
| Average housing output rate and population growth in Australia, Canada, the UK, the US and New Zealand, 2000 to 2025 | ||||
|---|---|---|---|---|
| Country | Average output per 1,000 | Average population growth (%) | Growth 2024 to 2025 (%) | Period covered |
| Australia | 7.41 | 1.50 | 1.54 | 2000 to 2025 |
| New Zealand | 6.16 | 1.30 | 0.66 | 2000 to 2025 (consents) |
| Canada | 5.61 | 1.09 | 0.94 | 2000 to 2022 |
| United States | 4.13 | 0.77 | 0.52 | 2000 to 2025 |
| United Kingdom | 2.83 | 0.66 | 0.30 | 2000 to 2025; output excl. 2020 to 2022 |
A completion rate measures annual housing output relative to the population, while population growth measures the annual change in that population. A country can hold its building rate perfectly steady and still fall behind if its population starts growing faster.
Population growth is also not the same as housing need. It does not show how households are formed, where population growth occurs or how much existing housing is vacant. Changes in household size can also affect the number of dwellings required independently of headline population growth.
Section 06 · Trend since 2000
How has Australia's building rate changed since 2000?
Australia's dwelling completion rate fell from 8.53 per 1,000 people in 2000 to 6.27 in 2025, a decline of 26.5%. This was the steepest fall of the four countries with a completion series. The United States fell 21.9% and the United Kingdom fell about 18.3%, while Canada rose 18.8%. Australia nevertheless recorded the highest completion rate among the four countries in every year for which comparable observations were available.
Australian dwelling completions increased by 6.7% over those 25 years, from 162,315 to 173,228, while the population rose 45.1%, from 19.0 million to 27.6 million. Because population growth was substantially faster than the increase in completions, the completion rate per 1,000 people declined.
The rate reached 8.83 per 1,000 people in 2016, the highest reading in the period analysed. It then fell in eight of the following nine years to 6.27 in 2025, a decline of 29.0% from the 2016 peak. The most recent annual increase occurred in 2018.
This analysis starts at 2000. The underlying ABS series runs from September 1980, so earlier years sit outside the comparison rather than being unavailable.
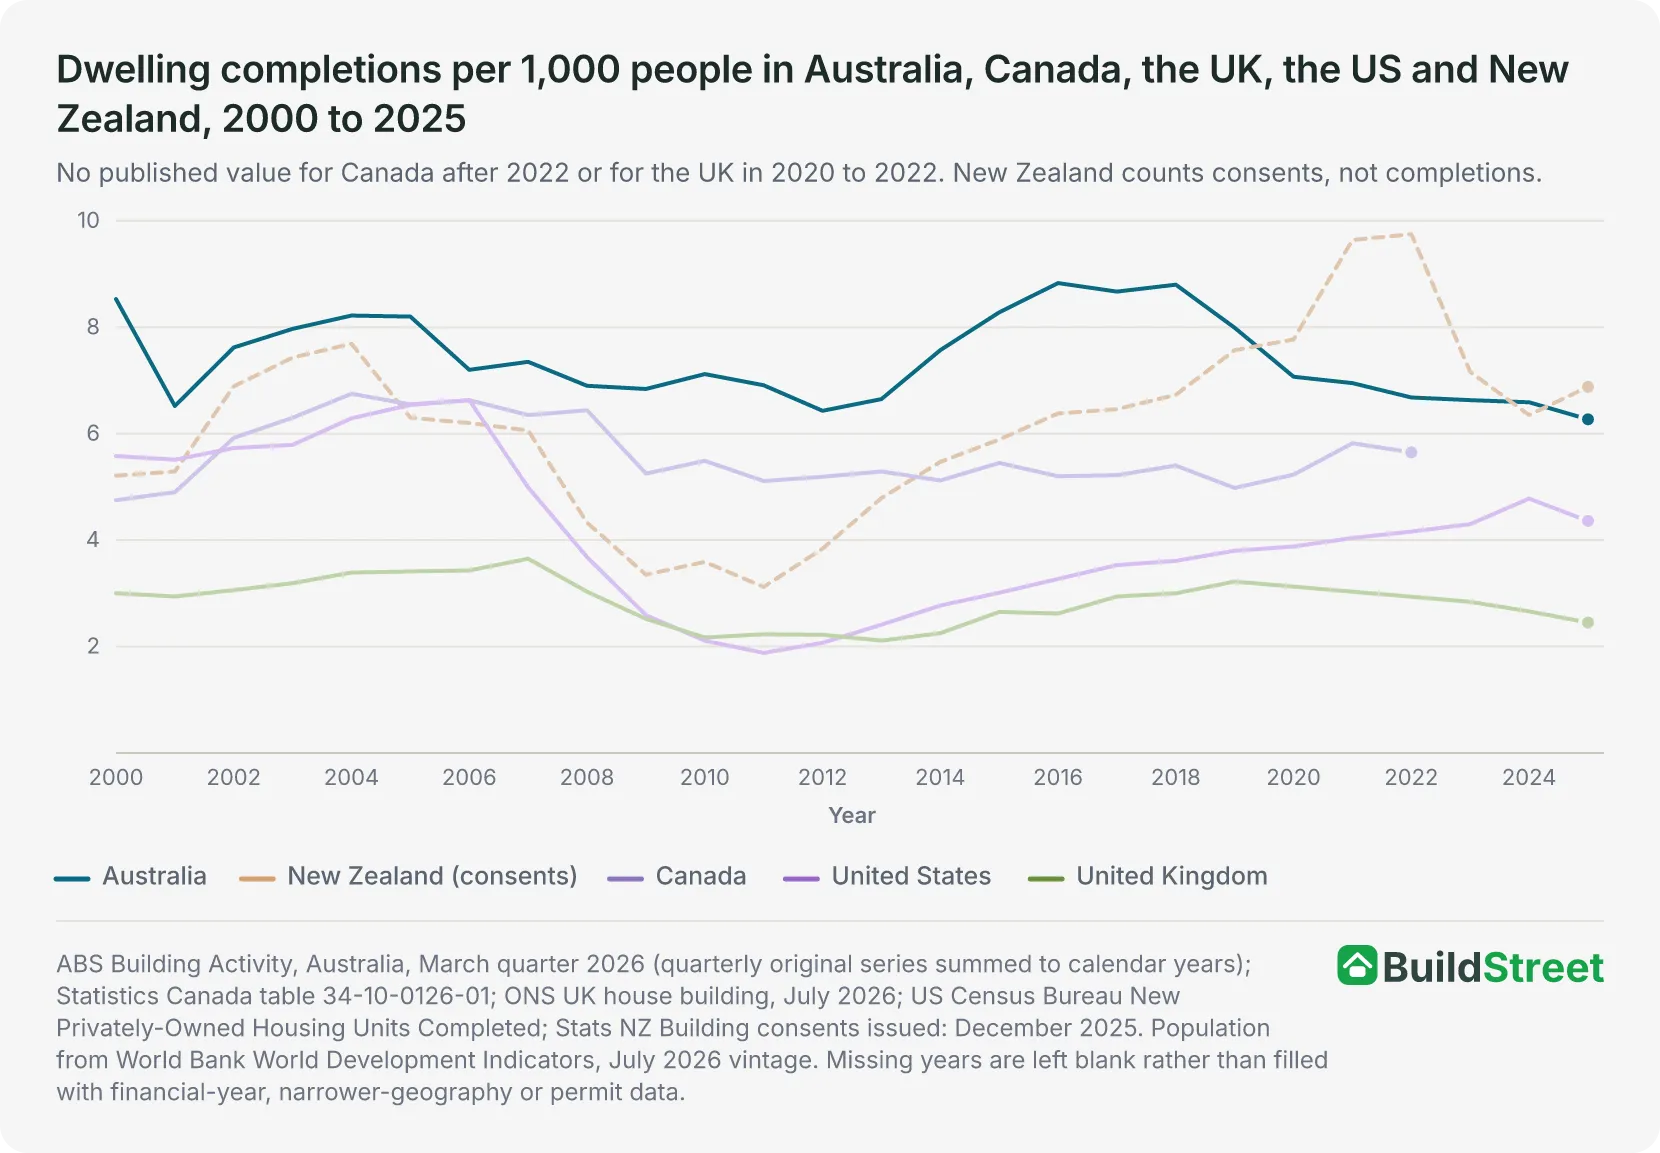
Australia recorded the highest rate among the four completion countries in every year for which comparable observations were available.
The United States recorded greater variation within the period than between the start and end points. Its rate fell from 6.63 per 1,000 people in 2006 to 1.88 in 2011 before recovering to 4.36 in 2025. The 2025 rate remained 21.9% below its 2000 level. The United Kingdom declined more gradually, from 3.00 in 2000 to 2.45 in 2025, a fall of about 18.3%.
Canada was the only completion country to record a higher rate at the end of its available series than in 2000. Its rate increased by 18.8% to 5.65 in 2022. The Canadian comparison covers 22 years rather than 25 because no later national figure is published.
New Zealand's consent rate increased by 32.1%, but consents and completions are different measures, and the two changes are not comparable.
| Housing output per 1,000 people in Australia, Canada, the UK, the US and New Zealand, 2000 compared with 2025 (Canada 2022) | ||||
|---|---|---|---|---|
| Country | 2000 | Latest year | Change (%) | Note |
| Australia | 8.53 | 6.27 (2025) | −26.5 | Lowest value in the period analysed |
| Canada | 4.75 | 5.65 (2022) | +18.8 | 22-year change; series ends 2022 |
| United Kingdom | 3.00 | 2.45 (2025) | −18.3 | 2020 to 2022 unavailable; 2025 provisional |
| United States | 5.58 | 4.36 (2025) | −21.9 | Privately owned units only |
| New Zealand | 5.21 | 6.88 (2025) | +32.1 | Consents, not completions |
Of the three countries finishing below their 2000 rate, Australia's fall is the steepest, and it is the only one left sitting at its lowest value in the 26 years covered here.
References
- ABS, Building Activity, Australia (latest release, Cat. 8752.0) · Australian Bureau of Statistics
- ONS: UK house building, permanent dwellings started and completed, July 2026 release · ons.gov.uk
- US Census Bureau: New Privately-Owned Housing Units Completed, historical time series · census.gov
- Statistics Canada: Table 34-10-0126-01, housing completions, all areas, annual · www150.statcan.gc.ca
- Statistics Canada: Table 34-10-0143-01, completions in centres of 10,000 and over, monthly · www150.statcan.gc.ca
- Stats NZ: Building consents issued, December 2025 (February 2026 release) · stats.govt.nz
- OECD Affordable Housing Database — HM1.1 Housing stock and construction (April 2024) · oecd.org
- World Bank: World Development Indicators, Population, total (SP.POP.TOTL) · data.worldbank.org
