

Published
 Living in Poland, Portugal, Greece and Spain: cost of living, housing and residency rules for AustraliansGreece had the largest estimated population born in Australia among Poland, Portugal and Greece, at 21,915 people at mid-2024, according to United Nations Department of Economic and Social Affairs (UN…
 Australians retiring in Southeast Asia: Thailand, Malaysia, Vietnam, the Philippines and IndonesiaEight Southeast Asian countries had an estimated 24,589 migrants from Australia in July 2024, according to the United Nations Department of Economic and Social Affairs (UN DESA). Singapore accounted f…
Section 01 · The surveys
How is household spending measured in Australia, Malaysia, Thailand and Poland?
Australia, Malaysia, Thailand and Poland each measure household spending through national surveys that record how much households spend on goods and services over a year1.
The Australian Bureau of Statistics (ABS) surveyed 10,046 households from July 2015 to June 20161. Thailand's National Statistical Office (NSO) surveyed 51,055 households in 20242, while Statistics Poland surveyed 28,380 households in 20253. Malaysia's Department of Statistics (DOSM) surveyed 57,959 households in 20244.
The ABS, the NSO and Statistics Poland group household spending into categories using an international classification system. Malaysia uses 13 main spending categories, with restaurants and accommodation recorded separately from food56.
Average monthly household consumption spending was equivalent to A$1,843 in Malaysia in 2024, A$829 in Thailand in 2024 and about A$1,916 in Poland in 2025 at World Bank annual average exchange rates, compared with $6,673 in Australia in 2015-1657. The Australian amount is in 2015-16 dollars and has not been adjusted for price changes since the survey.
| Average monthly household consumption spending by country, 2015-16 to 2025 | ||||
|---|---|---|---|---|
| Country | Survey and period | Households surveyed | Local currency | Australian dollars |
| Australia | ABS Household Expenditure Survey, 2015-16 | 10,0461 | $6,673 | $6,673 |
| Malaysia | DOSM Household Expenditure Survey, 2024 | 57,959 | RM5,5666 | $1,843 |
| Thailand | NSO Household Socio-Economic Survey, 2024 | 51,0552 | 19,319 baht | $829 |
| Poland | Statistics Poland Household Budget Survey, 2025 | 28,380 | PLN 4,643 | $1,916 |
Source · ABS Household Expenditure Survey 2015-16; DOSM Household Expenditure Survey Report 2024 and Household Income Survey Report 2024; NSO Thailand, 2024 Household Socio-Economic Survey; Statistics Poland, Household Budget Survey 2025; World Bank, World Development Indicators.
Housing costs are measured differently across countries
The four surveys do not treat housing the same way. The ABS and DOSM include estimated rental costs for owner-occupied homes65. Thailand's NSO also includes them, along with goods and services households receive instead of money2. Poland does not include estimated rent for owner-occupied homes3.
This means housing spending cannot be directly compared across the four countries.
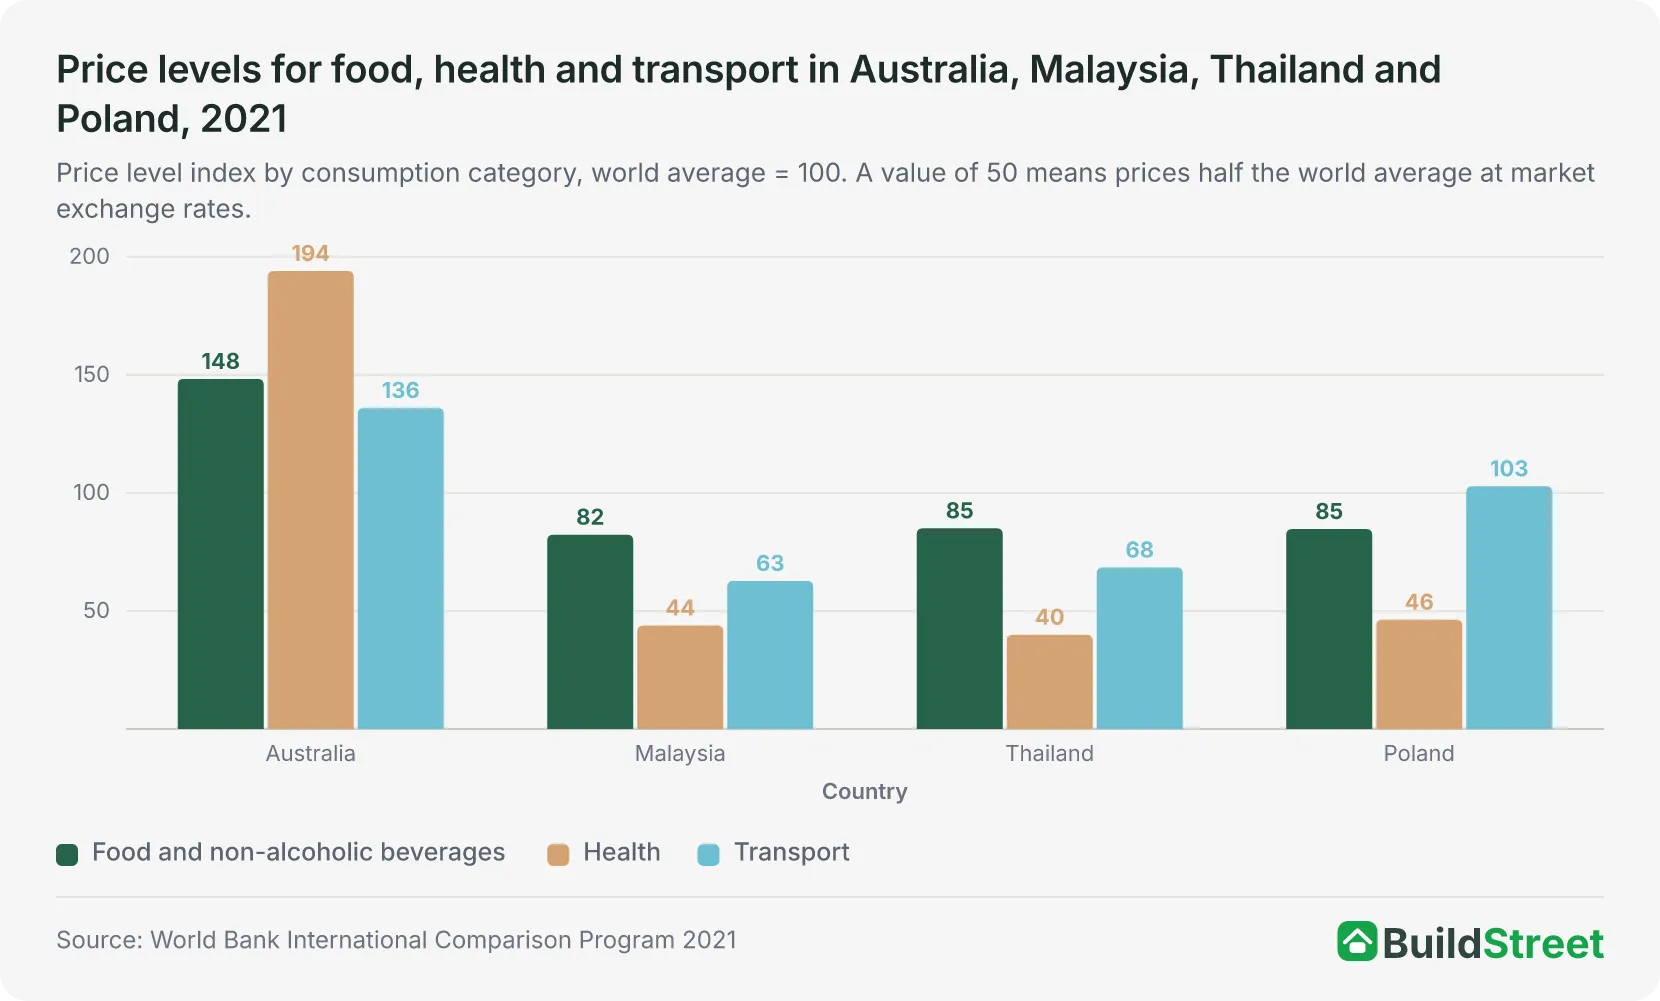
Australia had a price level index of 148 for food and non-alcoholic beverages in 2021, where the world average is 100, according to the World Bank International Comparison Program, compared with 82 in Malaysia and 85 in both Thailand and Poland8.
Section 02 · Food and groceries
What share of household spending goes on food in Australia, Malaysia, Thailand and Poland?
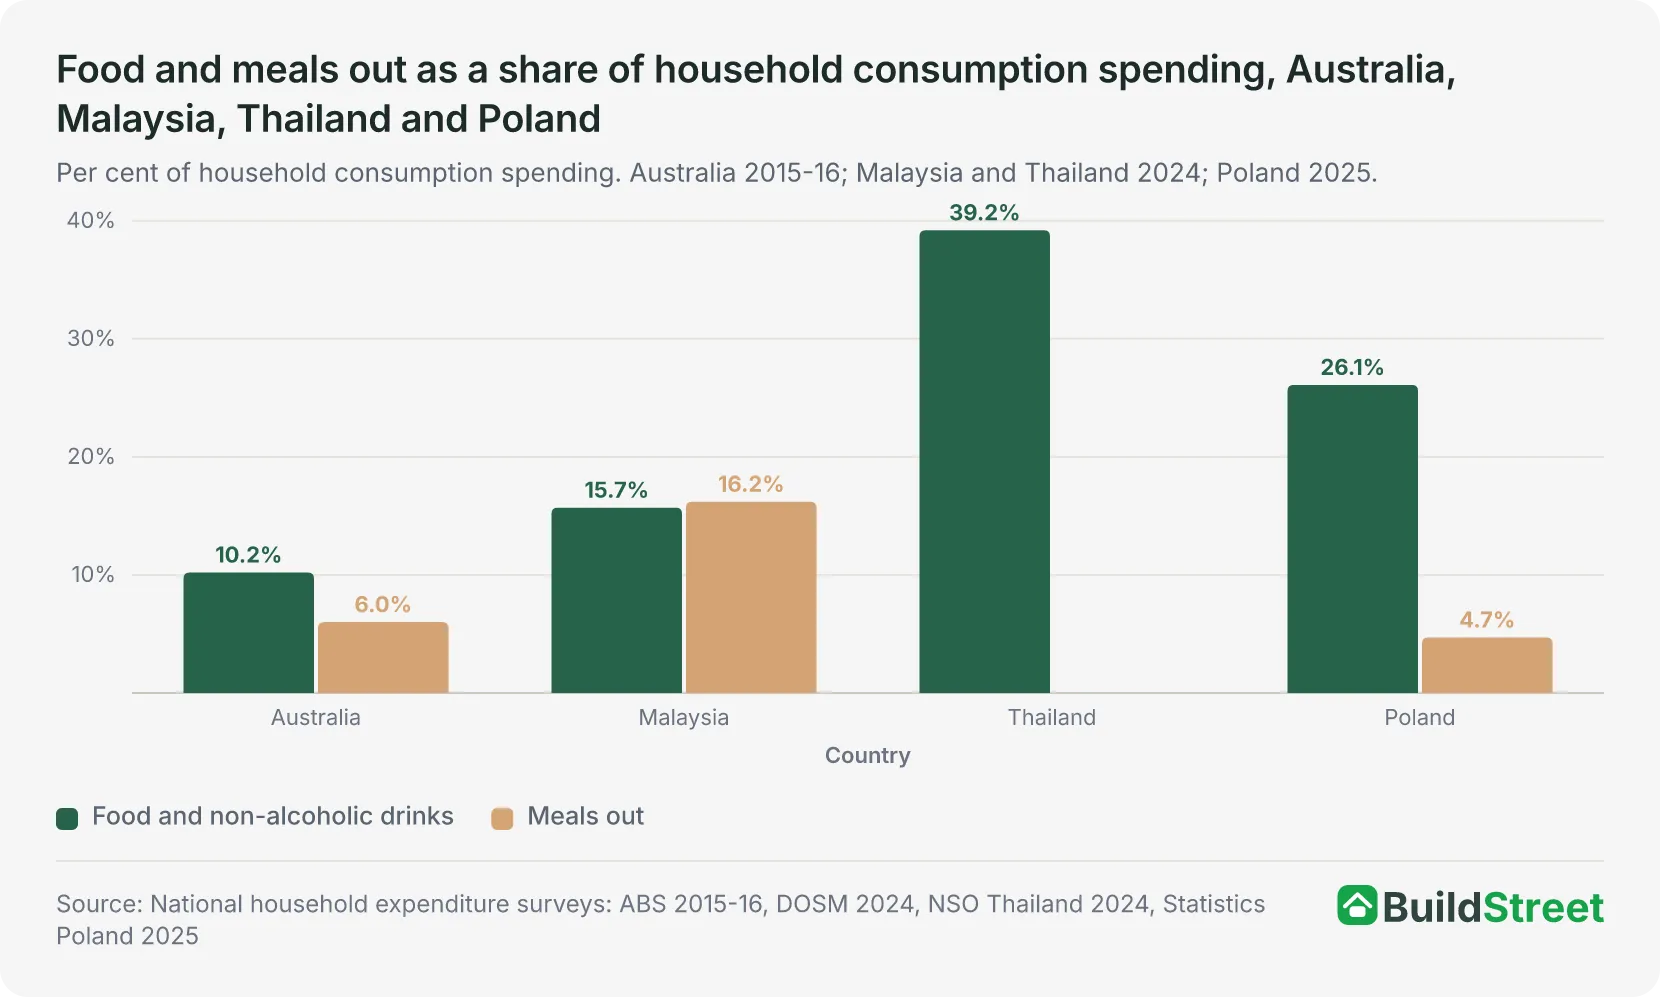
Thailand recorded the highest share of household consumption spending on food at 39.2 per cent in 2024, including meals out, while Australia had the lowest at 10.2 per cent in 2015-1625.
Food and non-alcoholic drinks accounted for 26.1 per cent of Polish spending on consumer goods and services in 2025 and 15.7 per cent of Malaysian consumption spending in 202496.
All four surveys report meals out separately. Spending on meals out accounted for 6.0 per cent of Australian consumption spending in 2015-16 and 4.7 per cent of Polish spending on consumer goods and services in 202559. Malaysian households spent 16.2 per cent of consumption spending on meals out in 2024, more than the 15.7 per cent spent on food and non-alcoholic drinks6.
Thailand counts meals out within its food category, and the NSO also reports them separately: food eaten away from home cost Thai households 1,835 baht a month in 2024, or 9.5 per cent of consumption spending2. Excluding meals out, food and non-alcoholic drinks accounted for 29.7 per cent of Thai consumption spending.
The World Bank's 2021 price level index for restaurants and hotels was 187 in Australia, compared with 30 in Malaysia, 42 in Thailand and 98 in Poland8.
In Australia, food and non-alcoholic drinks accounted for 12.1 per cent of consumption spending for households in the lowest income fifth in 2015-16, compared with 7.9 per cent in the highest income fifth5.
In Poland, the food share of total expenditure ranged from 21.8 per cent for self-employed households outside farming to 33.0 per cent for farming households in 20253.
Malaysian households spent RM876 a month on food and non-alcoholic drinks in 2024, equivalent to A$290, and Thai households spent 7,570 baht in 2024, equivalent to A$3256.
Polish households spent about PLN 1,212 a month in 2025, equivalent to A$500, and Australian households spent $681 a month in 2015-163.
| Average monthly household spending on food and non-alcoholic drinks, by country | ||||
|---|---|---|---|---|
| Country | Year | Local currency | Australian dollars | Share of consumption spending |
| Australia | 2015-16 | $681 | $681 | 10.2% |
| Malaysia | 2024 | RM876 | $290 | 15.7%6 |
| Thailand | 2024 | 7,570 baht | $325 | 39.2% |
| Poland | 2025 | PLN 1,212 | $500 | 26.1% |
Source · ABS Household Expenditure Survey 2015-16, COICOP data cube; DOSM Household Expenditure Survey Report 2024; NSO Thailand, 2024 Household Socio-Economic Survey; Statistics Poland, Household Budget Survey 2025; World Bank, World Development Indicators.
Section 03 · Household energy
How much do households in Australia, Malaysia, Thailand and Poland spend on energy?
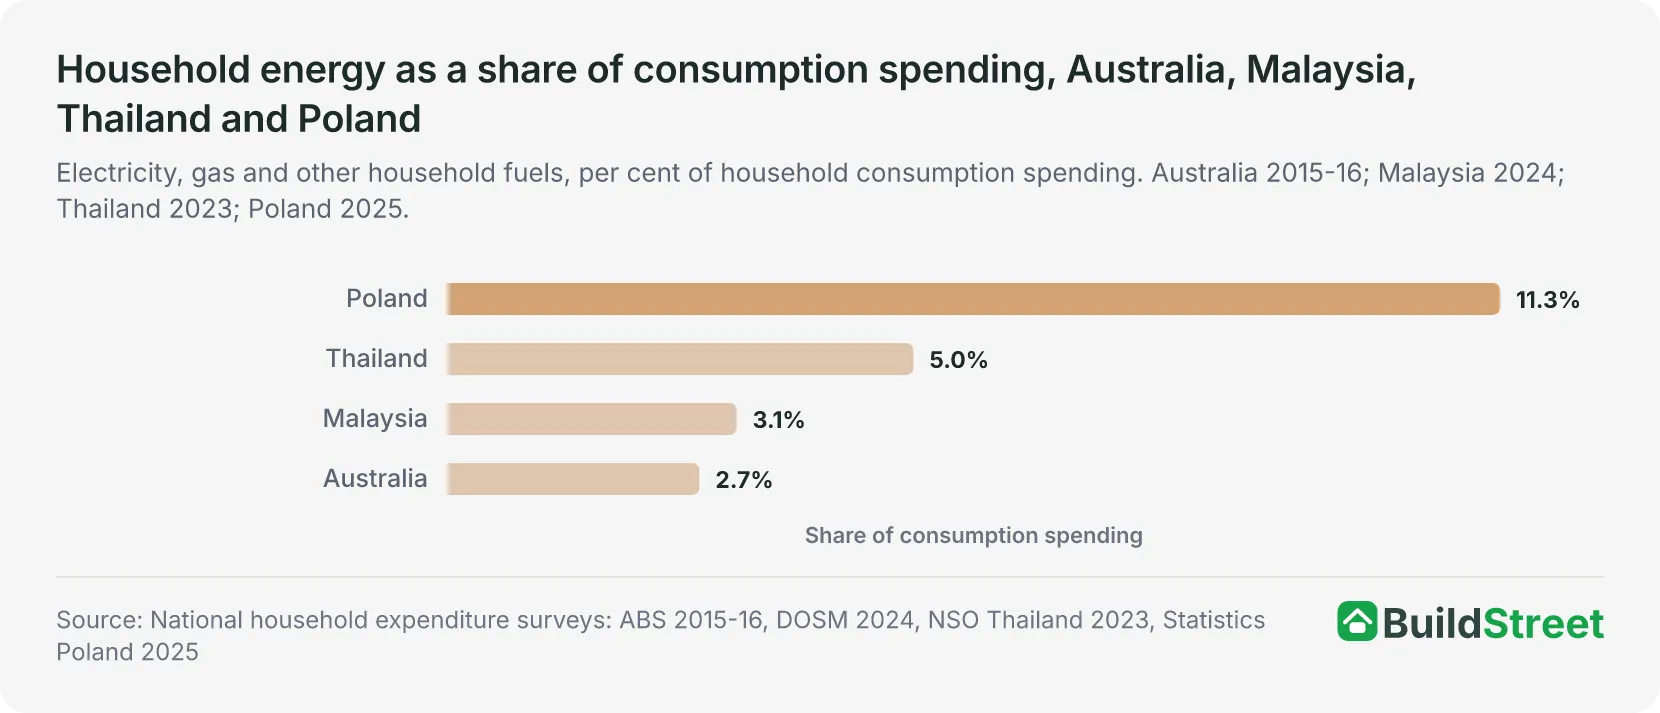
Poland recorded the highest household energy share among the four countries, with electricity, gas and other fuels accounting for 10.9 per cent of total household expenditure in 2025, or 11.3 per cent of spending on consumer goods and services9.
The household energy share was 3.1 per cent of consumption spending in Malaysia in 2024 and 2.7 per cent in Australia in 2015-1665.
Thai households spent 1,025 baht a month on electricity, household gas, charcoal and wood in 2023, including 895 baht on electricity10. This accounted for 5.0 per cent of average monthly household consumption spending of 20,645 baht in 2023.
Electricity for the home cost Australian households an average of $30 a week in 2015-16, making it the eighth-largest detailed spending item1. Malaysian households spent RM156 a month on electricity in 2024, equivalent to A$52, and Thai households spent 895 baht in 2023, equivalent to A$397.
In Poland, electricity, gas and other fuels accounted for 14.0 per cent of total expenditure in households of retirees and pensioners in 2025, compared with 10.0 per cent in employees' households9.
Section 04 · Healthcare
How much do households spend on healthcare in Australia, Malaysia, Thailand and Poland?
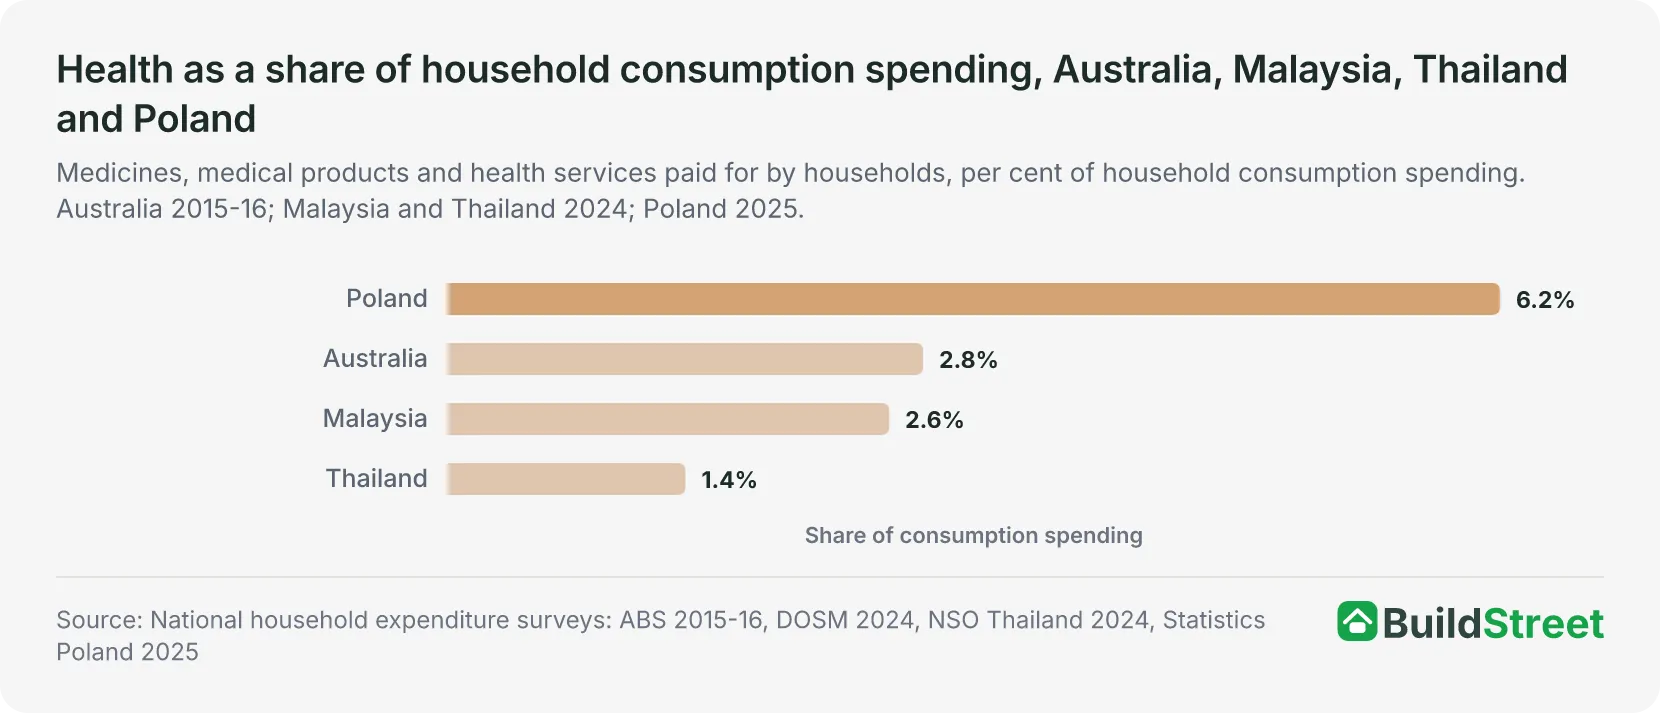
Poland recorded the highest healthcare spending share among the four countries, at 6.2 per cent of spending on consumer goods and services in 2025, while Thailand recorded the lowest, at 1.4 per cent of consumption spending in 202492.
Health accounted for 2.8 per cent of Australian consumption spending in 2015-165 and 2.6 per cent of Malaysian consumption spending in 20246. The difference falls within the surveys' sampling error56.
In Poland, medicines accounted for 3.0 per cent of total household expenditure in 2025 and outpatient healthcare services for 2.1 per cent9. Health accounted for 8.3 per cent of total expenditure in Polish households of retirees and pensioners in 2025, compared with 5.2 per cent in employees' households.
Medicines had the highest spending of any health item for Malaysian households in 2024, at RM66 of the RM147 spent on healthcare each month6.
The World Bank's 2021 price level index for health, which includes healthcare paid for by households and governments, was 194 in Australia, compared with 44 in Malaysia, 40 in Thailand and 46 in Poland8.
Each survey records only what households pay themselves, so government-funded healthcare is excluded from household spending shares. The data does not identify the cause of the differences between countries.
Section 05 · Transport
What share of household spending in Australia, Malaysia, Thailand and Poland goes on transport?
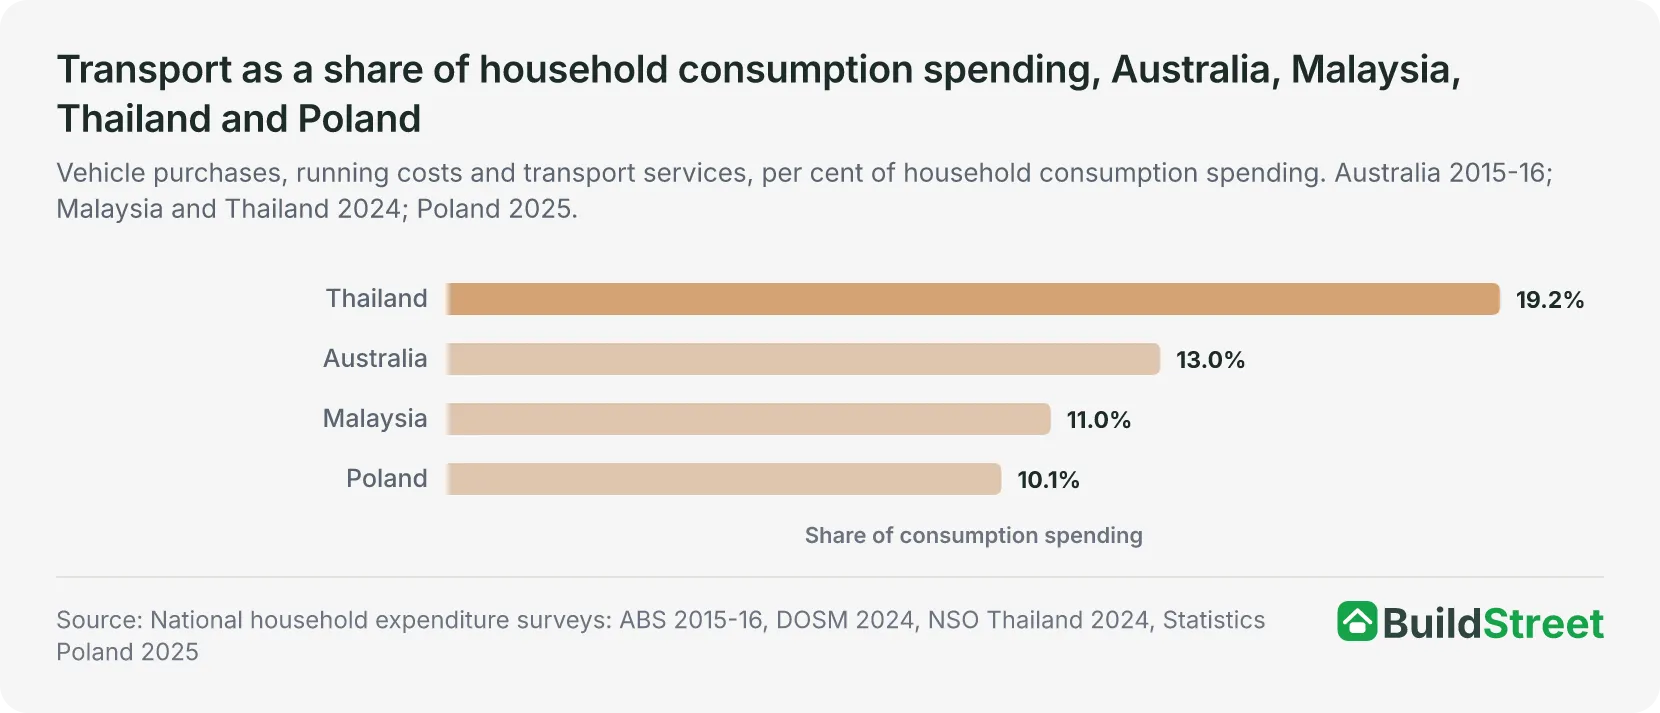
Thailand recorded the highest transport share among the four countries, with vehicles and transportation accounting for 19.2 per cent of household consumption spending in 20242. Transport accounted for 13.0 per cent of Australian consumption spending in 2015-16, 11.0 per cent of Malaysian consumption spending in 2024 and 10.1 per cent of Polish spending on consumer goods and services in 2025569.
Thai households spent 3,713 baht a month on transport and vehicles in 2024, equivalent to A$159, while Malaysian households spent RM611 on transport, equivalent to A$2027. Australian households spent $198.76 a week on transport in 2015-16, including $51.64 on buying vehicles and $107.93 on running them5.
The Australian transport share was higher among higher-income households, from 9.0 per cent of consumption spending in the lowest income fifth to 15.6 per cent in the highest income fifth5.
Transport was the only spending category in which Polish household spending decreased from 2024 to 2025, falling by 2.0 per cent before adjusting for inflation3.
The World Bank's 2021 transport price level index was 136 in Australia and 103 in Poland, compared with 63 in Malaysia and 68 in Thailand8.
Section 06 · Share of income
What share of household income is spent in Australia, Malaysia, Thailand and Poland?
Australian households spent an average of $1,422 a week on goods and services in 2015-16, equivalent to 83.4 per cent of average weekly disposable income of $1,7061.
Malaysian household consumption spending of RM5,566 a month in 2024 was equivalent to 73.4 per cent of average monthly disposable household income of RM7,5844.
Compared with average household income before tax of RM9,155, spending accounted for 60.8 per cent4. Both spending and income include estimated rent from owner-occupied homes, which Malaysia counts as property income.
Thai household consumption spending of 20,645 baht a month in 2023 was equivalent to 71.1 per cent of average total monthly household income of 29,030 baht10. Thailand's income figures include non-cash income, such as estimated rent for owner-occupied homes. Taxes are recorded separately from consumption spending.
Statistics Poland reported that household expenditure fell from 59.3 per cent of available income in 2024 to 57.6 per cent in 2025, with expenditure of PLN 2,015 and available income of PLN 3,500 per person a month9.
Available income is calculated after income tax and social security and health insurance contributions3. The share of income that goes on everyday spending affects how far Australian retirement income goes in Thailand, Poland and Malaysia.
| Household spending as a share of income by country, 2015-16 to 2025 | ||||
|---|---|---|---|---|
| Country | Year | Spending | Income | Spending as % of income |
| Australia | 2015-16 | $1,422 a week (goods and services) | $1,706 a week (disposable) | 83.4% |
| Malaysia | 2024 | RM5,566 a month (consumption) | RM7,584 a month (disposable) | 73.4% |
| Thailand | 2023 | 20,645 baht a month (consumption) | 29,030 baht a month (total) | 71.1% |
| Poland | 2025 | PLN 2,015 per person a month (total expenditure) | PLN 3,500 per person a month (available)9 | 57.6%9 |
Source · ABS Household Expenditure Survey 2015-16; DOSM Household Expenditure Survey Report 2024 and Household Income Survey Report 2024; NSO Thailand, Statistical Yearbook Thailand 2025; Statistics Poland, The situation of households in 2025.
The figures are not directly comparable because countries measure household spending and income differently. Australia and Poland use income after tax, while Thailand uses total income before tax. Malaysia includes estimated rent for owner-occupied homes in both spending and income. Poland reports amounts per person rather than per household.
Section 07
Frequently asked questions
Is food cheaper in Thailand than in Australia?
Food prices were lower in Thailand than in Australia in 2021, with a World Bank price level index of 85 for food and non-alcoholic drinks in Thailand, compared with 148 in Australia. The world average is 100. Thailand's food group, which includes prepared food, accounted for 39.2 per cent of household consumption spending in 2024, compared with 10.2 per cent for food and non-alcoholic drinks in Australia in 2015-16.
How much does an average household in Malaysia spend each month?
Malaysian households spent an average of RM5,566 a month on consumption in 2024, according to the Department of Statistics Malaysia, with a median of RM4,758. At the 2024 average exchange rate, the average was equivalent to about A$1,843.
Is healthcare cheaper in Malaysia than in Australia?
Health prices were lower in Malaysia than in Australia in 2021, with a World Bank price level index of 44 in Malaysia, compared with 194 in Australia. The world average is 100. Malaysian households spent RM147 a month on health in 2024, or 2.6 per cent of consumption spending, within sampling error of the Australian share of 2.8 per cent in 2015-16.
References
- ABS, Household Expenditure Survey, Australia: Summary of Results, 2015–16 · Australian Bureau of Statistics ↑ b c d e f g
- NSO Thailand, The 2024 Household Socio-Economic Survey, Whole Kingdom · nso.go.th ↑ b c d e f g
- Statistics Poland, Household budget survey in 2025 · stat.gov.pl ↑ b c d e f
- DOSM, Household Income Survey Report 2024 (Malaysia and States) · dosm.gov.my ↑ b c
- ABS, Household Expenditure Survey 2015-16, COICOP data cube (65300DO012), Tables 12.1 and 12.2 · Australian Bureau of Statistics ↑ b c d e f g h i j k l
- DOSM, Household Expenditure Survey Report 2024 (Malaysia and States) · dosm.gov.my ↑ b c d e f g h i j k l m n
- World Bank, World Development Indicators: Official exchange rate (PA.NUS.FCRF) · data.worldbank.org ↑ b c
- World Bank, International Comparison Program 2021 · databank.worldbank.org ↑ b c d
- Statistics Poland, The situation of households in 2025 on the basis of results of the Household Budget Survey · stat.gov.pl ↑ b c d e f g h i j
- NSO Thailand, Statistical Yearbook Thailand 2025, chapter 8: Household income and expenditure statistics · nso.go.th ↑ b
