

Published 18 May 2026 · Updated 22 Sept 2026
Australia is behind the pace needed to meet its 1.2 million-home target. By the March 2026 quarter, 308,000 homes had been completed, equal to about 26% of the National Housing Accord goal. To reach the target by June 2029, the country would now need to deliver about 274,400 homes a year, a pace it has not previously reached.
The shortfall reflects several constraints across the housing pipeline. Approvals remain below the required pace, construction labour is stretched, material costs are still rising, and homes are taking longer to build than before the pandemic.
 Is Australia on track to build 1.2 million homes by June 2029?Australia has completed 307,635 homes in the first seven quarters of the National Housing Accord, leaving the country 112,365 homes behind the pace needed to reach 1.2 million by June 2029. Australia…
 Australia’s 1.2 million homes target: progress, funding, and who is responsibleAustralia is behind the straight-line pace needed to build 1.2 million new homes by June 2029. The target requires an average of 60,000 completions per quarter over five years. Over the first six quar…
Section 01
How many homes does Australia need to build each year to meet the target?
The target of 1.2 million homes over five years requires 240,000 completions per year. That pace was already demanding before a single home was built. The highest annual completion figure on record is FY2016–17 at 219,052 dwellings, still short of what the Accord requires every year.
The task has grown harder since the Accord began. The August 2026 quarterly progress report recorded 308,000 completions across the first seven quarters, to the March 2026 quarter1, leaving roughly 892,000 homes still needed over the remaining 13 quarters to June 2029.
That implies a required rate of 68,600 completions a quarter, or 274,400 a year, about 14% above the straight-line pace.
| Measure | Value | Note |
|---|---|---|
| National Housing Accord target | 1,200,000 | Gross completions, 1 July 2024 to 30 June 2029 |
| Straight-line annual pace | 240,000/yr | 1.2M divided by 5 years |
| Straight-line quarterly pace | 60,000/qtr | 1.2M divided by 20 quarters |
| Homes completed (first 7 quarters) | 308,000 | NHSAC August 2026 quarterly report |
| Homes still needed by June 2029 | 892,000 | 1.2M minus 308,000 |
| Required catch-up pace | 68,600/qtr | 892,000 divided by 13 remaining quarters |
| Required annualised catch-up pace | 274,400/yr | 68,600 multiplied by 4 |
Source · Treasury housing pages, May 2026; NHSAC Quarterly Report, August 2026. Catch-up pace calculated by dividing remaining target (1.2M minus 308,000) by the 13 quarters remaining to June 2029.
Section 02
Housing completions: Australia remains well below the required pace
Australia completed 175,510 dwellings in FY2024–25, down 1.3% from 177,848 the previous year.
Approvals increased by 14.4% to 187,944, and commencements rose 12.5% to 180,277, but completions are the only measure that counts toward the Accord target, and they fell slightly.
The year-by-year data on Australian building approvals shows that completions have consistently fallen well short of the 240,000 annual pace in every year on record.
The gap between actual completions and the required pace has remained wide and consistent. The recent upturn in approvals and commencements is a positive signal, but it has not yet translated into higher completion numbers.
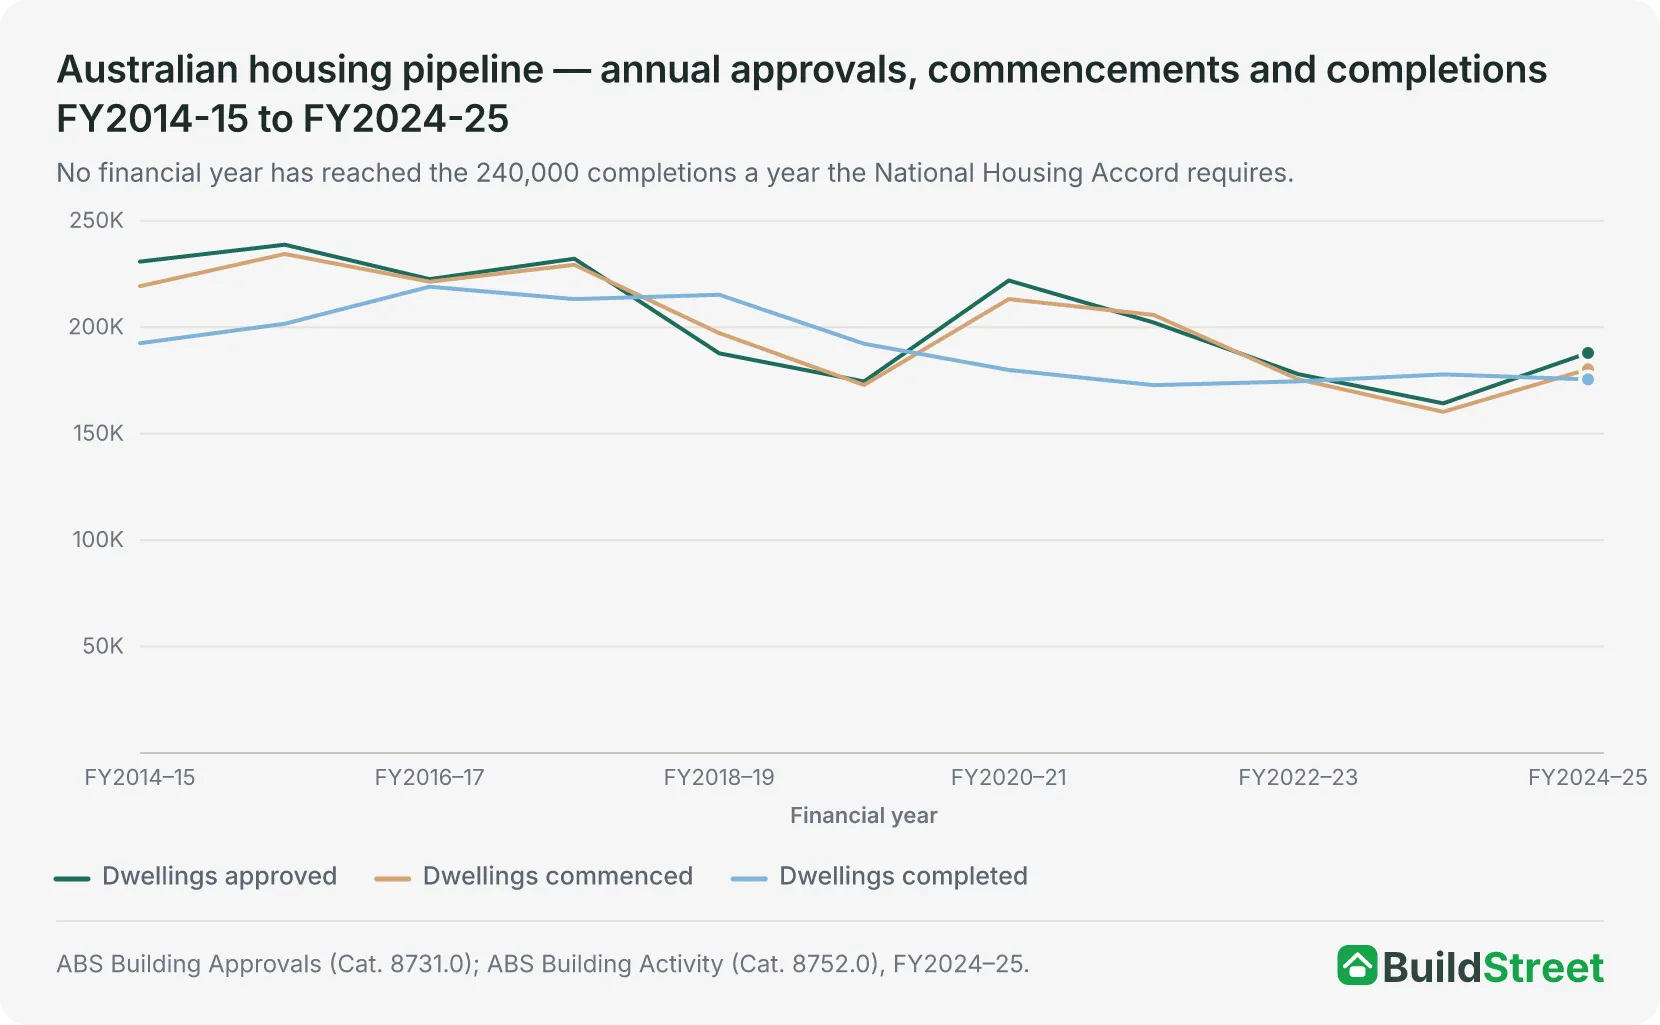
In the March 2026 quarter, commencements reached 48,012 while completions were only 43,816 (seasonally adjusted)2. Dwellings under construction climbed to a record 243,864, up from 220,248 a year earlier, suggesting projects are entering the system faster than they are being finished.
Section 03
Is Australia on track to build 1.2 million homes by 2029?
Even that improved outlook still leaves a 220,000-home shortfall against the Accord target. There is also a downside risk, with modelled scenarios involving higher fuel and petrochemical costs potentially reducing completions by 10,000 to 33,000 homes before mid-2029.
Approvals for the full FY2025–26 year totalled 205,569 dwellings, below both target paces. Detailed state-level progress and scenario forecasts are in the National Housing Accord progress tracker.
Section 04
Why is housing construction falling behind?
Construction is not falling short because of a single problem. A chain of linked constraints spans the entire building pipeline, from the approvals system through to the labour market, financing conditions, build times and the planning framework that determines what gets built and where.
1. Building approvals are not high enough
Approvals are the earliest large-scale pipeline signal, and they remain below target. FY2025–26 approvals of 205,569 were 34,431 below the 240,000 annual Accord pace.
Monthly approvals through 2026 have been volatile and consistently below the 20,000-per-month threshold the Accord requires (seasonally adjusted):
- May 2026: 17,169 approvals
- June 2026: 18,351 approvals
- July 2026: 17,687 approvals3
An approvals flow below target now will translate into a completions flow below target in 12 to 33 months, depending on dwelling type.
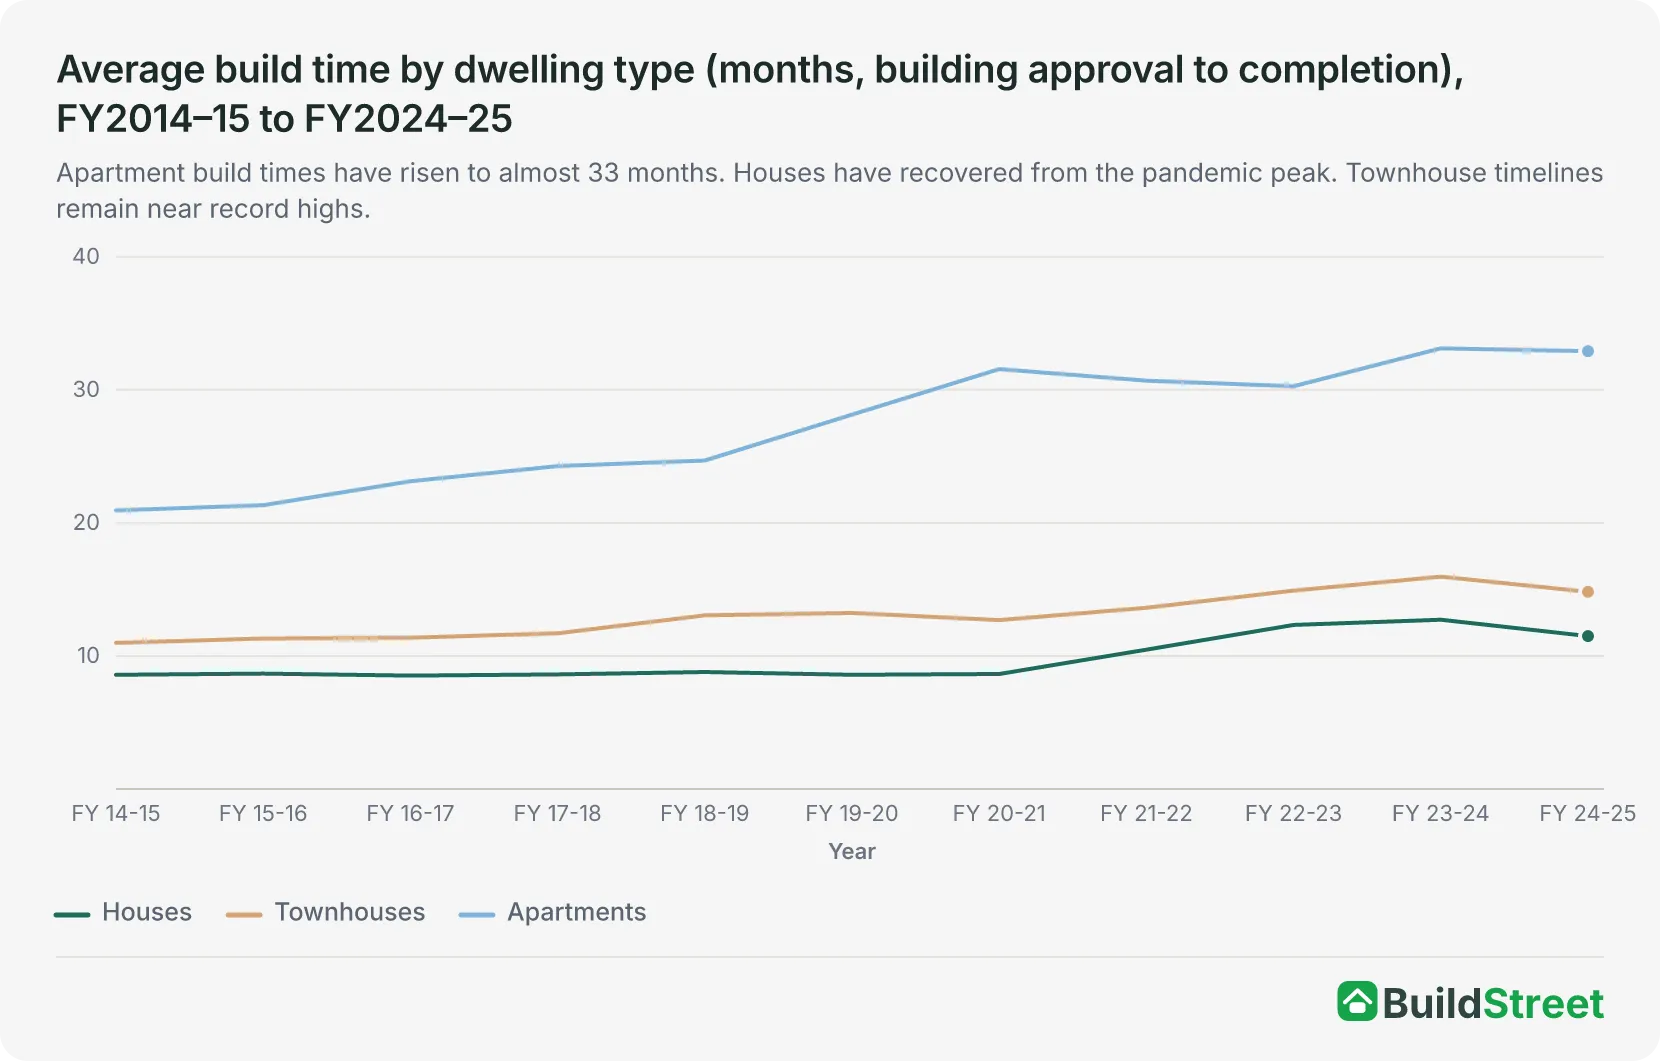
2. Homes are taking longer to build
The average house took 11.5 months from building approval to completion in FY2024–25, an improvement from the pandemic-era peak of 12.72 months. Townhouses still averaged around 15 months and apartments around 33 months, compared with roughly 9 months for a new house in 2019-20.
Longer build times reduce the number of completions any given approvals flow can produce. They also extend the period over which financing costs accumulate before projects generate revenue.
3. Labour shortages are slowing construction
There were 19,900 construction vacancies in May 20264, down from 22,300 in May 2025 but still 20% above the 16,600 recorded before the pandemic in February 2020.
Nearly half of all trade roles remain in shortage, with construction particularly affected. These pressures have eased from their pandemic-era peak but remain a supply constraint.
4. Building material costs remain high
Building construction output prices rose 4.9% in the year to June 20265, and new dwelling prices in the consumer price index were up 5.7% in the year to July 20266.
Cost inflation has slowed sharply from the double-digit surges of 2021–22, but the industry is still building in a materially more expensive environment than before the pandemic.
| Cost measure | Year-on-year change to March 2026 |
|---|---|
| Input prices for house construction | +3.8% |
| Output price of building construction | +4.9% |
| House construction output price | +5.9% |
| Other residential building construction | +4.1% |
| CPI: new dwelling prices | +5.7% |
Source · ABS Producer Price Indexes (Cat. 6427.0), June quarter 2026 (annual change to June 2026); ABS Consumer Price Index (Cat. 6401.0), July 2026 (annual change to July 2026).
5. Higher interest rates made projects harder to finance
The cash rate target was 4.35% as of August 20267, after three increases earlier in the year. Small-business lending rates were also elevated, sitting at 7.46% on outstanding loans and 7.44% on new loans in July 20268.
This matters because residential projects are expensive to fund upfront. Financing costs build up throughout construction, often before any revenue comes in. Higher rates make some projects harder to justify, even though borrowing conditions eased slightly through 2025.
6. Builder insolvencies reduced industry capacity
The number of companies entering external administration for the first time was 14,153 in FY2025–26, down 3.9% from 14,722 in FY2024–259 but still well above the 11,053 of FY2023–24. Construction remained the largest insolvency sector by volume, accounting for 3,472 companies or 24.5% of all first-time administrations.
Each insolvency removes completed projects, partly-built homes and experienced workers from the pipeline, while raising risk premiums across the sector for those that remain.
7. Apartment construction has not recovered enough
Higher-density dwellings accounted for 39.8% of all new commencements in the March 2026 quarter, with 19,116 commencements out of 48,012 (seasonally adjusted). However, annual apartment approvals remain well below the mid-2010s peak.
Given that apartments take around 33 months to move from building approval to completion, a sustained recovery in approvals needs to begin now for those projects to count toward the June 2029 deadline. If apartment supply does not recover materially, detached housing cannot carry the Accord target on its own.
8. Land release and infrastructure are slowing new supply
Australia's housing package includes a National Planning Reform Blueprint covering planning, zoning, land release and approval pathways, with a specific emphasis on medium- and high-density housing in well-located areas.
A separate $3.5 billion Housing Support Program10, including a $2 billion Local Infrastructure Fund announced in the 2026–27 Budget, funds enabling infrastructure, community amenity and planning capacity to help meet the Accord target. Reviews of the housing system have consistently called on governments to improve planning systems and increase the supply of developable, serviced land.
The inclusion of dedicated funding and intergovernmental coordination suggests these issues are recognised as significant constraints on new housing supply, rather than peripheral concerns.
Section 05
Which states are furthest behind on housing supply?
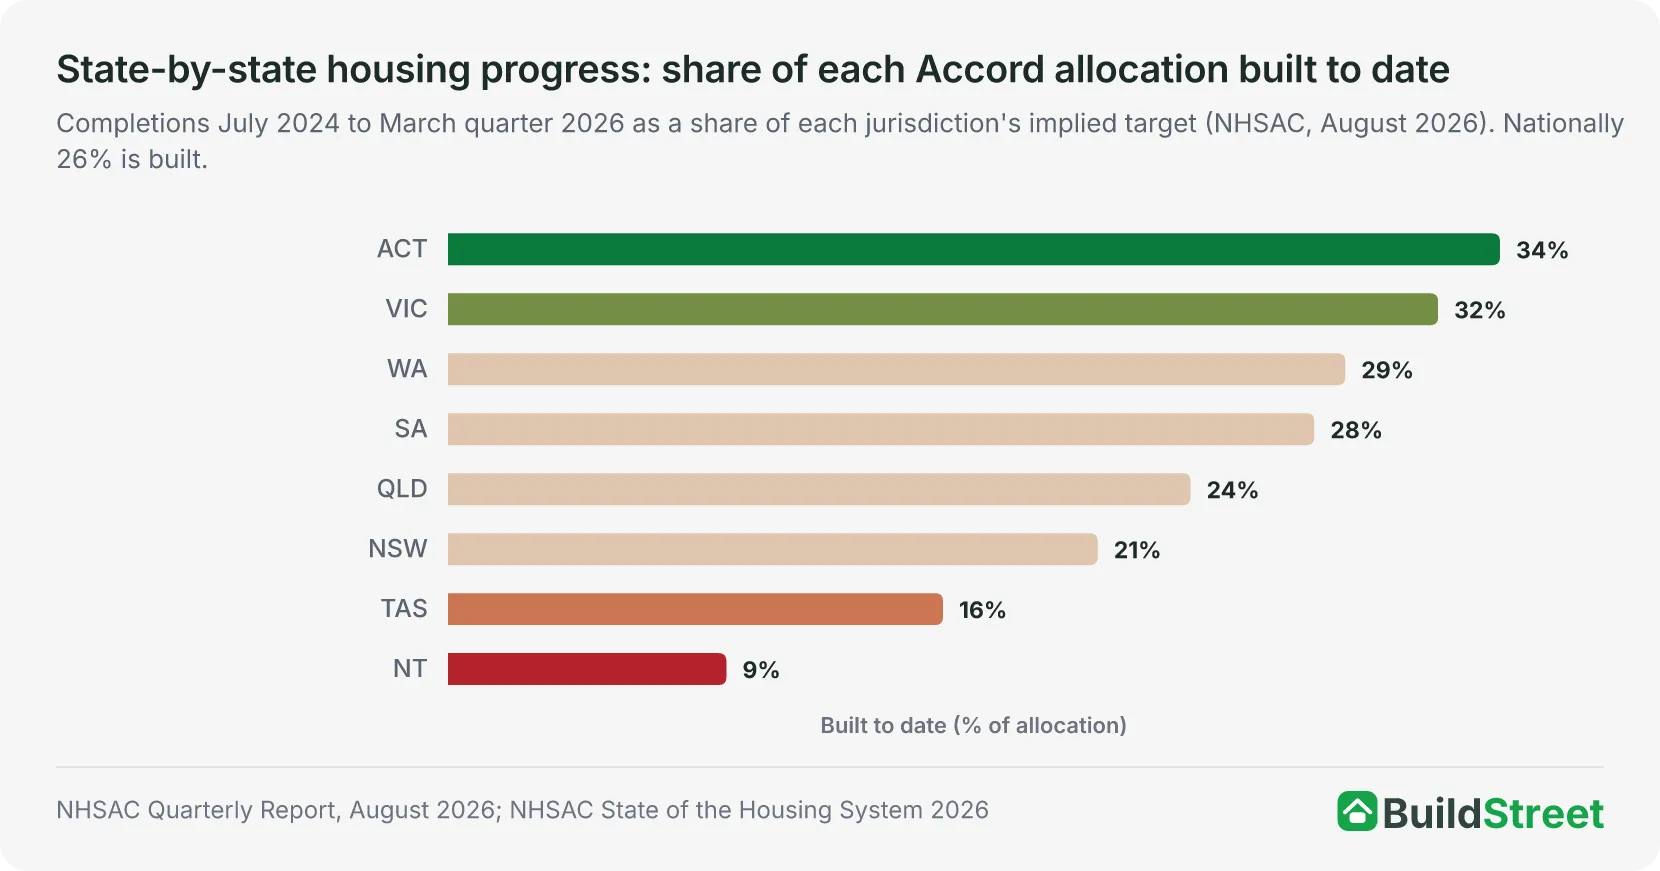
New South Wales has the biggest gap to close in raw numbers. Just 21% of its 376,000-home target has been built, and it is not expected to be done until March 2032.
In proportional terms, the Northern Territory and Tasmania are even further off the pace.
- Northern Territory: 9% built, projected past 2034
- Tasmania: 16% built, projected June 2034
- New South Wales: 21% built, projected March 20321
In NHSAC's early-2026 outlook the ACT and Western Australia were the only jurisdictions forecast to meet their implied shares, but the August 2026 quarterly report now expects every jurisdiction to finish after June 2029, with the ACT, Victoria and Western Australia closest at December 2029.
| State / territory | Implied target | Built to date | Approved to date | 2026 forecast | Expected completion |
|---|---|---|---|---|---|
| New South Wales | 376,000 | 21% | 27% | 69% | Mar 2032 |
| Victoria | 306,000 | 32% | 37% | 94% | Dec 2029 |
| Queensland | 246,000 | 24% | 35% | 83% | Mar 2031 |
| Western Australia | 129,000 | 29% | 38% | 100% | Dec 2029 |
| South Australia | 84,000 | 28% | 35% | 78% | Mar 2031 |
| Tasmania | 26,000 | 16% | 20% | 51% | Jun 2034 |
| Australian Capital Territory | 21,000 | 34% | 33% | 103% | Dec 2029 |
| Northern Territory | 11,000 | 9% | 14% | 34% | After 2034 |
| Australia (national) | 1,200,000 | 26% | 33% | 82% | Dec 2030 |
Section 06
Apartments are critical to meeting the housing target
Apartments matter because the target cannot be met through detached housing alone.
Higher-density dwellings accounted for 39.8% of all new commencements in the March 2026 quarter, with 19,116 of 48,012 new homes (seasonally adjusted) falling into this category. Detached houses alone cannot deliver the volumes the Accord requires, and if the higher-density share is not sustained and increased, the national pipeline will remain structurally short regardless of what happens in the detached segment.
The planning blueprint explicitly targets medium- and high-density housing in well-located areas close to transport, amenities and jobs. The states that need to deliver the most volume, particularly NSW and Victoria, depend heavily on the apartment and townhouse pipeline near established infrastructure. These are also the areas where new land for detached housing is limited, unavailable or impractical.
Section 07
The housing shortfall is increasing pressure on buyers and renters
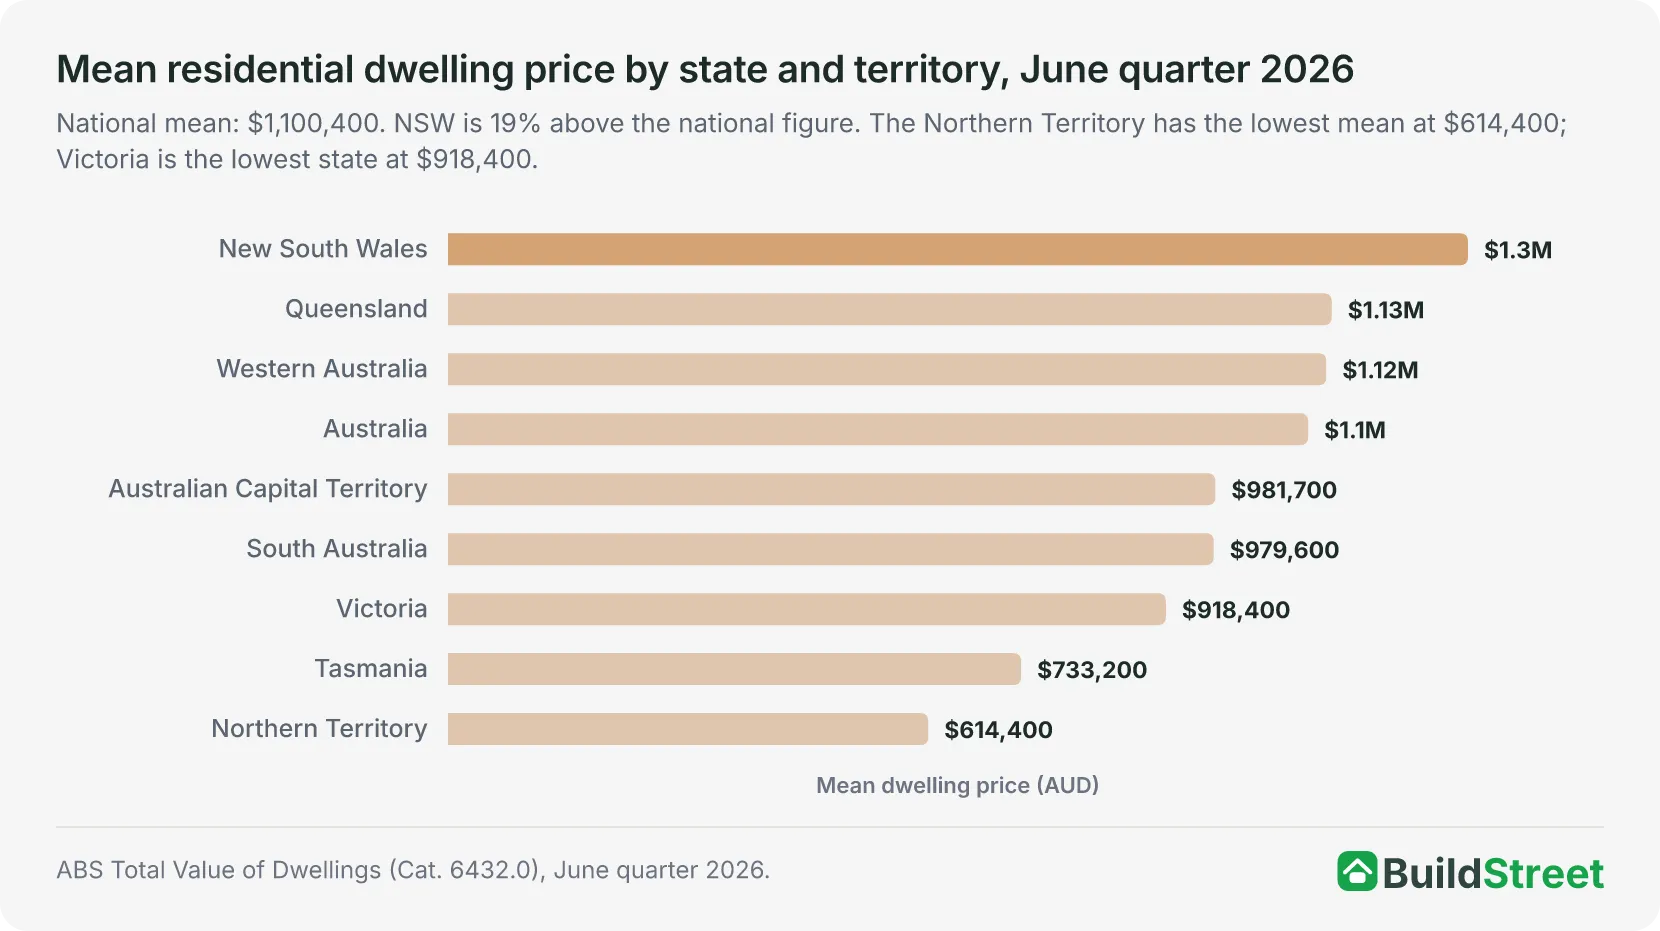
The national mean dwelling price was $1,100,400 in the June 2026 quarter. NSW recorded the highest state mean at $1,304,900, which was 19% above the national figure and about $174,000 higher than Queensland, the next most expensive state11.
These are mean dwelling values across all residential property, not median sale prices, but they reflect the price environment buyers face in a market where new supply has consistently fallen short of demand.
For renters, conditions have improved from their worst point but remain under strain. Rents rose 3.6% over the year to July 20266, driven by low vacancy rates across capital cities.
Around 1.38 million income units received Commonwealth Rent Assistance in the March 2026 quarter. Of those, approximately 608,000 (44%) remained in rental stress12 even after receiving support, still spending more than 30% of gross income on rent.
Section 08
The path to 1.2 million homes: what would need to change
Australia is not on track to deliver 1.2 million homes by June 2029 on current production settings, but the outlook has improved.
The most recent forecast points to around 980,000 completions by the Accord deadline, with the full target not expected to be met until around December 2030.
The 2026 forecast is stronger than the previous year's outlook, lifting the projected five-year total from 938,000 to 980,000 homes13. This is equal to 82% of the target. The Council's August 2026 quarterly report now puts the national completion date at December 20301, 18 months after the Accord deadline.
Even that improved outlook still leaves a 220,000-home shortfall against the Accord target. There is also a downside risk: modelled scenarios involving higher fuel and petrochemical costs could reduce completions by 10,000 to 33,000 homes before mid-2029, which could push the total below 82% of the target without corrective action.
| Scenario | Projected homes | % of target | Expected date to reach 1.2M |
|---|---|---|---|
| NHSAC 2025 forecast | 938,000 | 78% | Not modelled |
| NHSAC 2026 no-conflict forecast | 980,000 | 82% | Around September 2030; revised to December 2030 in the August 2026 quarterly report |
| NHSAC 2026 downside (fuel and petrochemical cost shock) | 947,000–970,000 | 79–81% | Later than the base case |
| Accord target | 1,200,000 | Not on current track | June 2029 |
Source · NHSAC State of the Housing System 2025 and 2026; NHSAC Quarterly Report, August 2026.
References
- NHSAC Quarterly Report – August 2026 · nhsac.gov.au ↑ b c
- ABS Building Activity, Australia, March 2026 (Cat. 8752.0) · Australian Bureau of Statistics ↑
- ABS Building Approvals, Australia (latest release, Cat. 8731.0) · Australian Bureau of Statistics ↑
- ABS Job Vacancies, Australia (latest release, Cat. 6354.0) · Australian Bureau of Statistics ↑
- ABS Producer Price Indexes, Australia (Cat. 6427.0) — latest release · Australian Bureau of Statistics ↑
- ABS Consumer Price Index, Australia (latest release, Cat. 6401.0) · Australian Bureau of Statistics ↑ b
- RBA Cash Rate Target · Reserve Bank of Australia ↑
- RBA, Business Lending Rates: Statistical Table F7 · Reserve Bank of Australia ↑
- ASIC Australian insolvency statistics (Series 1, latest release) · asic.gov.au ↑
- Treasury — Housing Support Program · treasury.gov.au ↑
- ABS Total Value of Dwellings, June Quarter 2026 — Table 1. Total value of dwellings, all series · Australian Bureau of Statistics ↑
- AIHW Commonwealth Rent Assistance in Australia: quarterly data — Rental stress · aihw.gov.au ↑
- NHSAC State of the Housing System 2026 · nhsac.gov.au ↑
- ABS, Building Activity, Australia (latest release, Cat. 8752.0) · Australian Bureau of Statistics
- ABS Total Value of Dwellings, December Quarter 2025 · Australian Bureau of Statistics
- NHSAC Quarterly Report, March 2026 · nhsac.gov.au
- NHSAC State of the Housing System, 2025 · nhsac.gov.au
- Treasury — Increasing housing supply · treasury.gov.au
- AIHW Housing Assistance in Australia, June 2025 · aihw.gov.au
- Jobs and Skills Australia — Occupation Shortage List 2025 · jobsandskills.gov.au
