


Published

Section 01 · Price levels
How does the cost of living in Thailand, Malaysia and Poland compare with Australia?
Thailand recorded the lowest household consumption price level among the three countries in 2021, at 30.3 per cent of Australia's, compared with 31.7 per cent in Malaysia and 38.1 per cent in Poland, according to the World Bank International Comparison Program (ICP)1.
At 2021 exchange rates, household goods and services costing A$100 in Australia cost the equivalent of about A$30 in Thailand, A$32 in Malaysia and A$38 in Poland1. This is an example based on the ICP price levels for household consumption.
Household consumption includes what households buy, as well as health, education and other services provided by governments and non-profit organisations2.
Australia recorded the eighth-highest household consumption price level among the 176 economies covered by the ICP in 2021, at 177.4, compared with a world average of 1001. Among the seven countries compared, the United States recorded 159.1, New Zealand 156.1 and the United Kingdom 153.0.
In 2017, Thailand's household consumption price level was also 30.3 per cent of Australia's, compared with 31.9 per cent in Malaysia and 38.6 per cent in Poland, according to the revised 2017 ICP results1.
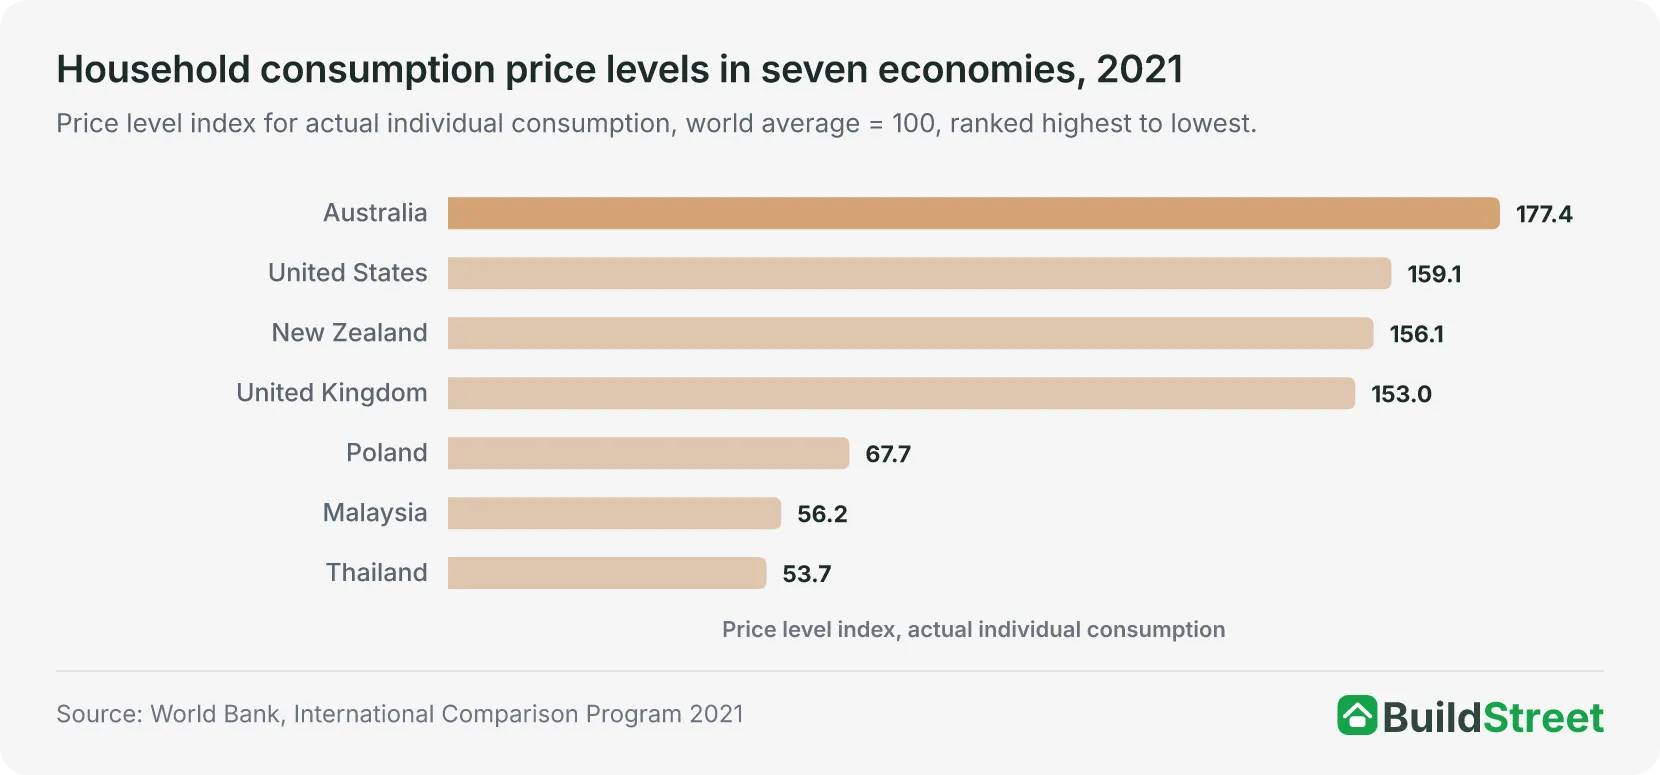
| Price levels for GDP and household consumption, Australia, Thailand, Malaysia and Poland, 2021 | |||
|---|---|---|---|
| Country | GDP price level (world = 100) | Household consumption price level (world = 100) | Household consumption price level (Australia = 100) |
| Australia | 168.6 | 177.4 | 100.0 |
| Thailand | 55.2 | 53.7 | 30.3 |
| Malaysia | 57.9 | 56.2 | 31.7 |
| Poland | 70.7 | 67.7 | 38.1 |
Source · World Bank, International Comparison Program 2021.
The cost of living in Australia article covers what Australian households spent in 2025.
Section 02 · Housing
How much cheaper is housing in Thailand, Malaysia and Poland than in Australia?
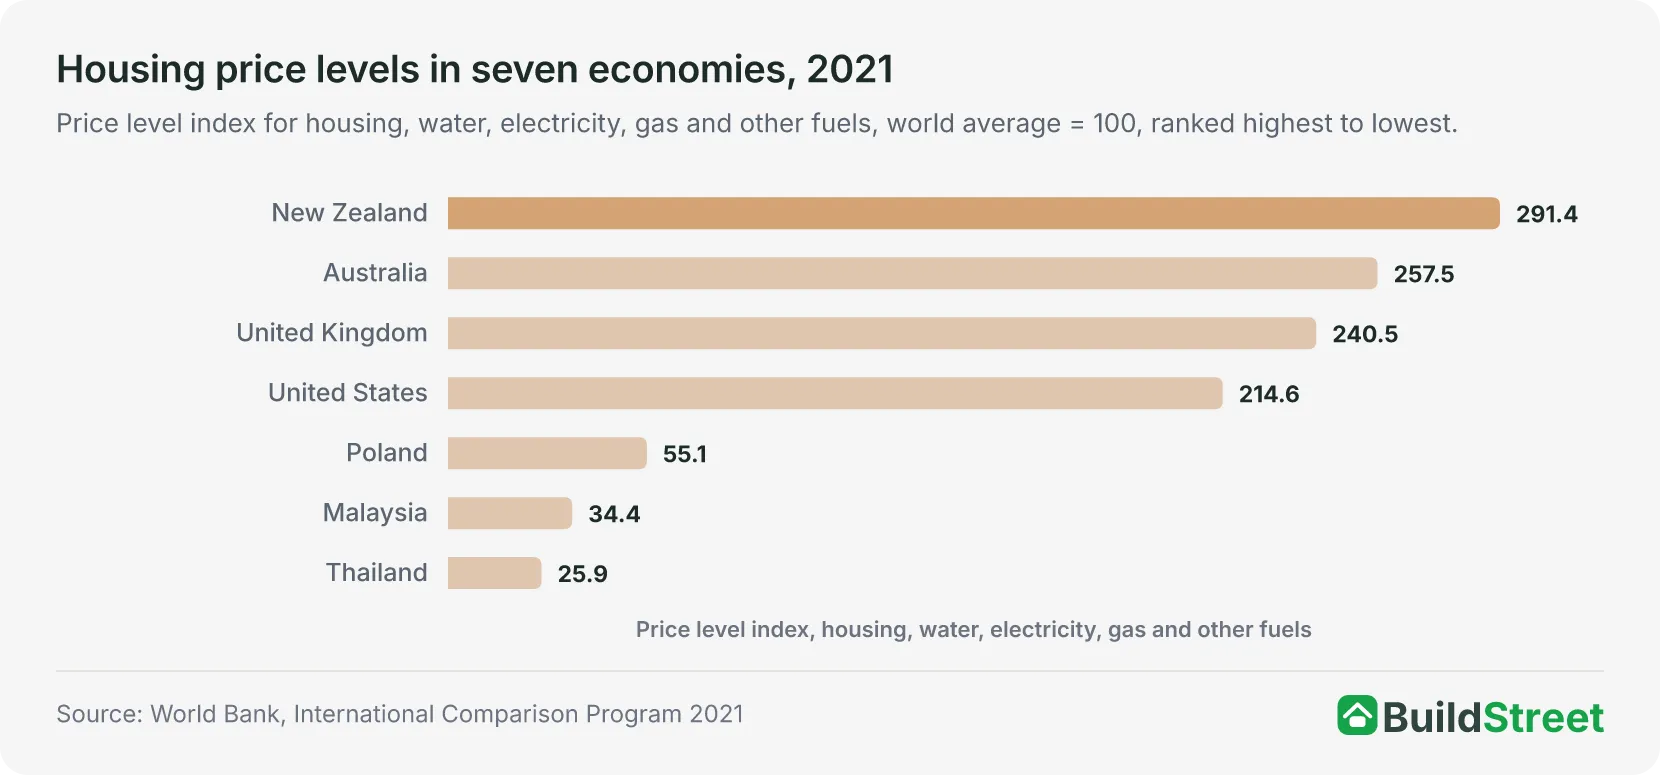
Housing recorded the largest price gap with Australia among the 12 main spending categories in all three countries in 2021, with Thailand's housing price level at 10.1 per cent of Australia's1. Malaysia's housing price level was 13.4 per cent of Australia's and Poland's was 21.4 per cent.
The housing category covers actual and estimated rents together with water, electricity, gas and other fuels13.
These figures are national averages, and housing prices vary between cities and regions within each country.
Among the seven economies compared, New Zealand recorded the highest housing price level, at 291.4, compared with the world average of 100 and Australia's level of 257.51.
Section 03 · Everyday spending
How do food, power and transport prices in Thailand, Malaysia and Poland compare with Australia?
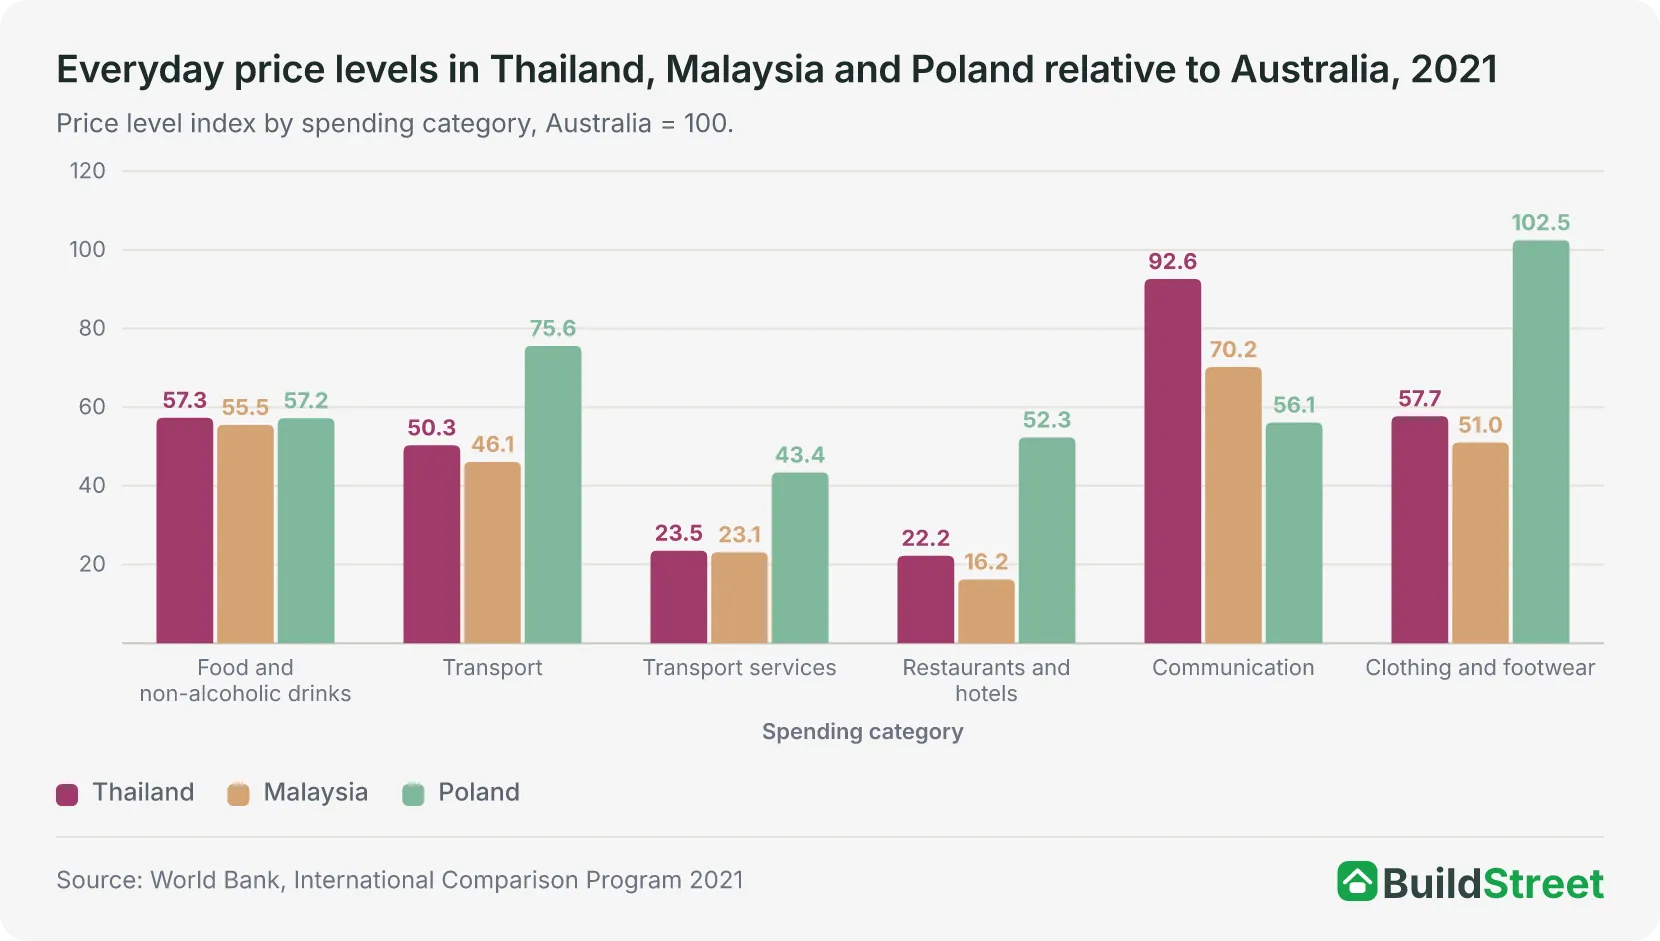
Malaysia recorded the lowest food and non-alcoholic drinks price level among the three countries in 2021, at 55.5 per cent of Australia's, compared with 57.2 per cent in Poland and 57.3 per cent in Thailand1.
Transport prices ranged from 46.1 per cent of Australia's in Malaysia to 75.6 per cent in Poland, with Thailand at 50.3 per cent1.
For transport services, excluding the cost of buying and running vehicles, prices were equivalent to 23.1 per cent of Australia's in Malaysia, 23.5 per cent in Thailand and 43.4 per cent in Poland1.
The World Bank does not publish separate 2021 price figures for household electricity. Household power is counted in the housing, water, electricity, gas and other fuels category1.
Restaurant and hotel prices were equivalent to 16.2 per cent of Australia's in Malaysia, compared with 22.2 per cent in Thailand and 52.3 per cent in Poland1.
Clothing and footwear prices in Poland were equivalent to 102.5 per cent of Australia's1.
| Price levels by spending category, Australia, Thailand, Malaysia and Poland, 2021 | ||||
|---|---|---|---|---|
| Spending category | Australia | Thailand | Malaysia | Poland |
| Food and non-alcoholic drinks | 148.3 | 85.0 | 82.3 | 84.7 |
| Alcoholic drinks and tobacco | 319.0 | 98.2 | 118.2 | 75.6 |
| Clothing and footwear | 115.2 | 66.5 | 58.8 | 118.1 |
| Housing, water, electricity, gas and other fuels | 257.5 | 25.9 | 34.4 | 55.1 |
| Furnishings and household equipment | 128.3 | 79.1 | 63.7 | 91.4 |
| Health | 194.0 | 39.9 | 43.8 | 46.3 |
| Transport | 136.0 | 68.4 | 62.7 | 102.8 |
| Communication | 115.1 | 106.6 | 80.8 | 64.5 |
| Recreation and culture | 132.1 | 55.6 | 56.8 | 72.8 |
| Education | 207.0 | 41.5 | 77.8 | 58.4 |
| Restaurants and hotels | 187.5 | 41.6 | 30.5 | 98.0 |
| Miscellaneous goods and services | 157.3 | 54.1 | 52.9 | 60.8 |
Source · World Bank, International Comparison Program 2021.
Section 04 · Healthcare
How do healthcare prices in Thailand, Malaysia and Poland compare with Australia?
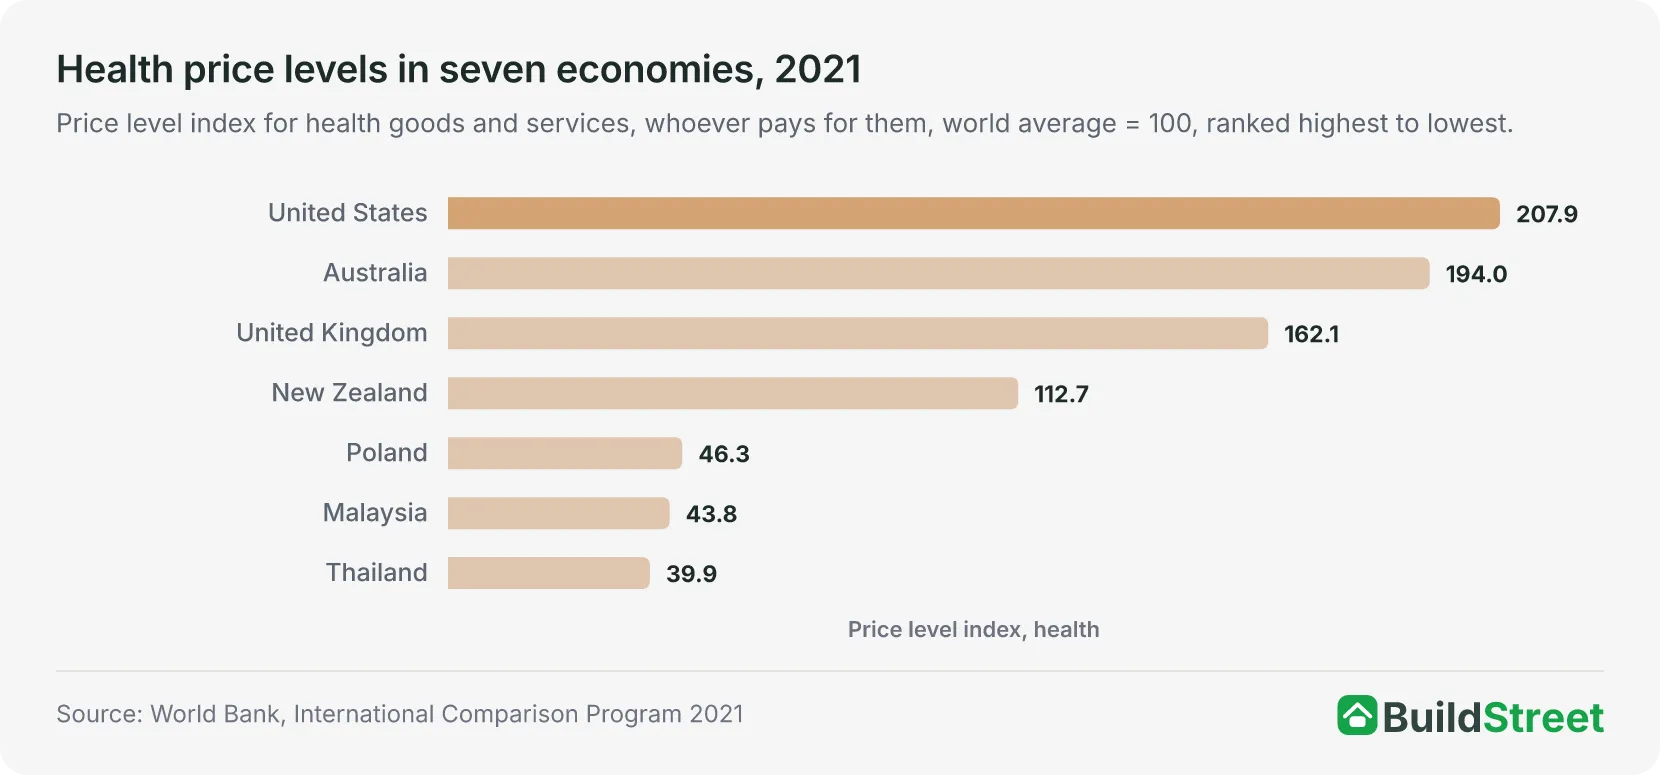
Thailand recorded the lowest healthcare price level among the three countries in 2021, at 20.6 per cent of Australia's1. Malaysia's healthcare prices were equivalent to 22.6 per cent of Australia's and Poland's were 23.9 per cent.
The comparison includes healthcare goods and services, regardless of who pays for them, including government-funded care2. It compares prices, not what a household pays directly for healthcare.
Among the seven countries compared, the United States recorded the highest healthcare price level, at 207.9, against a world average of 100, followed by Australia at 194.01.
Medicare does not cover Australians while they are overseas, according to Services Australia4.
Section 05 · The currency factor
How have exchange rates changed what the Australian dollar buys overseas?
Based on annual average exchange rates, the Australian dollar bought 16.5 per cent fewer Polish zloty, 11.8 per cent fewer Thai baht and 11.3 per cent fewer Malaysian ringgit in 2025 than in 2021, according to World Bank exchange-rate data5.
One Australian dollar bought 24.02 baht in 2021, compared with 21.19 baht in 20255. Over the same period, it fell from 3.112 to 2.761 ringgit and from 2.901 to 2.423 zloty.
A$1 bought 17.7 per cent fewer baht, 5.9 per cent fewer ringgit and 14.4 per cent fewer zloty in 2025 than in 20155.
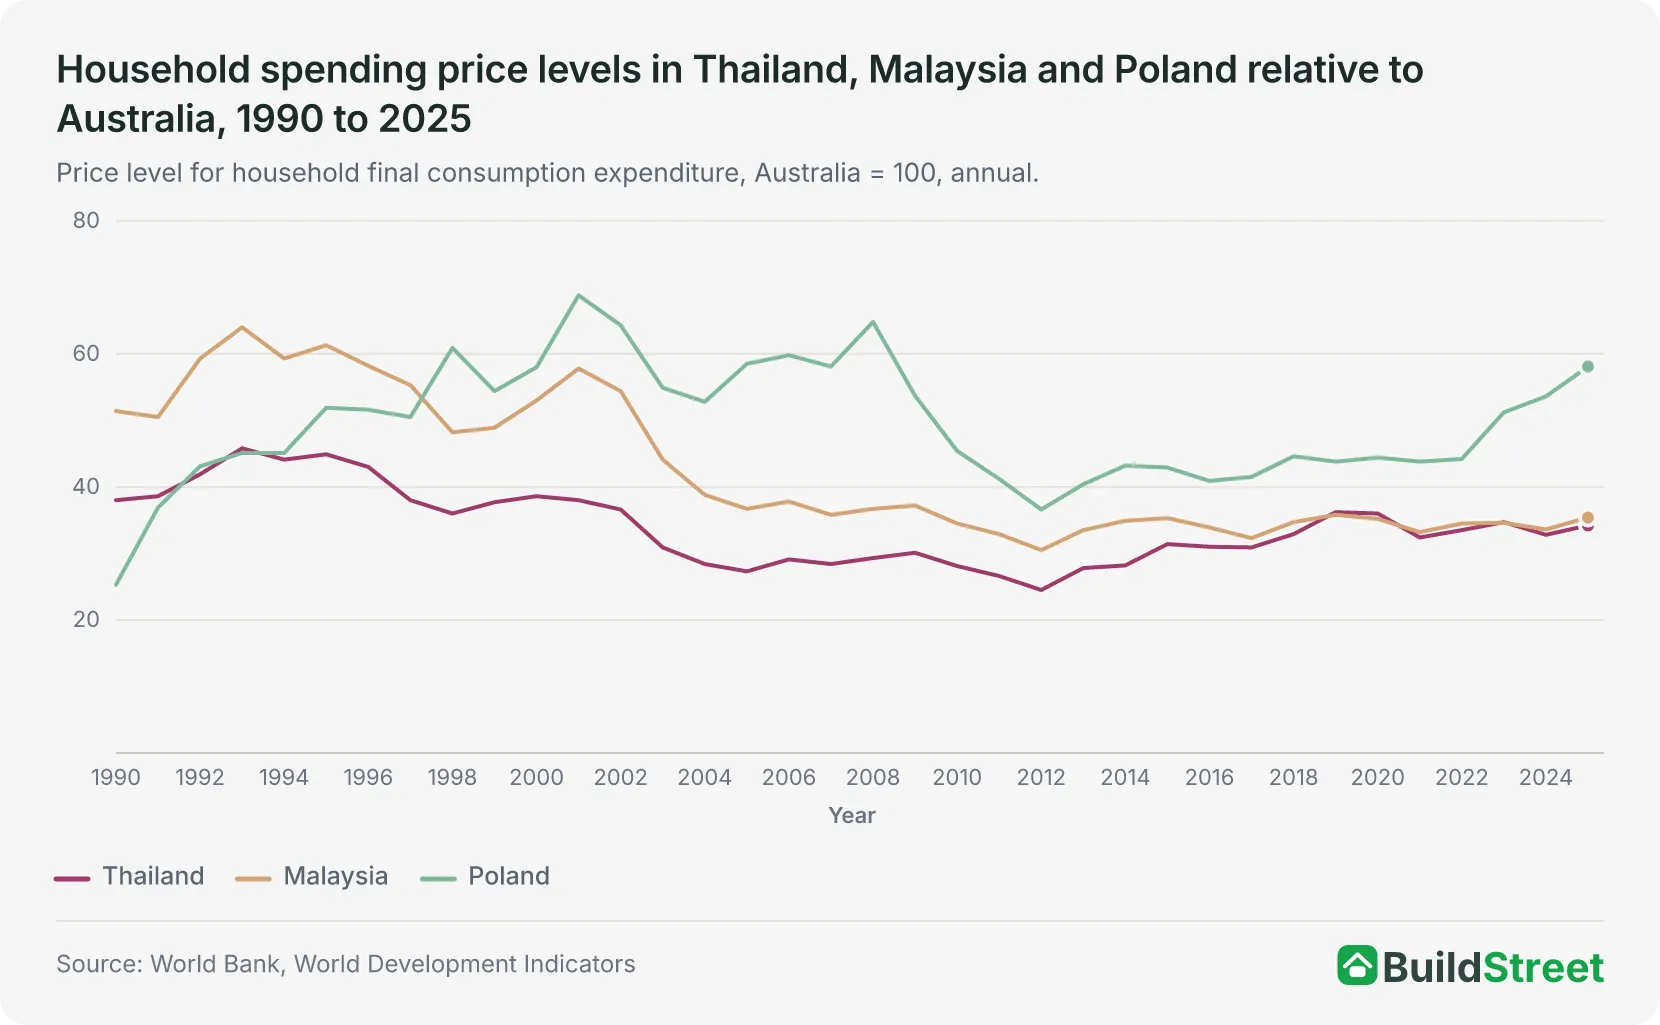
Poland's price level for household purchases, which excludes government-funded services, rose from 43.8 per cent of Australia's in 2021 to an estimated 58.1 per cent in 2025, calculated from World Bank data6.
From 2021 to 2025, consumer prices rose 37.5 per cent in Poland and 19.5 per cent in Australia7.
Thailand's price level for household purchases rose from 32.4 per cent of Australia's in 2021 to an estimated 34.2 per cent in 2025, while Malaysia's rose from 33.2 per cent to an estimated 35.4 per cent6.
These annual figures measure household purchases and exclude services provided by governments and non-profit organisations. This is why Poland's 2021 figure of 43.8 per cent differs from the earlier comparison of 38.1 per cent, which includes those services6. Values after 2021 are estimates rather than direct international price comparisons8.
From 1990 to 2025, Thailand's price level for household purchases ranged from 24.5 per cent of Australia's in 2012 to 45.8 per cent in 1993, while Poland's ranged from 25.3 per cent in 1990 to 68.8 per cent in 20016.
| Australian dollar exchange rates against the baht, ringgit and zloty, annual averages, 2015 to 2025 | |||
|---|---|---|---|
| Year | Thai baht per A$1 | Malaysian ringgit per A$1 | Polish zloty per A$1 |
| 2015 | 25.73 | 2.934 | 2.832 |
| 2016 | 26.24 | 3.084 | 2.931 |
| 2017 | 26.01 | 3.296 | 2.897 |
| 2018 | 24.14 | 3.015 | 2.699 |
| 2019 | 21.58 | 2.880 | 2.669 |
| 2020 | 21.54 | 2.893 | 2.684 |
| 2021 | 24.02 | 3.112 | 2.901 |
| 2022 | 24.32 | 3.053 | 3.092 |
| 2023 | 23.12 | 3.030 | 2.793 |
| 2024 | 23.29 | 3.020 | 2.627 |
| 2025 | 21.19 | 2.761 | 2.423 |
Source · World Bank, World Development Indicators, official exchange rate (International Monetary Fund data).
Section 06 · Departures
How many Australian citizens leave Australia each year?
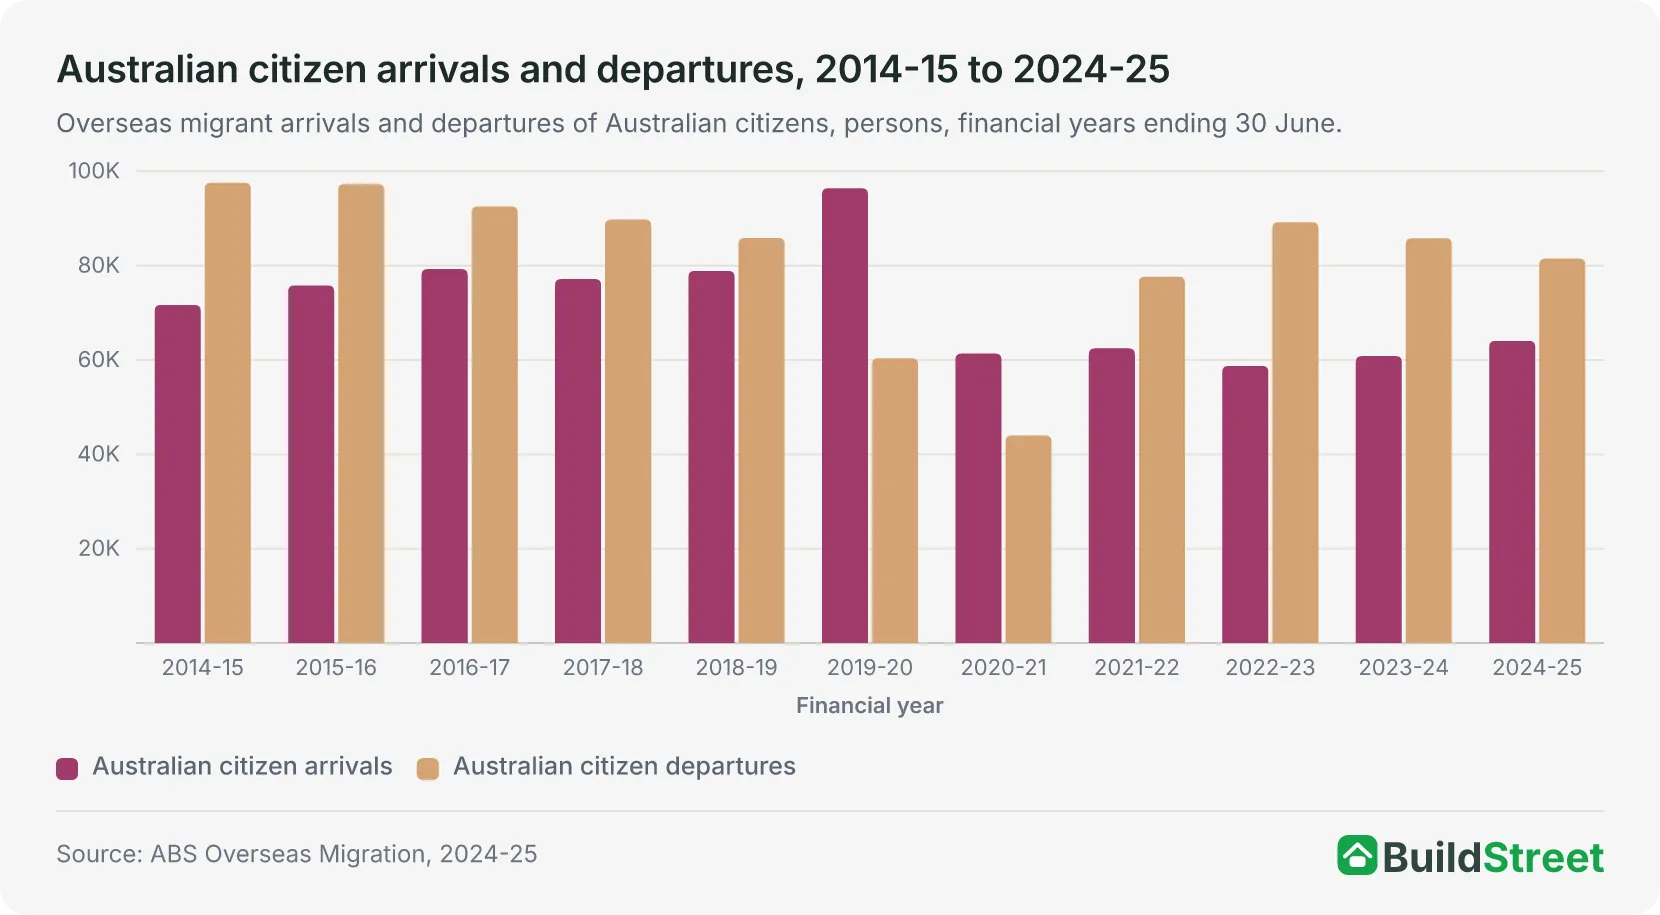
Australian citizen departures fell from 85,820 in 2023-24 to 81,510 in 2024-25, according to the Australian Bureau of Statistics (ABS) Overseas Migration data9. Over the same period, 64,060 Australian citizens arrived, resulting in a net loss of 17,450 citizens through migration.
The ABS records how many Australian citizens leave for an extended period, but not their reasons for leaving.
Citizen departures averaged 92,616 a year from 2014-15 to 2018-199. Departures declined each year over this period, from 97,570 in 2014-15 to 85,890 in 2018-19.
The United Nations estimated that 430,718 migrants from Australia were living overseas in mid-2024, based on figures reported by countries that identify Australia as a place of origin10. Most countries count people born in Australia, while some use Australian citizenship. The United Kingdom recorded the largest estimated number of migrants from Australia among those countries, at 124,319, followed by New Zealand at 89,129.
Malaysia had an estimated 2,432 migrants from Australia, compared with 2,079 in Poland10. The United Nations does not provide separate figures for Thailand or the United States because migrants from Australia are grouped with people from other countries.
| International migrants from Australia by country of residence, mid-2024 | ||
|---|---|---|
| Country of residence | Migrants from Australia | Counted by |
| United Kingdom | 124,319 | Born in Australia |
| New Zealand | 89,129 | Born in Australia |
| Canada | 26,777 | Born in Australia |
| Malta | 22,753 | Born in Australia |
| Greece | 21,915 | Born in Australia |
| Italy | 18,314 | Born in Australia |
| Singapore | 17,222 | Born in Australia |
| China | 13,927 | Australian citizens |
| Japan | 11,962 | Australian citizens |
| Ireland | 11,165 | Born in Australia |
| Malaysia | 2,432 | Born in Australia |
| Poland | 2,079 | Born in Australia |
Source · United Nations Department of Economic and Social Affairs, International Migrant Stock 2024.
Section 07
Frequently asked questions
Is it cheaper to live in Thailand than in Australia?
Thailand's household consumption price level was 30.3 per cent of Australia's in 2021, according to the World Bank International Comparison Program1. The comparison reflects prices and exchange rates in 2021. By 2025, the Australian dollar bought 11.8 per cent fewer Thai baht than in 2021, based on annual averages5.
How much cheaper is Malaysia than Australia?
Malaysia's household consumption price level was 31.7 per cent of Australia's in 2021, according to the World Bank International Comparison Program1. Housing recorded the largest price gap with Australia among the 12 main spending categories, with Malaysia's housing price level at 13.4 per cent of Australia's.
Is Poland cheaper than Australia?
Poland's household consumption price level was 38.1 per cent of Australia's in 2021, according to the World Bank International Comparison Program1. On a narrower measure that excludes government-funded services, Poland's price level increased from 43.8 per cent of Australia's in 2021 to an estimated 58.1 per cent in 2025, calculated from World Bank data6. The Australian dollar bought 16.5 per cent fewer zloty in 2025 than in 20215.
How many Australian citizens moved overseas in 2024-25?
Australian citizen departures totalled 81,510 in 2024-25, according to the Australian Bureau of Statistics, counting citizens who spent 12 months or more overseas within 16 months of leaving9. Departures averaged 92,616 a year from 2014-15 to 2018-19.
Why do Australians move overseas?
Official Australian migration data does not record why people leave, so the reasons for the 81,510 Australian citizen departures in 2024-25 are not identified. The figures show how many citizens leave for an extended period, but not whether living costs influenced their decision.
Does Medicare cover Australians living overseas?
Medicare does not cover Australians while they are overseas, according to Services Australia4. In 2021, healthcare price levels were equivalent to 20.6 per cent of Australia's in Thailand, 22.6 per cent in Malaysia and 23.9 per cent in Poland, according to the World Bank International Comparison Program, a comparison of prices rather than out-of-pocket costs.
References
- World Bank, International Comparison Program 2021 · databank.worldbank.org ↑ b c d e f g h i j k l m n o p q r s t
- World Bank, ICP 2021: Concepts and definitions · worldbank.org ↑ b c
- World Bank, ICP 2021: Methodology, PPP calculation and estimation · worldbank.org ↑
- Services Australia, Before you leave Australia · servicesaustralia.gov.au ↑ b
- World Bank, World Development Indicators: Official exchange rate (PA.NUS.FCRF) · data.worldbank.org ↑ b c d e
- World Bank, PPP conversion factor, households and NPISHs final consumption expenditure (PA.NUS.PRVT.PP) · data.worldbank.org ↑ b c d e
- World Bank World Development Indicators, Consumer price index (2010 = 100) · data.worldbank.org ↑
- World Bank, International Comparison Program · worldbank.org ↑
- ABS Overseas Migration, 2024-25 · Australian Bureau of Statistics ↑ b c
- United Nations, International Migrant Stock 2024 · un.org ↑ b c
- World Bank, Global purchasing power parities data released for 2021 · worldbank.org
- Reserve Bank of Australia, Exchange Rates, Statistical Table F11.1 · Reserve Bank of Australia
