

Published 24 June 2026
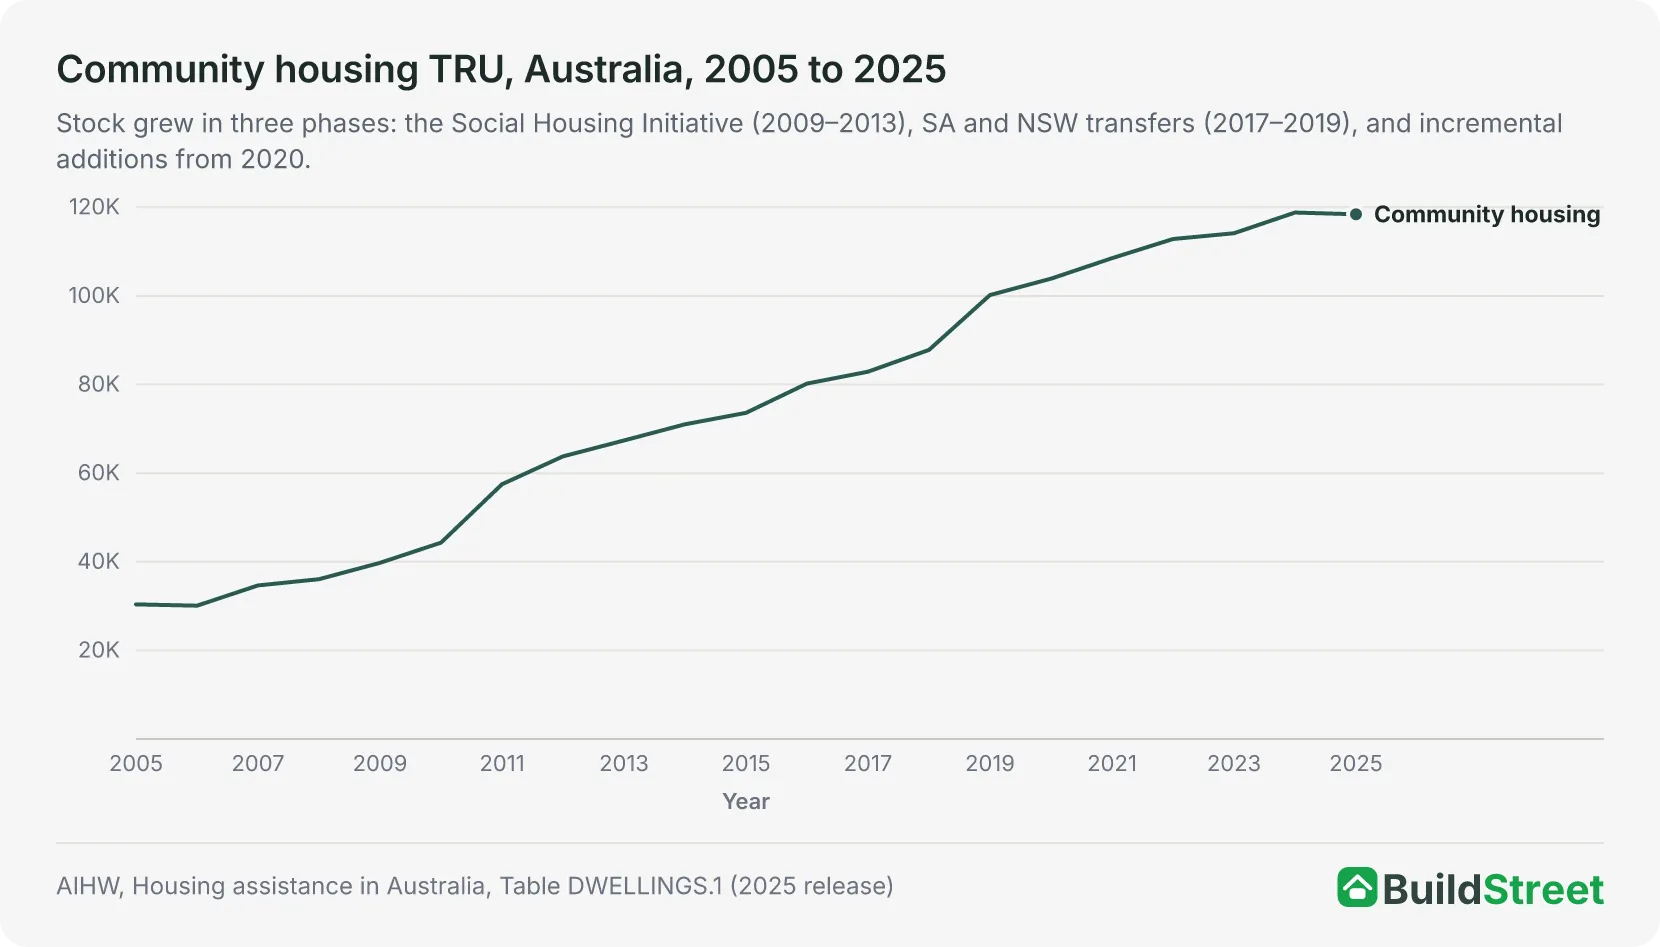
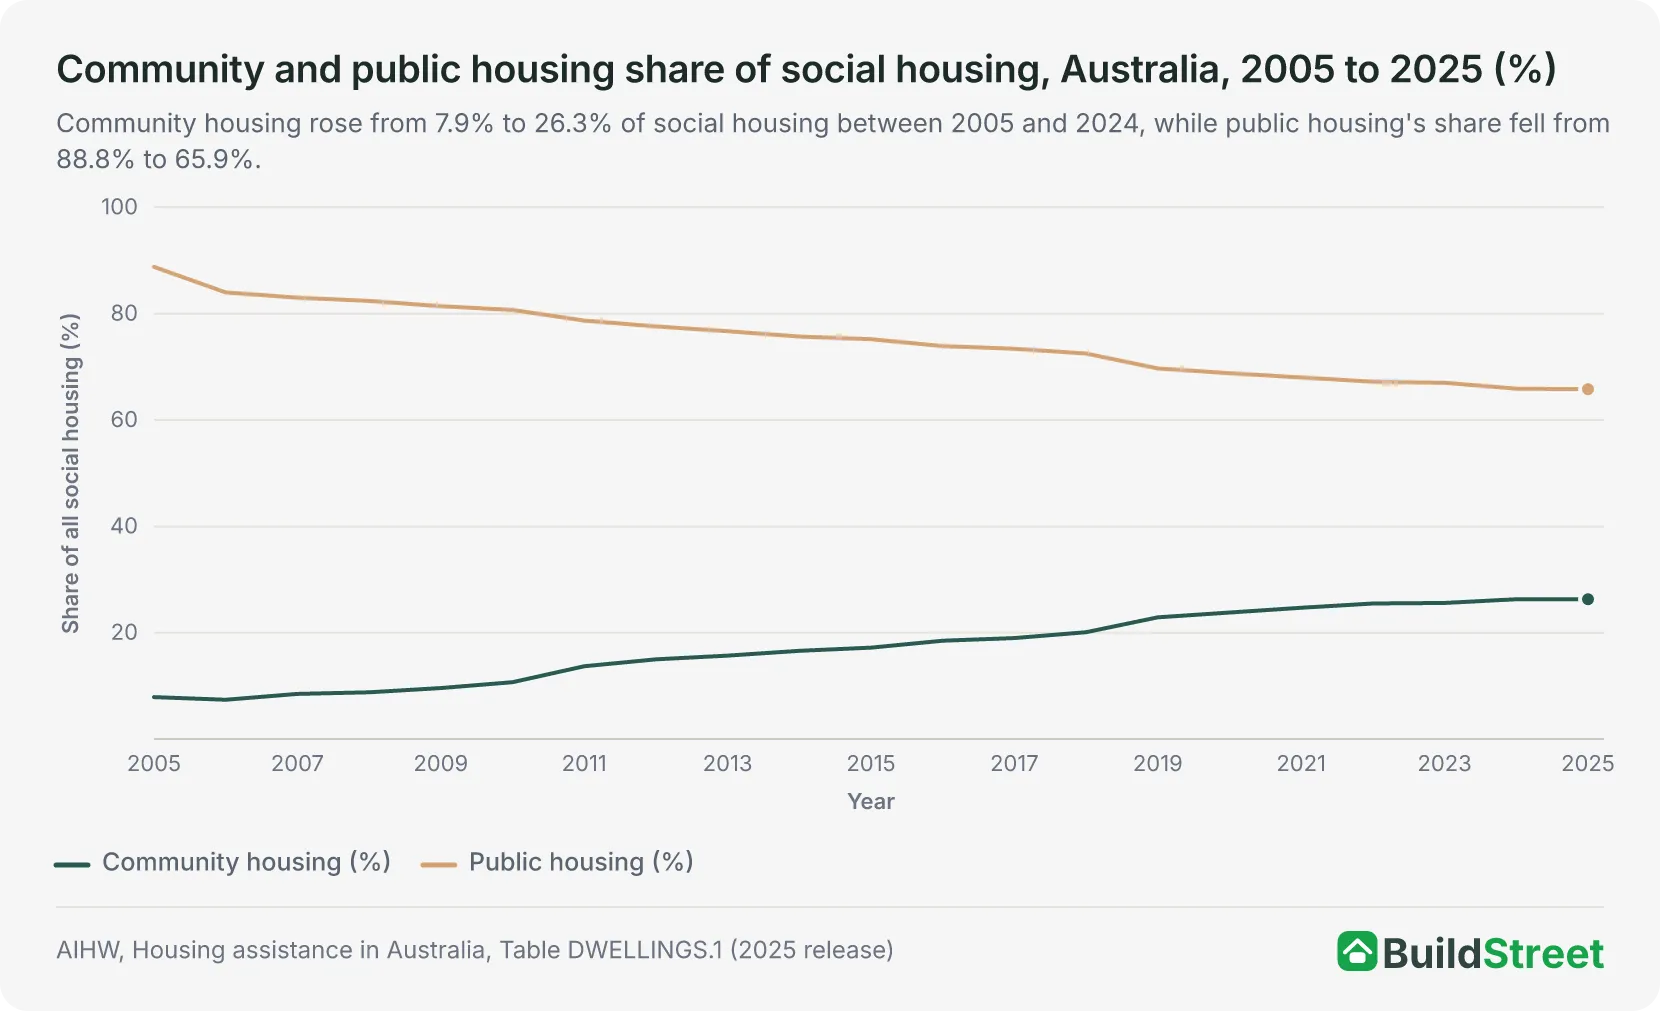
Community housing providers managed 118,817 tenancy rental units at 30 June 2024, up from 30,392 in 2005. Over the same period, community housing's share of Australia's social housing system rose from 7.9% to 26.3%, while public housing's share fell from 88.8% to 65.9%.
This growth came from three main sources: public housing stock transfers to community providers, new construction funded through government grants and private finance, and a funding model that allows eligible community housing tenants to receive Commonwealth Rent Assistance. The $10 billion Housing Australia Future Fund, launched in 2023, is now the largest national programme supporting new social and affordable housing supply through community housing providers.
 Public housing statistics in Australia: stock, waitlists and long-term trendsThe national public housing waitlist reached 189,536 households at 30 June 2025, up 12.5% in a single year and the highest level in the comparable series since 2014. At the same time, Australia’s publ…
 Australian dwelling mix statistics: how houses, apartments and emerging home types have changedDetached houses made up 73.3% of all new dwelling approvals in 1990. By 2025, that share had fallen to 57.8%, while apartments and townhouses accounted for a larger share of the national total. Total…
What is the difference between community housing and public housing?
Community housing is managed by not-for-profit providers rather than state and territory governments. The main practical difference is that eligible community housing tenants can receive Commonwealth Rent Assistance, while public housing tenants generally cannot. Both programmes charge below-market rents and serve people who cannot afford private rental.
What caused community housing to grow in Australia?
The sector grew from 7.9% to 26.3% of Australia's social housing system between 2005 and 2024. Most of this growth came from public housing stock transfers, especially in South Australia in 2017–18 and New South Wales in 2018–19. New construction and government programmes using not-for-profit community housing providers also added to the sector over this period.
Section 01 · Definition
What is community housing in Australia?
Community housing accounted for 26.3% of all social housing in Australia at June 2024, up from 7.9% in 2005. It is managed by not-for-profit community housing providers and sits within the wider social housing system alongside public housing, state-owned and managed Indigenous housing, and Indigenous community housing.
Community housing is rental housing managed by not-for-profit community housing providers (CHPs) for people who cannot afford private market rents. Three features distinguish it from public housing:
- Commonwealth Rent Assistance eligibility: Community housing tenants can receive CRA because they rent from a non-government provider. Public housing tenants generally cannot. For eligible tenants, CRA forms part of the rent paid to the provider, giving community housing providers an income stream that state housing authorities do not receive under the public housing model.
- Non-government ownership and management: Community housing properties may be owned, leased or managed by a community housing provider, rather than managed directly by a state or territory government.
- Private finance access: Larger community housing providers can borrow against their property portfolios and raise private funds alongside government grants. This can support additional housing delivery, although projects still usually rely on public funding, land contributions or other forms of subsidy.
| Programme | Who manages it | Key characteristics |
|---|---|---|
| Public housing | State and territory governments | Direct government management; largest programme; tenants not eligible for CRA |
| Community housing | Not-for-profit CHPs | Non-government providers; tenants may receive CRA; can leverage private finance |
| SOMIH | State authorities (Indigenous-specific) | State-owned and managed Indigenous housing; concentrated in Qld and NT |
| Indigenous community housing | Indigenous community organisations | Funded and unfunded providers; significant data limitations apply |
| Community housing vs public housing at a glance | ||
|---|---|---|
| Measure | Community housing | Public housing |
| Stock (June 2025) | 118,425 TRU | 296,541 dwellings |
| Share of social housing (2024) | 26.3% | 65.9% |
| CRA eligibility | Yes, if income-eligible | Generally no |
| Main manager | 531 not-for-profit CHPs | State/territory housing authorities |
| Recurrent govt spend per household (2024–25) | $5,024 | $15,510 |
| Employment as main income (2024) | 11.5% | 6.6% |
| With disability (2024) | 29.0% | 42.3% |
Source · AIHW, Housing assistance in Australia 2025, Tables DWELLINGS.1, HOUSEHOLDS.4; Productivity Commission, ROGS 2026, Tables 18A.1, 18A.3.
Section 02 · Current stock
How many community housing homes are there in Australia?
Australia had 118,817 community housing tenancy rental units at 30 June 2024, with 107,637 households in active tenancies. That equates to an occupancy rate of 90.6%. The sector grew from 30,392 TRU in 2005 and is now the second-largest component of Australia's social housing system after public housing.
- Tenancy rental units (TRU)
- 118,817
- at 30 June 2024
- Occupied households
- 107,637
- 90.6% occupancy rate
- TRU at June 2025
- 118,425
- most recent ROGS figure
The most recent ROGS count was 118,425 TRU at June 2025, slightly below the 2024 AIHW figure. This change should be read cautiously because the figures come from different reporting releases and may reflect reporting or classification differences.
Section 03 · Growth trend
Community housing growth in Australia since 2005
Community housing grew by 291% between 2005 and 2024, from 30,392 to 118,817 tenancy rental units. The increase was not steady. Growth was concentrated in two major periods: the Social Housing Initiative from 2009 to 2013, and stock transfer programmes in South Australia and New South Wales from 2017 to 2019.
Growth Timeline
2005–2009
Early organic growth
+9,378 TRU · +31%. Community housing rose from 30,392 to 39,770 TRU through small-scale construction and programme expansion, before major policy interventions reshaped the sector.
2009–2013
Peak phaseSocial Housing Initiative
+27,615 TRU · +69%. The largest single-year jump occurred in 2010–11, when community housing grew by 13,178 TRU. The Commonwealth programme funded new social housing construction, with a portion delivered through community housing providers.
2013–2017
Consolidation
+15,517 TRU · +23%. Moderate growth through incremental transfers and smaller state programmes, rising from 67,385 to 82,902 TRU.
2017–2019
TransfersSA and NSW stock transfers
+17,303 TRU · +21%. South Australia transferred 3,820 public housing and 225 SOMIH dwellings to CHPs in 2017–18. NSW transferred approximately 10,700 public housing properties in 2018–19, the largest single transfer event in the sector's history. These transfers added to community housing TRU but did not increase total social housing stock.
2020–2024
Incremental growth
+14,922 TRU · +14%. Smaller transfers, new construction and programme additions supported growth averaging approximately 3,700 TRU per year.
Show full table
| Full annual data table, 2005 to 2025 | |||
|---|---|---|---|
| Year (30 June) | Community housing TRU | Year-on-year change | Share of social housing |
| 2005 | 30,392 | n/a | 7.9% |
| 2006 | 30,103 | −289 | 7.4% |
| 2007 | 34,672 | +4,569 | 8.5% |
| 2008 | 36,079 | +1,407 | 8.8% |
| 2009 | 39,770 | +3,691 | 9.6% |
| 2010 | 44,328 | +4,558 | 10.7% |
| 2011 | 57,506 | +13,178 | 13.7% |
| 2012 | 63,797 | +6,291 | 15.0% |
| 2013 | 67,385 | +3,588 | 15.7% |
| 2014 | 71,036 | +3,651 | 16.6% |
| 2015 | 73,620 | +2,584 | 17.2% |
| 2016 | 80,226 | +6,606 | 18.5% |
| 2017 | 82,902 | +2,676 | 19.0% |
| 2018 | 87,819 | +4,917 | 20.1% |
| 2019 | 100,205 | +12,386 | 22.9% |
| 2020 | 103,895 | +3,690 | 23.8% |
| 2021 | 108,519 | +4,624 | 24.7% |
| 2022 | 112,843 | +4,324 | 25.5% |
| 2023 | 114,150 | +1,307 | 25.6% |
| 2024 | 118,817 | +4,667 | 26.3% |
| 2025 (ROGS) | 118,425 | −392 | n/a |
Source · AIHW, Housing assistance in Australia, Table DWELLINGS.1 (2025 release); Productivity Commission, ROGS 2026, Table 18A.3. Highlighted rows mark the three largest single-year increases: 2011 (+13,178, Social Housing Initiative peak); 2018 (+4,917, SA transfer); 2019 (+12,386, NSW transfer). The 2006 figure is the only year of decline before 2025.
Section 04 · State breakdown
Which state has the most community housing?
New South Wales had 52,439 community housing tenancy rental units at June 2025, accounting for about 44% of national community housing stock. Growth varied widely between jurisdictions from 2016 to 2025, ranging from 2.7% in Western Australia to 142.9% in the Northern Territory.
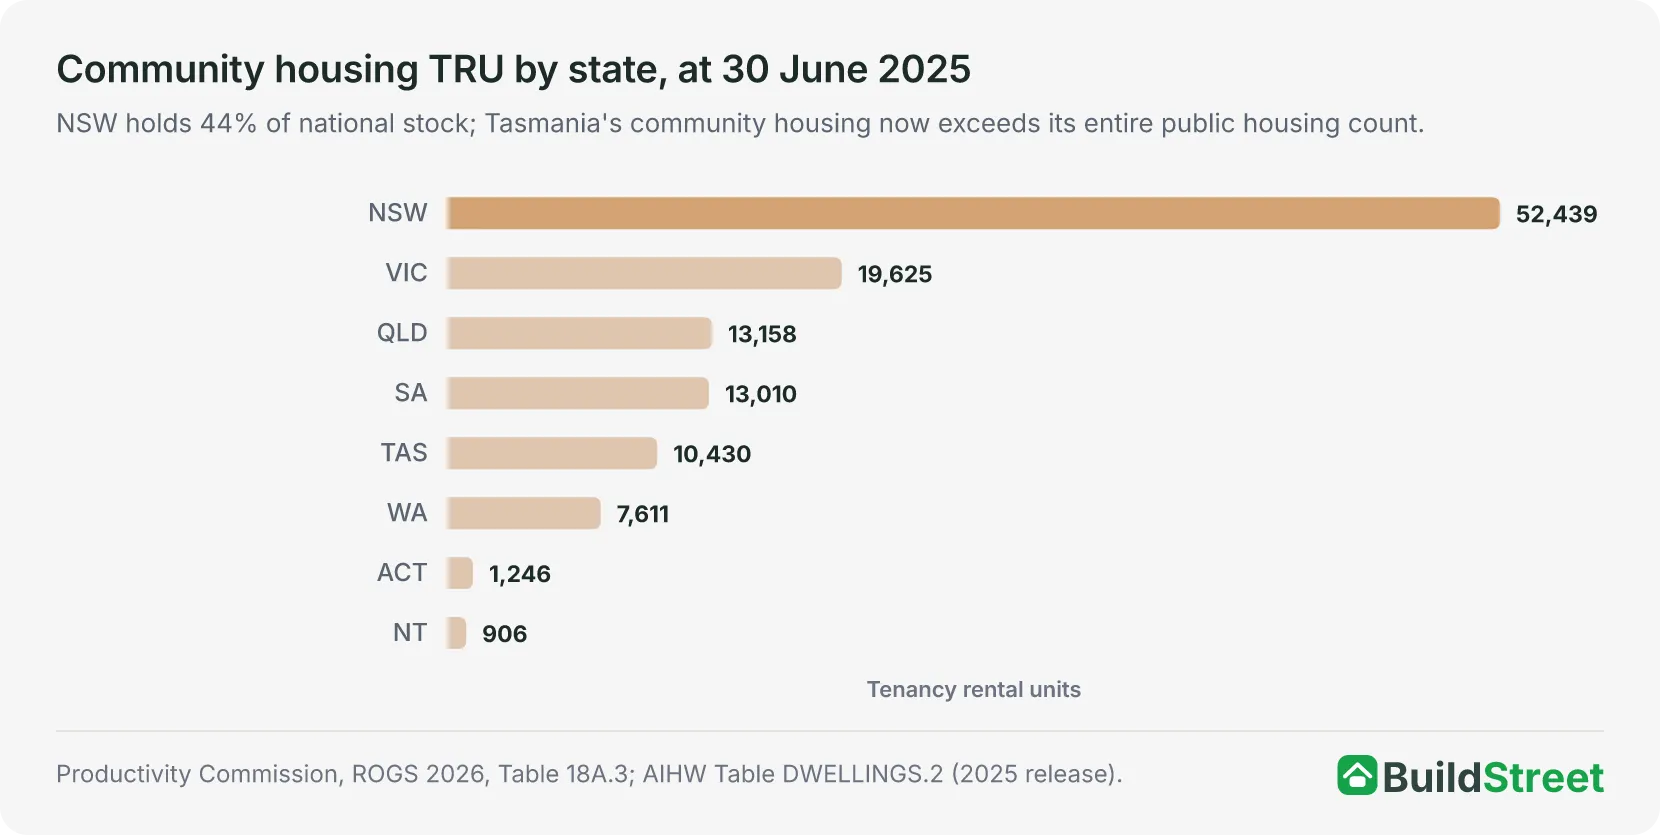
South Australia and Queensland had similar-sized community housing sectors at June 2025, with 13,010 TRU in South Australia and 13,158 TRU in Queensland. South Australia's relatively large community housing stock partly reflects its 2017–18 transfer programme, which moved around 4,000 public and Indigenous housing dwellings to community housing management.
Western Australia added 202 TRU between 2016 and 2025, an increase of 2.7%. This was the smallest absolute increase of any state over the period. The low growth suggests Western Australia has made less use of large-scale transfers to community housing providers than some other jurisdictions.
Tasmania's community housing system is now more than double its public housing stock, with 10,430 community housing TRU compared with 5,051 public housing dwellings at June 2025. This follows the transfer of approximately 2,000 public housing dwellings to community housing provider management in 2021–22.
| State / territory | TRU (June 2025) | TRU (June 2016) | Change | % change |
|---|---|---|---|---|
| New South Wales | 52,439 | 32,266 | +20,173 | +62.5% |
| Victoria | 19,625 | 14,236 | +5,389 | +37.9% |
| Queensland | 13,158 | 11,679 | +1,479 | +12.7% |
| South Australia | 13,010 | 7,472 | +5,538 | +74.1% |
| Tasmania | 10,430 | 6,076 | +4,354 | +71.7% |
| Western Australia | 7,611 | 7,409 | +202 | +2.7% |
| ACT | 1,246 | 715 | +531 | +74.3% |
| Northern Territory | 906 | 373 | +533 | +142.9% |
| Australia total | 118,425 | 80,226 | +38,199 | +47.6% |
Source · Productivity Commission, ROGS 2026, Table 18A.3.
Show full table
| Community housing TRU by state and territory, 2016 to 2025 | |||||||||
|---|---|---|---|---|---|---|---|---|---|
| Year | NSW | VIC | QLD | WA | SA | TAS | ACT | NT | Total |
| 2016 | 32,266 | 14,236 | 11,679 | 7,409 | 7,472 | 6,076 | 715 | 373 | 80,226 |
| 2017 | 34,398 | 14,278 | 11,512 | 7,847 | 7,484 | 6,115 | 883 | 385 | 82,902 |
| 2018 | 35,345 | 14,486 | 11,116 | 8,062 | 11,561 | 5,980 | 895 | 374 | 87,819 |
| 2019 | 46,557 | 15,081 | 10,941 | 7,968 | 11,622 | 6,698 | 907 | 431 | 100,205 |
| 2020 | 49,509 | 14,857 | 11,054 | 8,005 | 12,151 | 6,919 | 936 | 464 | 103,895 |
| 2021 | 53,233 | 14,996 | 11,439 | 7,997 | 12,387 | 7,019 | 970 | 478 | 108,519 |
| 2022 | 54,292 | 16,159 | 11,524 | 7,718 | 12,430 | 9,267 | 958 | 495 | 112,843 |
| 2023 | 53,913 | 16,363 | 11,665 | 7,978 | 12,333 | 9,715 | 1,695 | 488 | 114,150 |
| 2024 | 54,412 | 18,191 | 12,548 | 8,012 | 13,048 | 10,139 | 1,736 | 731 | 118,817 |
| 2025 | 52,439 | 19,625 | 13,158 | 7,611 | 13,010 | 10,430 | 1,246 | 906 | 118,425 |
Source · Productivity Commission, ROGS 2026, Table 18A.3.
Section 05 · Sector structure
Fewer community housing providers are managing more homes
The number of reporting community housing organisations fell by 25% between 2016 and 2024, from 704 to 531. Over the same period, total community housing stock grew by 48%. This means fewer providers are managing a larger share of the sector's housing.
Average portfolio size also increased, from approximately 114 dwellings per reporting provider in 2016 to approximately 224 in 2024.
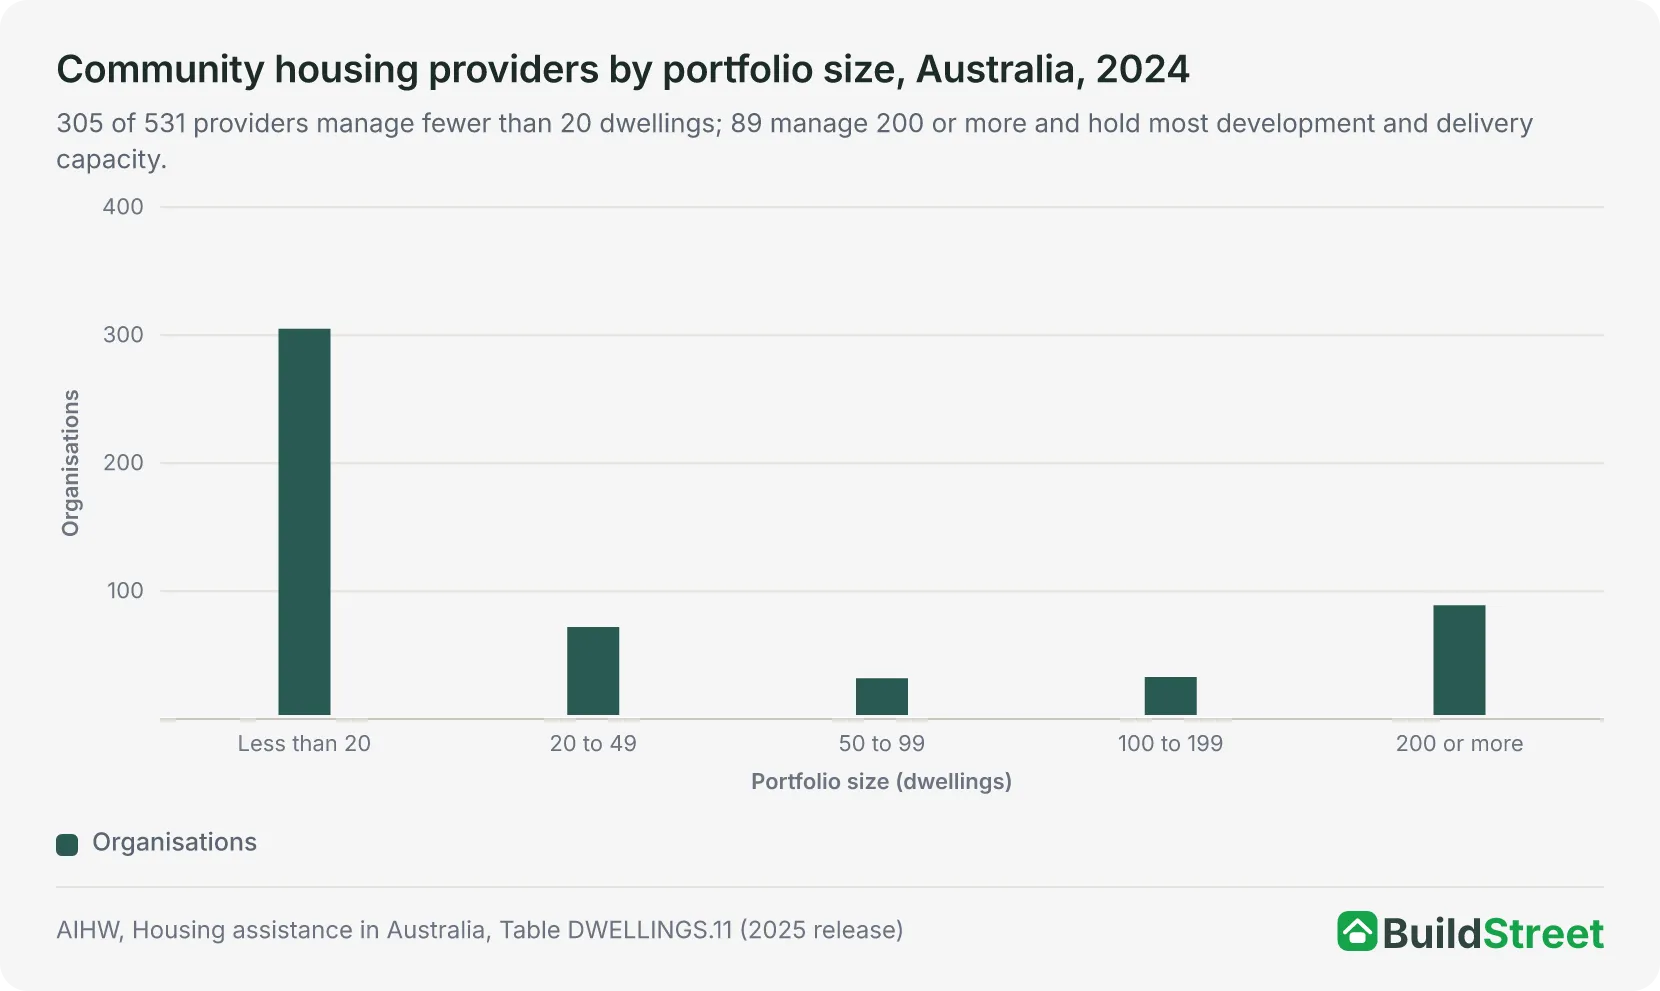
| Provider size | Number | Share | Capacity context |
|---|---|---|---|
| Fewer than 20 dwellings | 305 | 57.4% | Small specialist or local providers; limited development capacity |
| 20 to 99 dwellings | 104 | 19.6% | Mid-scale providers; focused on one community or programme type |
| 100 to 199 dwellings | 33 | 6.2% | Regional or niche providers with developing capacity |
| 200 or more dwellings | 89 | 16.8% | Large CHPs; hold most development and HAFF/NHAF delivery capacity |
| Total | 531 | 100% |
Source · AIHW, Housing assistance in Australia, Table DWELLINGS.11 (2025 release).
Provider concentration may matter for new supply programmes. If a large share of contracted Housing Australia Future Fund and National Housing Accord Facility homes is managed by larger providers, their portfolios may grow further. The measured effect will depend on which organisations manage the homes, whether they are social or affordable housing, and how they are reported in official data.
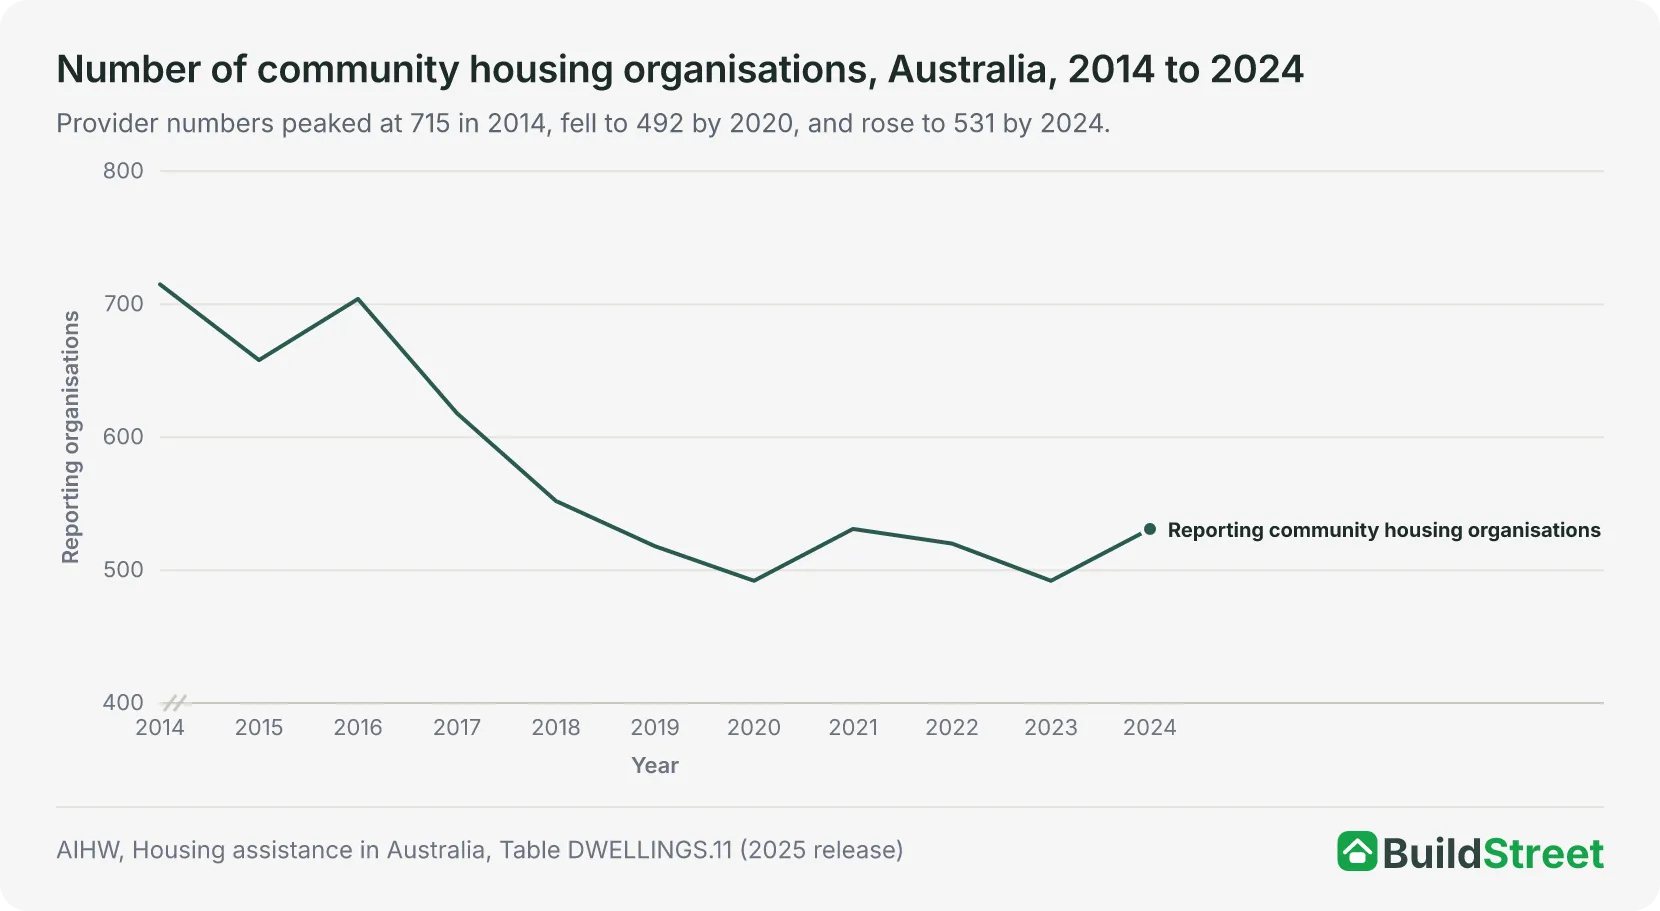
Show table · Counts reporting community housing organisations only. Between 2014 and 2024, the total provider count fell from 715 to 531, while the number of providers managing 200 or more dwellings rose from 61 to 89.
| Provider count by portfolio size, 2014 to 2024 | |||||||
|---|---|---|---|---|---|---|---|
| Year | <20 | 20–49 | 50–99 | 100–199 | 200+ | Total | 200+ share |
| 2014 | 473 | 107 | 46 | 28 | 61 | 715 | 8.5% |
| 2015 | 425 | 107 | 38 | 26 | 62 | 658 | 9.4% |
| 2016 | 442 | 118 | 44 | 31 | 67 | 704 | 9.5% |
| 2017 | 362 | 106 | 47 | 32 | 71 | 618 | 11.5% |
| 2018 | 301 | 98 | 51 | 29 | 73 | 552 | 13.2% |
| 2019 | 275 | 94 | 43 | 28 | 78 | 518 | 15.1% |
| 2020 | 254 | 89 | 45 | 26 | 78 | 492 | 15.9% |
| 2021 | 299 | 86 | 38 | 30 | 78 | 531 | 14.7% |
| 2022 | 296 | 75 | 35 | 31 | 83 | 520 | 16.0% |
| 2023 | 269 | 74 | 35 | 31 | 83 | 492 | 16.9% |
| 2024 | 305 | 72 | 32 | 33 | 89 | 531 | 16.8% |
Source · AIHW, Housing assistance in Australia, Table DWELLINGS.11 (2025 release).
Section 06 · Policy rationale
Why governments use community housing providers
Government net recurrent expenditure on community housing was $5,024 per household in 2024–25, compared with $15,510 per public housing household. This difference reflects the way each programme is funded and should not be read as a direct comparison of service costs.
Three features help explain the community housing funding model:
Commonwealth Rent Assistance access
Community housing tenants can receive Commonwealth Rent Assistance, while public housing tenants generally cannot. In 2024, around 89,600 households in community housing were receiving CRA. This payment forms part of the rent paid to the provider, but it is not recorded as state or territory housing expenditure.
Private and institutional finance
Larger community housing providers can borrow against their property portfolios and raise funds through private markets. This can help fund additional housing projects alongside government grants, concessional finance, land contributions and other public support.
Ownership, management and maintenance responsibilities
Maintaining public housing is an ongoing cost for state and territory governments. Where homes are transferred to community housing providers, some ownership, management or maintenance responsibilities may also move to the provider, depending on the terms of the transfer. Several states have used property transfers, capital grants or long-term agreements to support community housing delivery.
Government spending figures are not a like-for-like cost comparison
Government recurrent spending per public housing household was $15,510 in 2024–25. This covers management, maintenance and tenancy services, but excludes capital construction and major works. The equivalent figure for community housing was $5,024. This covers direct grants and subsidies to providers, but excludes Commonwealth Rent Assistance paid to tenants and private financing costs carried by providers.
Section 07 · Tenants
Who lives in community housing in Australia?
At 30 June 2024, 92.1% of Australia's 107,637 community housing households were on low incomes, and 78.8% had a government payment as their main income source. Compared with public housing tenants, community housing tenants were more likely to be under 35 and less likely to have a disability.
| Characteristic (main tenant, 2024) | Community housing | Public housing |
|---|---|---|
| Household composition | ||
| Single adult households | 62.5% | 58.1% |
| Sole parent with dependent children | 10.7% | 13.0% |
| Age of main tenant | ||
| Aged 55 years or over | 49.8% | 59.1% |
| Aged 65 years or over | 29.8% | 36.4% |
| Under 35 years | 15.2% | 10.1% |
| Income and disadvantage | ||
| Classified as low income | 92.1% | 96.0% |
| Main income: government payment | 78.8% | 85.8% |
| Main income: employment | 11.5% | 6.6% |
| With a disability | 29.0% | 42.3% |
| Indigenous status | 10.7% | 14.2% |
| Female main tenant | 60.4% | 63.0% |
Source · AIHW, Housing assistance in Australia, Table HOUSEHOLDS.4 (2025 release).
Dwelling suitability in community housing
In 2024, 3.6% of community housing households with suitability data were in overcrowded dwellings, compared with 4.6% of public housing households. Community housing also had a higher share of households in suitable or adequate dwellings, at 83.3% compared with 78.3% in public housing.
| Dwelling suitability (2024) | Community housing | Public housing |
|---|---|---|
| Overcrowded | 3.6% | 4.6% |
| Underutilised | 10.6% | 16.5% |
| Suitable or adequate | 83.3% | 78.3% |
| Unknown or not stated | 2.6% | 0.6% |
Source · AIHW, Housing assistance in Australia, Table SUITABILITY.1 (2025 release).
Section 08 · Expenditure
How much do governments spend on community housing?
State and territory governments spent $1.33 billion on community housing in 2024–25. This included $540.8 million in net recurrent expenditure and $790.3 million in capital expenditure. Capital spending was concentrated in Queensland and Victoria, which together accounted for $788.9 million of the $790.3 million national capital total.
| State / territory | Net recurrent ($m) | Capital ($m) | Total ($m) |
|---|---|---|---|
| New South Wales | 101.3 | 0.1 | 101.4 |
| Victoria | 189.4 | 287.1 | 476.5 |
| Queensland | 103.9 | 501.8 | 605.7 |
| Western Australia | 12.6 | n/a | 12.6 |
| South Australia | 50.2 | 0 | 50.2 |
| Tasmania | 72.1 | 1.3 | 73.4 |
| ACT | 11.3 | 0 | 11.3 |
| Northern Territory | n/a | n/a | n/a |
| Australia total | 540.8 | 790.3 | 1,331.1 |
Source · Productivity Commission, ROGS 2026, Table 18A.1.
Show table · All figures are in constant 2024–25 dollars (inflation-adjusted). Capital expenditure varies year to year and should not be interpreted as a stable trend.
| Community housing expenditure trend, 2022–23 to 2024–25 | ||||
|---|---|---|---|---|
| Financial year | Net recurrent ($m) | Capital ($m) | Total ($m) | Recurrent per household |
| 2022–23 | 637.6 | 688.4 | 1,326.0 | $6,214 |
| 2023–24 | 606.8 | 884.7 | 1,491.5 | $5,781 |
| 2024–25 | 540.8 | 790.3 | 1,331.1 | $5,024 |
Source · Productivity Commission, ROGS 2026, Table 18A.1; AIHW, Housing assistance in Australia, Table HOUSEHOLDS.1 (2025 release).
NSW recorded $0.1 million in community housing capital expenditure in 2024–25. Some national housing programme spending may be recorded outside state and territory housing budgets, so state capital expenditure figures should not be read as a complete measure of all funding flowing into community housing. The recurrent figures also do not capture CRA, which flows to tenants and then to providers but does not appear in state expenditure data.
Rental stress defined as rent-to-income ratio above 30%. Housing organisations include community housing providers and comparable non-government rental providers. Source: AIHW, Housing assistance in Australia, Table CRA.8 (2025 release).
The lower rental stress rate for CRA recipients in housing organisations is likely influenced by rent-setting rules. Community housing rents are generally set as a share of household income rather than full market rent, which can reduce rental stress compared with private rental households receiving CRA.
Section 09 · New supply pipeline
New social and affordable housing supply: Housing Australia Future Fund and National Housing Accord Facility
As at November 2025, 18,650 homes had been contracted under the Housing Australia Future Fund and National Housing Accord Facility. Of these, 9,501 were under construction and approximately 1,432 had been completed. These figures represent signed agreements and delivery progress, not completed additions to the community housing data series.
Community housing providers are central to delivery. Round 3, targeting the remaining 21,350 homes, opened in January 2026.
$10 billion HAFF · 5-year target: 40,000 homes · Deadline: mid-2029
Methodology: Contracted figures represent signed agreements only; homes are not yet built or tenanted. Contracted does not equal completed. Source: Housing Australia, HAFF/NHAF Rounds 1 and 2 contract update, November 2025.
Contracted homes stand at 18,650 of the 40,000-home five-year target (46.6%). Measured against current community housing stock of 118,817 TRU, contracted homes represent 15.7%.
Scenario only: not all contracted homes will be classified as community housing TRU.
Social housing and affordable housing are counted differently
Social housing under HAFF and NHAF is priced at 25 to 30% of household income and reserved for people with the greatest need, including those experiencing homelessness, family violence, disability, or very low income. Affordable housing through the same programmes is priced at around 80% of local market rent and targets low-to-moderate income earners who may not qualify for social housing. Only social housing is counted in the national social housing data series.
Affordable housing may be delivered by community housing providers, but it is not counted as community housing TRU in the same way.
Social housing rent
25–30% of household income
Affordable housing rent
80% approx. of local market rent
Of the 40,000 homes targeted under HAFF/NHAF over five years, 20,000 are social housing, and 20,000 are affordable housing. This means the full 40,000-home target should not be treated as a direct addition to community housing TRU.
The measured effect on community housing stock will depend on how many homes are completed, whether they are social or affordable housing, who manages them, and how they are reported in official data.
Section 10 · Limits and context
What are the limits of community housing growth?
UNSW City Futures research estimates that around 640,000 Australian households were without adequate housing in 2021, with projections rising to nearly 940,000 by 2041. The 40,000-home HAFF/NHAF target is large, but it remains small relative to these estimates of unmet housing need.
Community housing has grown over two decades, but several structural factors constrain how far and how fast the sector can expand.
Scale of need
The HAFF target addresses a fraction of estimated housing need. Based on UNSW City Futures / CHIA estimates, housing need is projected to reach nearly 940,000 households by 2041. The 40,000-home HAFF/NHAF target remains small relative to estimates of unmet housing need, but the two figures are not directly comparable because the target includes both social and affordable housing.
Construction capacity
Delivery capacity is concentrated among large providers. Most development capability sits with the 89 largest providers. Smaller and mid-tier CHPs often lack the in-house expertise to manage large construction projects. Large housing projects can be affected by construction costs, financing conditions and delivery timelines. These factors may influence how quickly community housing providers can move projects from funding commitment to completion.
Private financing exposure
Private debt introduces interest rate and project risk. The ability to use private finance is also a source of risk. CHPs borrowing to fund construction are exposed to interest rate changes and construction cost overruns in ways that state housing authorities are not.
Social vs affordable distinction
Half the HAFF pipeline may not appear in social housing statistics. Half of the 40,000 HAFF/NHAF target homes are affordable housing, charged at around 80% of market rent rather than as a share of household income. These are not counted in the social housing data series. If a large share of contracted homes falls into this category, the sector's measured growth will be smaller than the headline pipeline figures suggest.
Public subsidy remains essential
The CHP model reduces but does not remove government funding requirements. CRA, capital grants, concessional finance, planning concessions, and land contributions all play a role in making community housing viable. The CHP model changes the way government support flows into housing, but it does not remove the need for ongoing public funding. Below-market rents require ongoing subsidy, regardless of who manages the properties.
Section 11 · Frequently asked questions
Common questions about community housing in Australia
Community housing providers managed 118,817 TRU at June 2024, a 291% increase since 2005.
How many community housing dwellings are there in Australia?
Australia had 118,817 community housing tenancy rental units (TRU) at 30 June 2024, of which 107,637 were occupied. The most recent figure (June 2025) is 118,425 TRU. TRU counts households, not buildings: one house split into two tenancies counts as two TRU but one dwelling.
Is community housing the same as public housing?
No. Public housing is owned and managed directly by state and territory housing authorities. Community housing is managed by not-for-profit providers. Both charge below-market rents and serve low-income Australians. A key difference: community housing tenants may receive Commonwealth Rent Assistance, while public housing tenants generally cannot.
Does growth in community housing mean new homes are being built?
Not necessarily. Community housing TRU growth reflects new construction, stock transfers (existing public housing reclassified to CHP management), and programme expansions. The two largest single-year increases (SA in 2017–18 and NSW in 2018–19) added approximately 15,000 TRU to community housing but did not increase total social housing supply. Those properties moved management categories, not locations.
Which state has the most community housing?
New South Wales held 52,439 TRU at 30 June 2025, approximately 44% of the national total. South Australia has a disproportionately large share relative to population. Tasmania has the highest ratio of community housing to public housing stock of any state, with community housing more than double its public housing count.
Can community housing tenants receive Commonwealth Rent Assistance?
Most community housing tenants can receive CRA because they rent from a non-government provider. In 2024, around 89,600 households in community housing were receiving CRA. Of those, 12.8% were in rental stress, compared with 50.5% of people receiving CRA in the private rental market, reflecting community housing's income-linked rent model.
How much does government spend on community housing?
State and territory governments spent $1.33 billion on community housing in 2024–25: $540.8 million net recurrent and $790.3 million capital. Net recurrent expenditure per community housing household was $5,024, compared with $15,510 per public housing household. This difference reflects the different funding arrangements of each programme, not a direct comparison of services provided.
Will HAFF increase community housing stock?
It is likely to, but the measured impact depends on classification and delivery. As of November 2025, 18,650 homes have been contracted. However, the target includes 20,000 affordable homes that are not counted in social housing data. The measured increase in community housing TRU will depend on the final social/affordable split and delivery timelines.
How does HAFF affordable housing differ from community housing?
Social housing under HAFF/NHAF charges income-linked rents (around 25–30% of household income) and targets households with the highest housing need. Affordable housing charges below-market rents (around 80% of local market rates) and targets low- to moderate-income workers who do not qualify for social housing. Social housing flows into the AIHW community housing data series; affordable housing does not. Both can be delivered by CHPs. Only social housing homes count toward the AIHW community housing TRU figures.
References
- Australian Institute of Health and Welfare (AIHW), Housing assistance in Australia 2025 · aihw.gov.au
- Productivity Commission, Report on Government Services 2026 — Part G Section 18 Housing data tables (June 2026 release) · pc.gov.au
- Housing Australia — Funding under the Housing Australia Future Fund Facility and National Housing Accord Facility · housingaustralia.gov.au
- UNSW City Futures Research Centre / CHIA — Quantifying Australia's unmet housing need: a national snapshot · unsw.edu.au
