

Published 24 June 2026
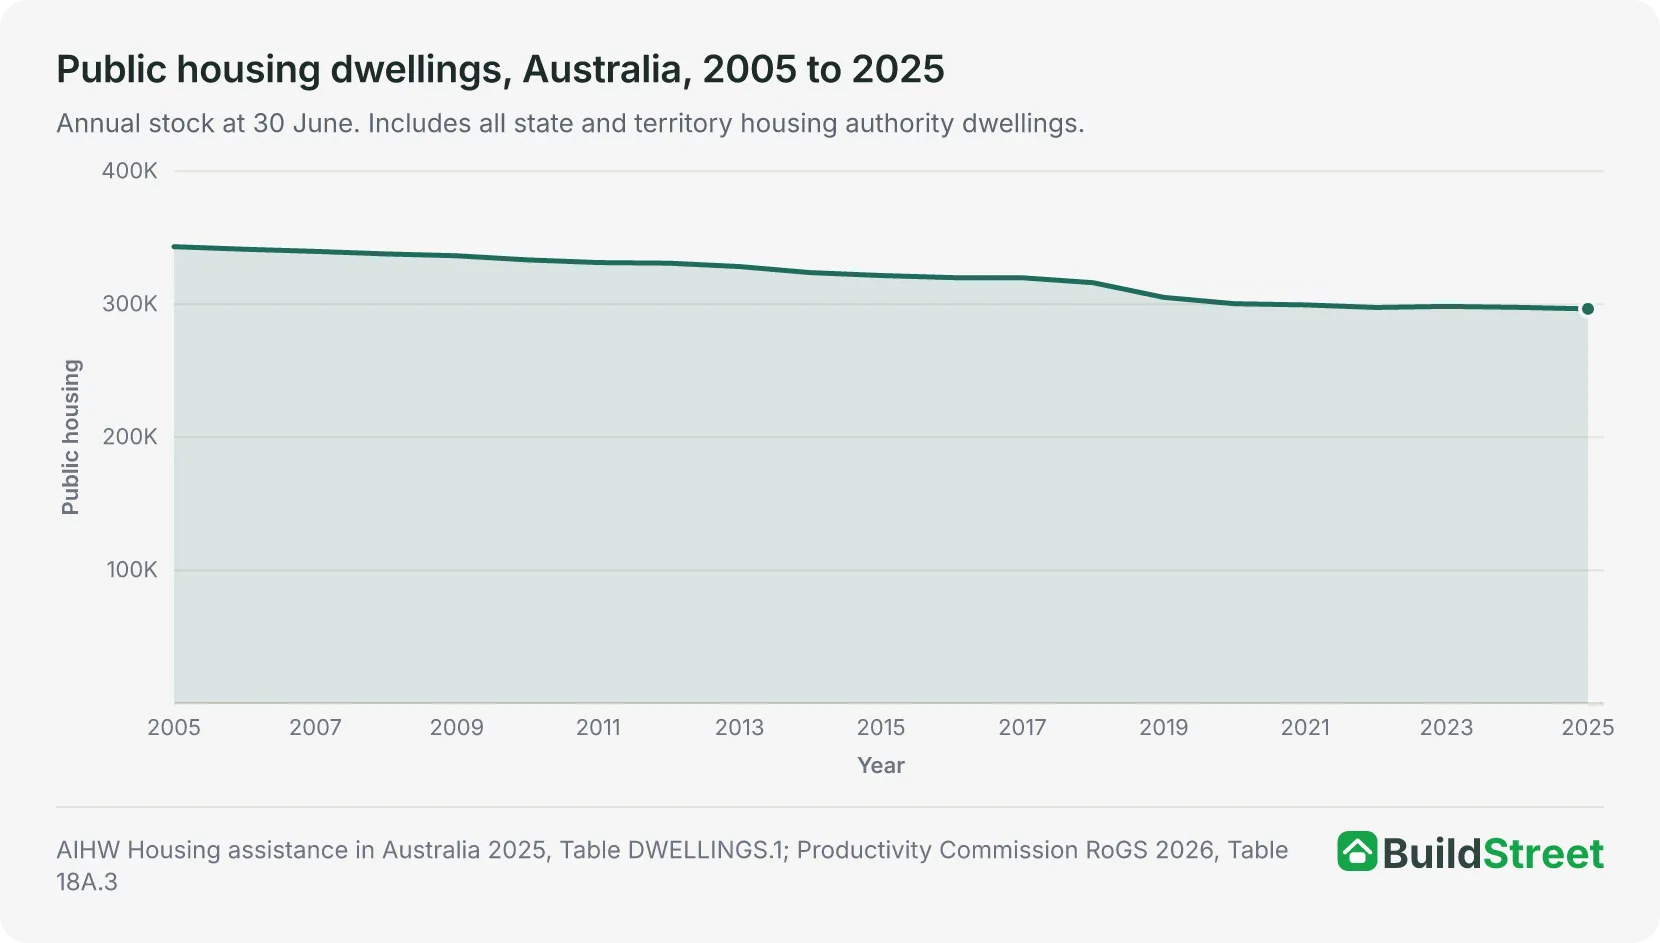
The national public housing waitlist reached 189,536 households at 30 June 2025, up 12.5% in a single year and the highest level in the comparable series since 2014. At the same time, Australia’s public housing stock has fallen from 343,301 dwellings in 2005 to 296,541 in 2025, a decline of 13.6% over two decades.
Of those households, 77,425 are classified as greatest need: meaning they are homeless, their safety is at risk, or their housing is seriously affecting their health. In 2024–25, 16,016 households were newly allocated to public housing, making the waitlist almost 12 times larger than annual allocations.
 How many social and affordable homes are built in Australia each year?Australia had 450,607 social housing dwellings at 30 June 2025, spanning all four programme types: public housing, community housing, state-owned and managed Indigenous housing (SOMIH) and Indigenous…
 Community housing in Australia: growth and new supplyCommunity housing providers managed 118,817 tenancy rental units at 30 June 2024, up from 30,392 in 2005. Over the same period, community housing's share of Australia's social housing system rose from…
What is the difference between public housing and community housing?
Public housing is owned and managed directly by state and territory housing authorities. Community housing is managed by not-for-profit providers. Both are social housing, but community housing tenants can access Commonwealth Rent Assistance; public housing tenants cannot.
Why is the public housing waitlist at a decade high?
The waitlist rose by 20,984 households in 2024–25, with Queensland (+28.1%) and New South Wales (+16.5%) recording the largest state-level increases. New public housing allocations totalled 16,016 households in the same year, less than one-twelfth of the national waitlist at 30 June 2025.
Section 01 · WHAT IS PUBLIC HOUSING
What is public housing in Australia?
Public housing is rental accommodation owned and managed by state and territory government housing authorities. It is provided to low-income households and people with high housing needs, and is one of four programmes that make up Australia’s social housing system, alongside community housing (managed by not-for-profit providers), state-owned and managed Indigenous housing (SOMIH), and Indigenous community housing (ICH).
At June 2024, public housing accounted for 65.9% of all social housing dwellings nationally, down from 88.8% in 2005 as community housing has grown.
Several features distinguish public housing from other housing types:
- Income-based rent: Tenants usually pay rent based on assessable household income, often around 25% depending on the jurisdiction and household circumstances, rather than paying full market rent.
- State ownership: The properties are owned or long-term leased by the state or territory government. This is the defining difference from community housing, where a not-for-profit organisation manages the stock.
- Needs-based eligibility: Applications are assessed against income thresholds and housing need. Priority is given to households experiencing homelessness, escaping family violence, living with disability, or otherwise at high risk.
- Ongoing tenancy: Unlike crisis or transitional accommodation, public housing typically offers ongoing or long-term tenancies. More than 44% of public housing households have lived in their current property for at least 10 years.
Public housing, social housing and community housing: what’s the difference?
Australia has four main social housing programmes. Each is funded and managed differently.
| Program | Who manages it | Key features |
|---|---|---|
| Public housing | State and territory housing authorities | Direct government management; largest programme; rent set as a proportion of income |
| SOMIH | State housing authorities (Indigenous-specific) | State-owned and managed Indigenous housing; concentrated in Queensland and the NT |
| Community housing | Not-for-profit community housing providers | Tenants eligible for Commonwealth Rent Assistance; has grown since 2005 |
| Indigenous community housing | Indigenous community organisations | Managed by funded and unfunded providers; significant data quality limitations apply |
| Affordable housing (below-market rentals for low-to-moderate income earners) is a separate category and not social housing, and is not part of the data reported here. | ||
Public housing tenants pay rent calculated as a share of their gross household income rather than at market rates. In 2024–25, 93.4% of public housing households paid below-market rent, with the remainder in market-rate or other arrangements.
Section 02 · NATIONAL STOCK
How much public housing does Australia have?
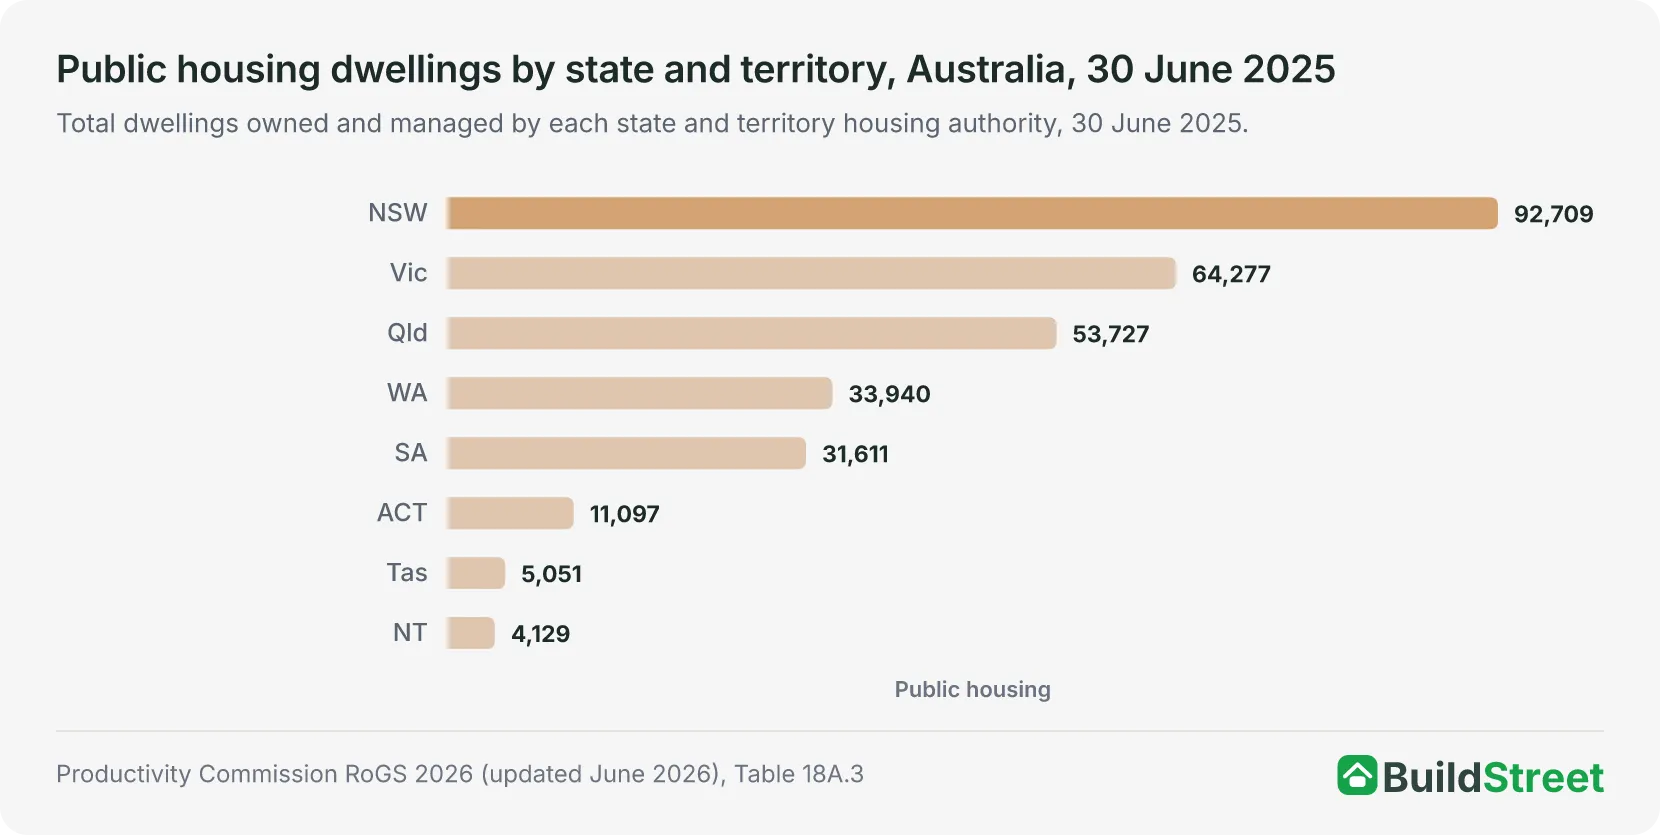
At 30 June 2025, Australia had 296,541 public housing dwellings, down from 297,684 at June 2024. New South Wales had the largest stock with 92,709 dwellings, followed by Victoria (64,277) and Queensland (53,727).
Of the total stock, 286,755 dwellings were occupied, giving a national occupancy rate of 96.7%. The remainder were vacant, under repair, awaiting allocation or being redeveloped. State and territory governments also spent $3.51 billion on capital works in 2024–25, covering construction, maintenance and acquisitions.
Public housing stock has fallen from 343,301 dwellings in 2005 to 296,541 in 2025, a reduction of 46,760 dwellings, or 13.6%, over two decades. The decline has been gradual rather than sudden, although several transfer years stand out.
South Australia transferred around 3,820 dwellings to community housing in 2017–18. New South Wales transferred public housing stock to community housing in 2018–19 and to SOMIH in 2023–24 and 2024–25. Tasmania transferred approximately 2,000 dwellings in 2021–22.
When a dwelling is transferred to community housing, it is no longer counted as public housing. However, it remains part of the broader social housing system if it continues to be used for social housing.
- 296,541
- Total public housing dwellings nationally
- 286,755
- Occupied by households (96.7% occupancy rate)
- $4.44bn
- Government recurrent spending on public housing, 2024–25
| Historical stock by year, 2005–2025 | ||||
|---|---|---|---|---|
| Year (30 June) | Public housing dwellings | Community housing units | Total social housing | PH share (%) |
| 2005 | 343,301 | 30,392 | 386,553 | 88.8% |
| 2007 | 339,771 | 34,672 | 409,559 | 83.0% |
| 2009 | 336,464 | 39,770 | 413,153 | 81.4% |
| 2011 | 331,371 | 57,506 | 421,005 | 78.7% |
| 2013 | 328,340 | 67,385 | 428,030 | 76.7% |
| 2015 | 321,627 | 73,620 | 427,774 | 75.2% |
| 2016 | 320,041 | 80,226 | 432,846 | 73.9% |
| 2017 | 319,913 | 82,902 | 435,661 | 73.4% |
| 2018 | 316,231 | 87,819 | 436,213 | 72.5% |
| 2019 | 305,191 | 100,205 | 437,718 | 69.7% |
| 2020 | 300,403 | 103,895 | 436,333 | 68.8% |
| 2021 | 299,520 | 108,519 | 440,192 | 68.0% |
| 2022 | 297,600 | 112,843 | 442,752 | 67.2% |
| 2023 | 298,404 | 114,150 | 445,622 | 67.0% |
| 2024 | 297,684 | 118,817 | 451,754 | 65.9% |
| 2025 | 296,541 | 118,425 | — | — |
Source · AIHW Housing assistance in Australia 2025, Table DWELLINGS.1; Productivity Commission RoGS 2026, Table 18A.3. Community housing figures are tenancy rental units. 2025 total social housing not yet available from AIHW.
Section 03 · THE SYSTEM SHIFT
Public housing vs community housing in Australia
Public housing’s share of the social housing system fell from 88.8% in 2005 to 65.9% in 2024. Over the same period, community housing tenancy units increased from 30,392 to 118,817, almost four times the 2005 level.
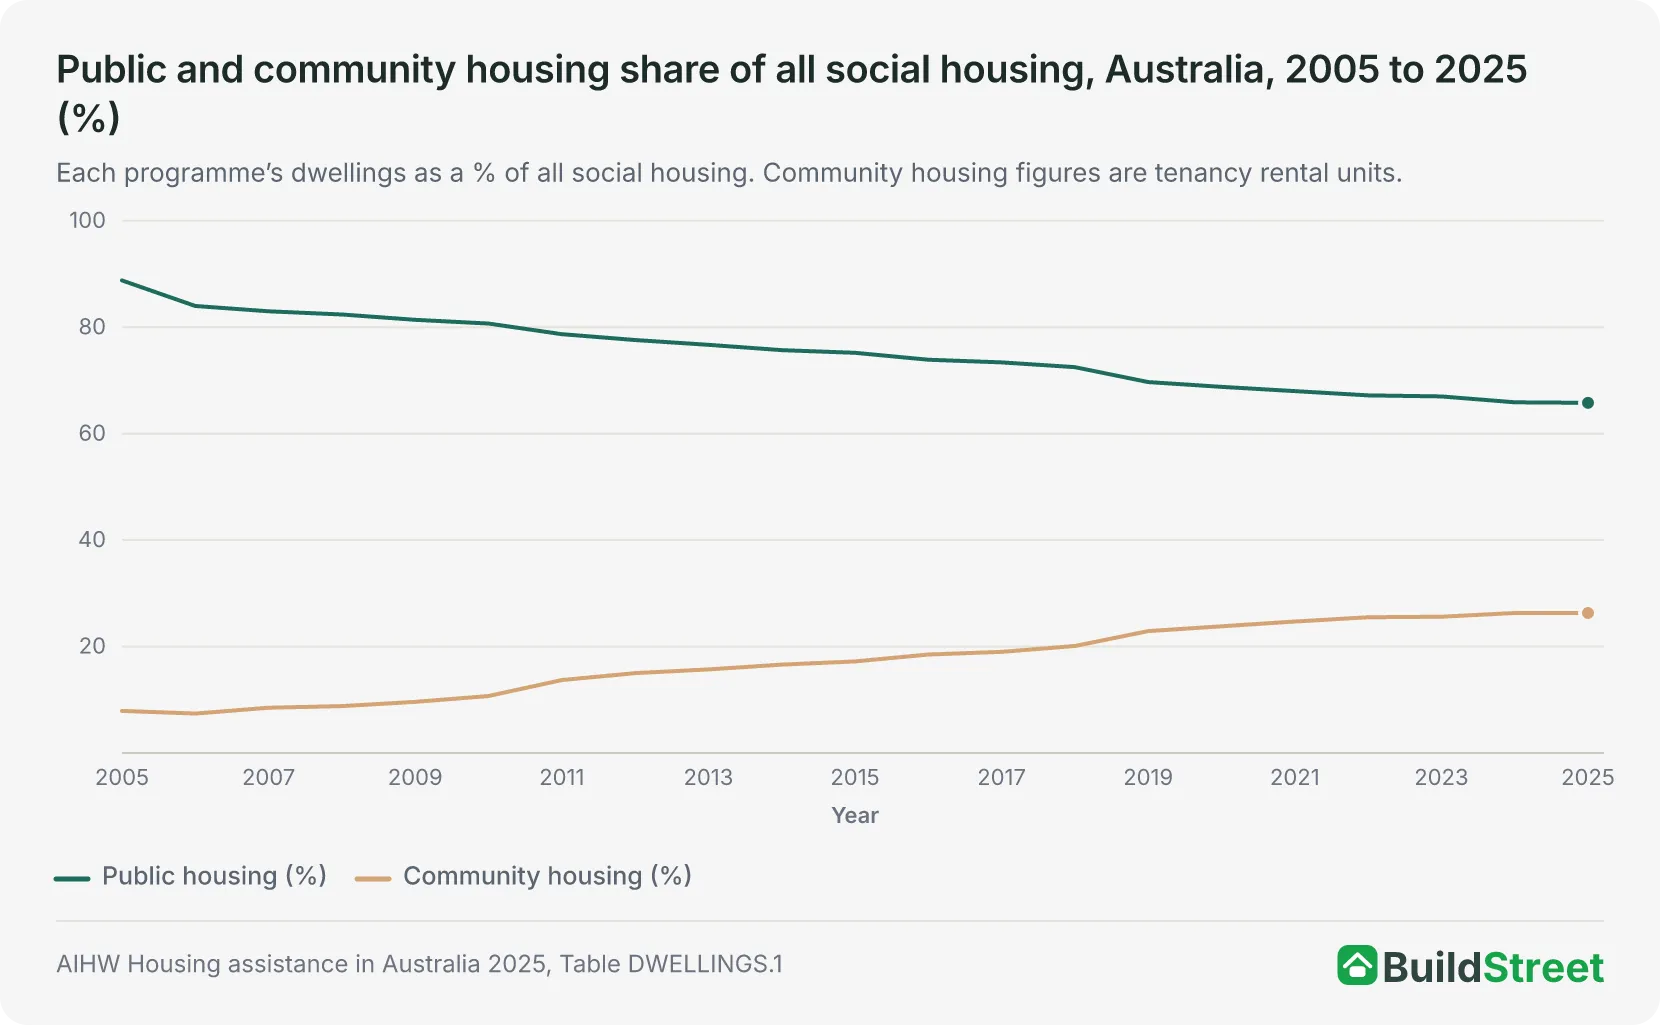
The shift toward community housing management reflects changes in how social housing is funded and managed. Tenants in community housing can receive Commonwealth Rent Assistance, which increases the income available to providers. Stock transfers and targeted funding programmes have contributed to the growth of community housing capacity.
Several large transfers account for some of the largest falls in public housing stock. South Australia moved 3,820 dwellings to community housing in 2017–18, contributing to that state’s fall from around 37,000 to 33,000 dwellings. Tasmania transferred approximately 2,000 dwellings in 2021–22, reducing its public housing count from 7,031 to around 5,000. These dwellings remained in the broader social housing system if they continued to be used for social housing.
How has public housing declined over time?
Australia’s public housing stock has declined in absolute terms since at least 2005, falling from 343,301 dwellings to 297,684 at June 2024, then to 296,541 at June 2025.
The decline has not been steady. Between 2005 and 2018, the stock fell gradually. The steepest single-year drop came between June 2018 and June 2019, when national public housing fell by 11,040 dwellings. This was driven by New South Wales, which transferred approximately 10,700 properties to community housing providers under its Future Directions for Social Housing policy.
Since 2019, the pace of decline has slowed. Between 2019 and 2025, the national stock fell by 8,650 dwellings, or 2.8%. Some states added to their public housing portfolios over this period, including Queensland, which grew by about 1,900 dwellings, and Western Australia, which grew by around 1,035.
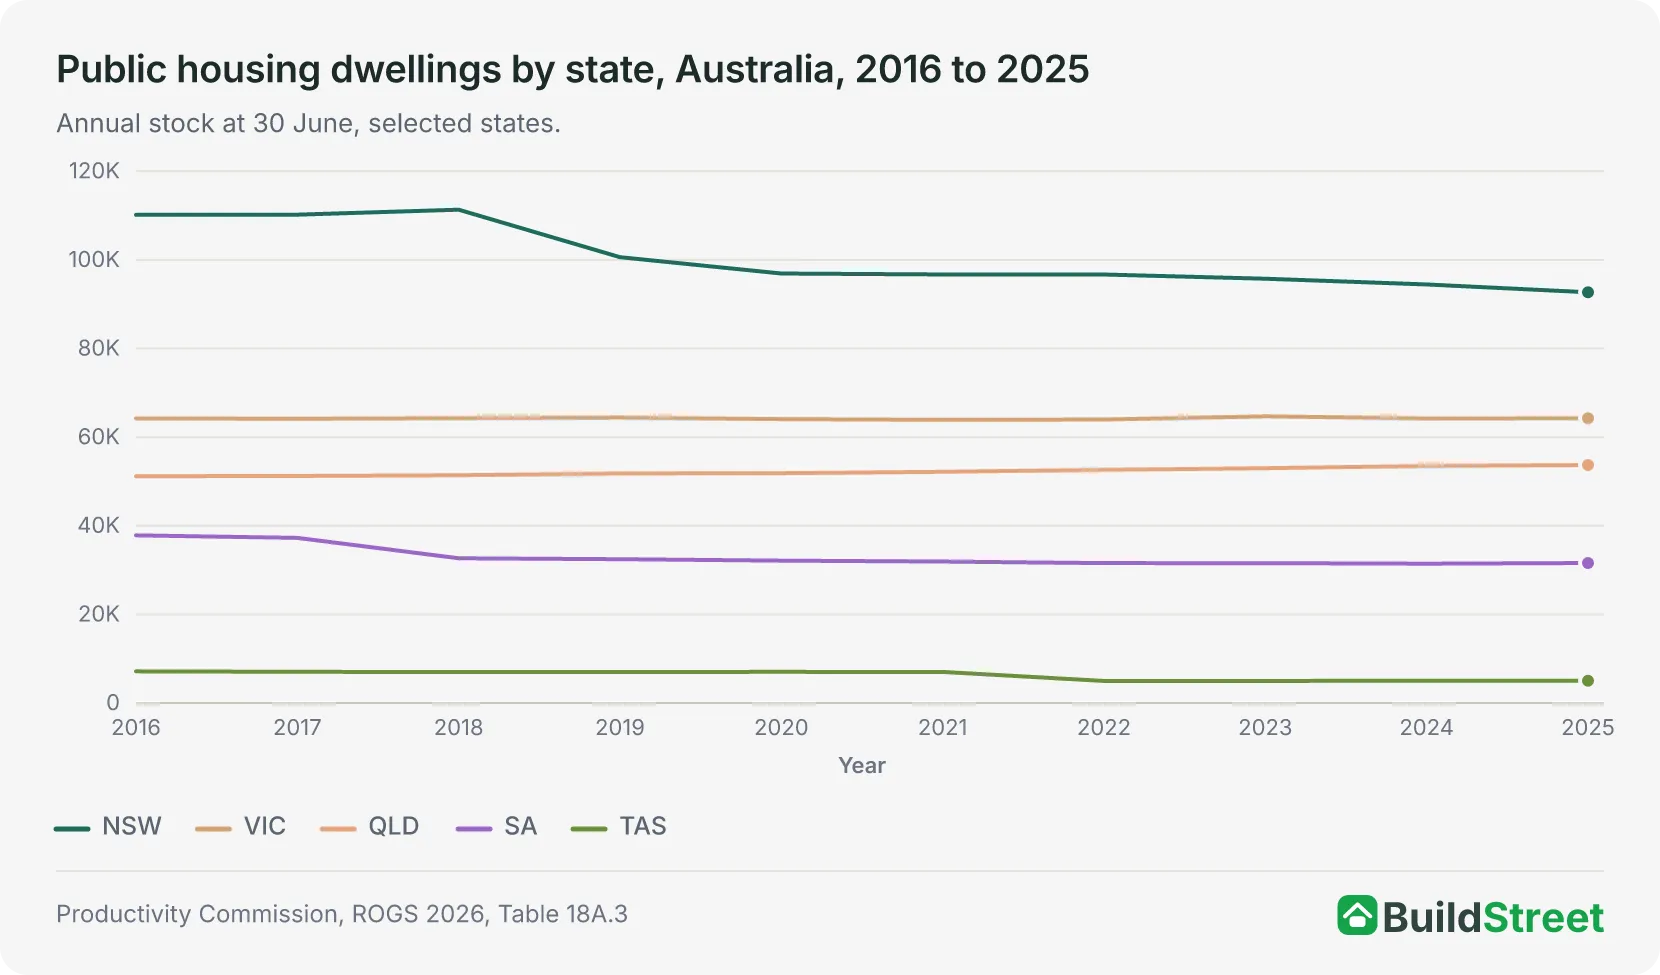
Tasmania recorded the largest percentage fall of any state. Its public housing stock fell from 7,166 dwellings in 2016 to 5,051 in 2025, a decline of 29.5%. The biggest single drop came in 2021–22, when Tasmania transferred 2,027 properties to community housing providers, equal to around 28% of its stock at the time.
South Australia reduced its portfolio from 37,852 dwellings in 2016 to 31,611 in 2025, a fall of 16.5%, partly through property sales and transfers. Victoria, by contrast, held its stock almost steady over this period.
Section 04 · WHY THE STOCK SHIFTED
Why has public housing been transferred to community housing?
At least 5,115 dwellings were formally transferred from public to community housing nationally between 2020–21 and 2024–25. Much larger transfers happened in earlier years. When a property is transferred, it leaves the public housing count but can remain within the social housing system. Three main factors have driven this shift.
Access to Commonwealth Rent Assistance
Community housing providers can claim Commonwealth Rent Assistance on behalf of eligible tenants; state housing authorities cannot. The same dwelling can generate more rental income for providers under community housing management, which may affect the financial model for managing the property.
Leveraging private and institutional finance
Larger community housing providers can borrow against their portfolios to fund new construction. These financing arrangements may support new housing supply where providers can access private or institutional finance.
Reducing state capital liabilities
Public housing stock represents a large ongoing maintenance liability on state balance sheets. Transferring ownership or management to a community housing provider can shift some management and maintenance responsibilities away from direct government management.
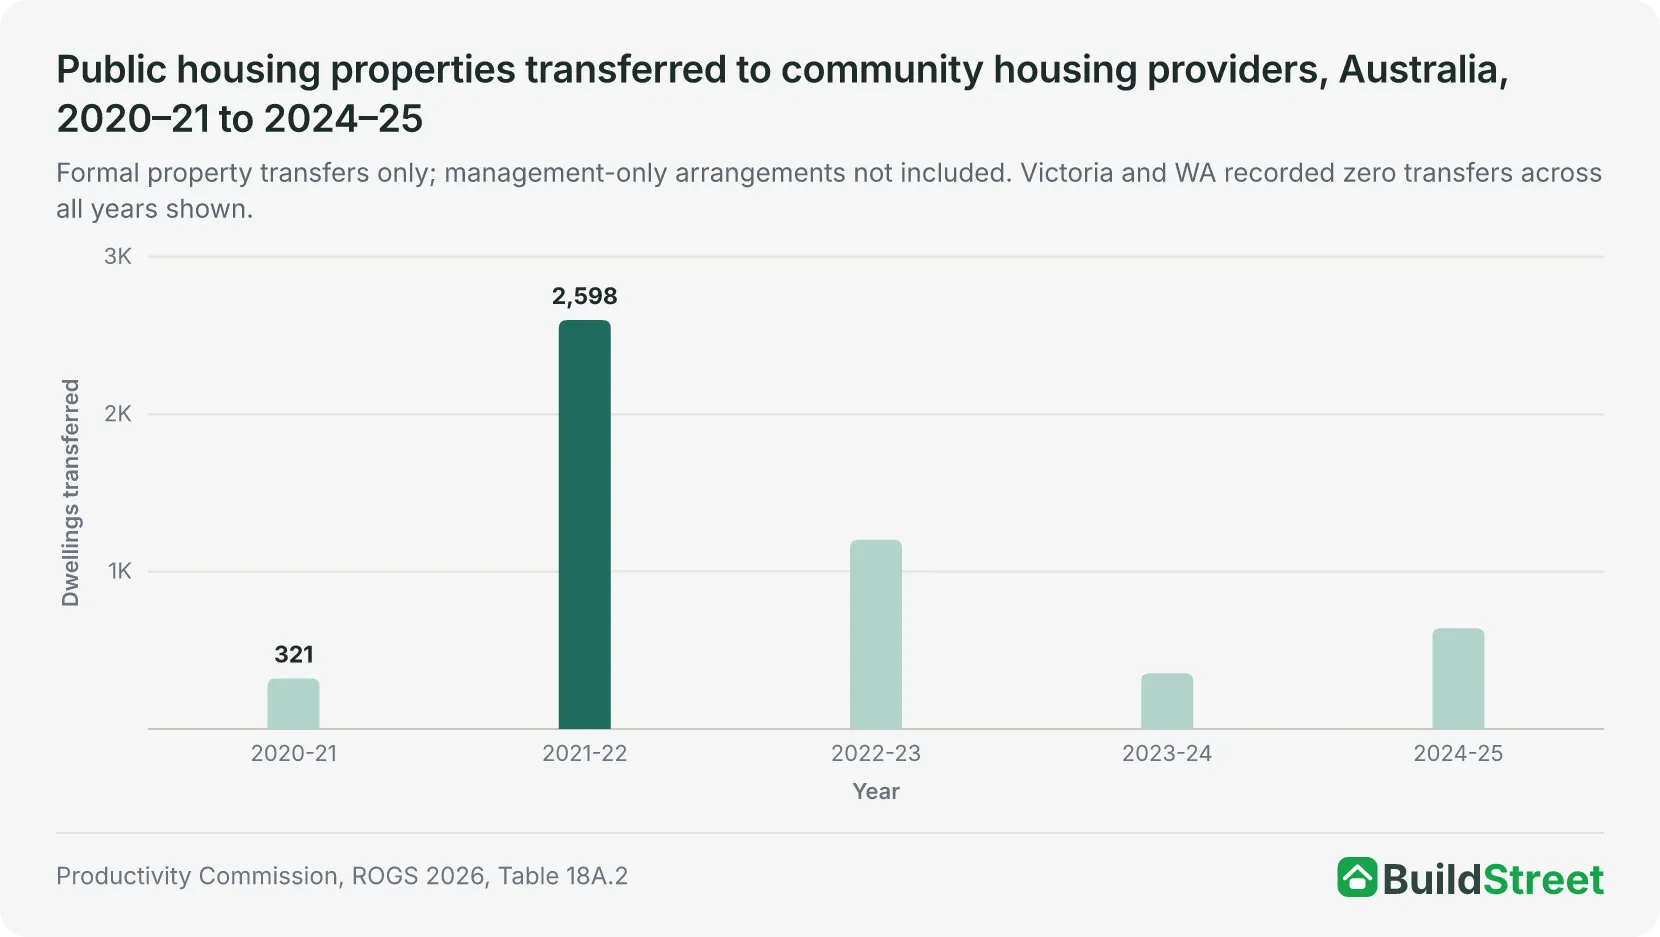
That 5,115 figure is likely an undercount. Many transfers, including the 10,700-dwelling NSW transfer in 2018–19 under the Future Directions policy, were structured as management arrangements rather than ownership changes and so do not appear in formal transfer records.
The distinction matters: a management transfer moves a property out of the public housing count even if the state still legally owns it. The property operates as community housing from a service perspective, but the state may still carry the asset and some ongoing maintenance obligations on its books.
Section 05 · DEMOGRAPHICS
Who lives in public housing in Australia?
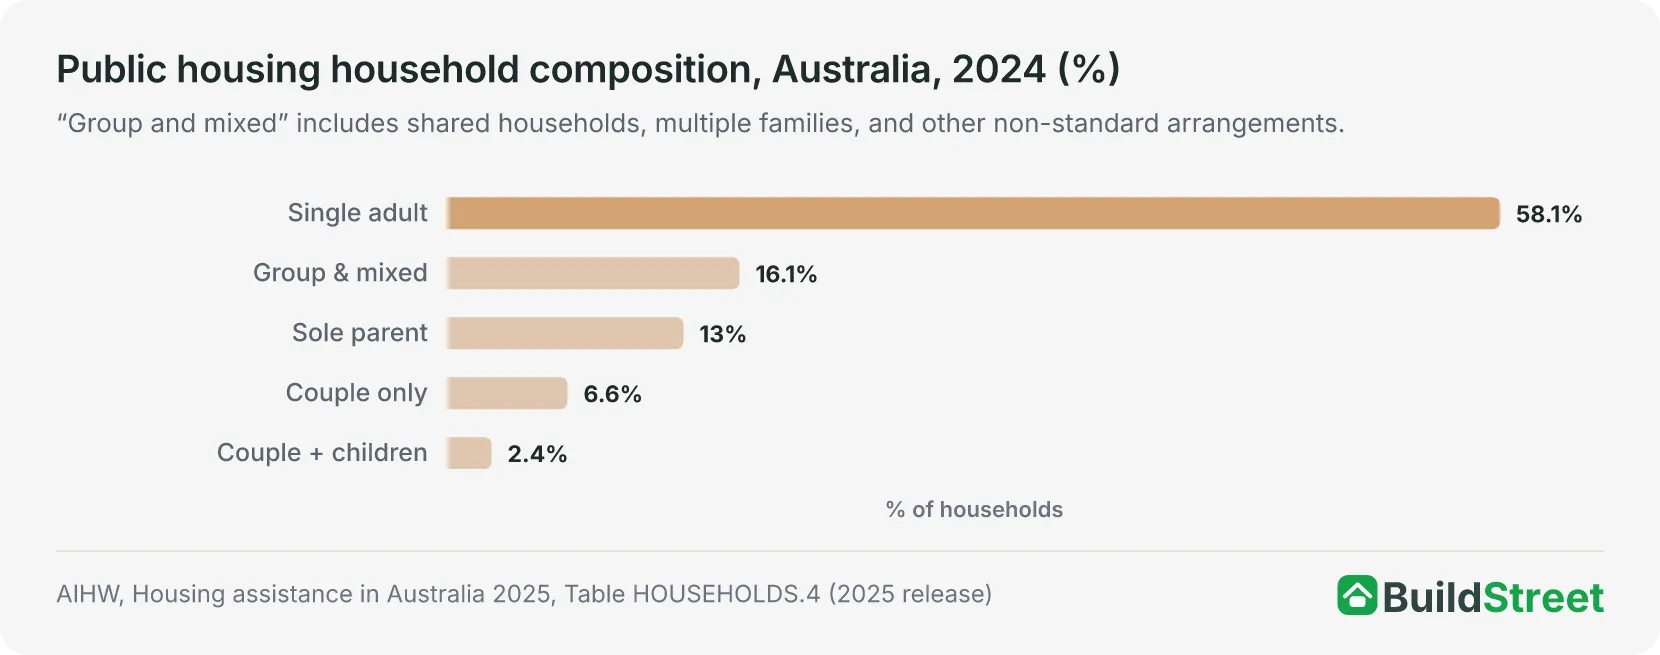
Australia's public housing system housed 543,714 people across 286,227 households at 30 June 2024. That works out to an average of 1.9 people per household, below the Australian household average of 2.5. This reflects the high share of sole-person households in public housing.
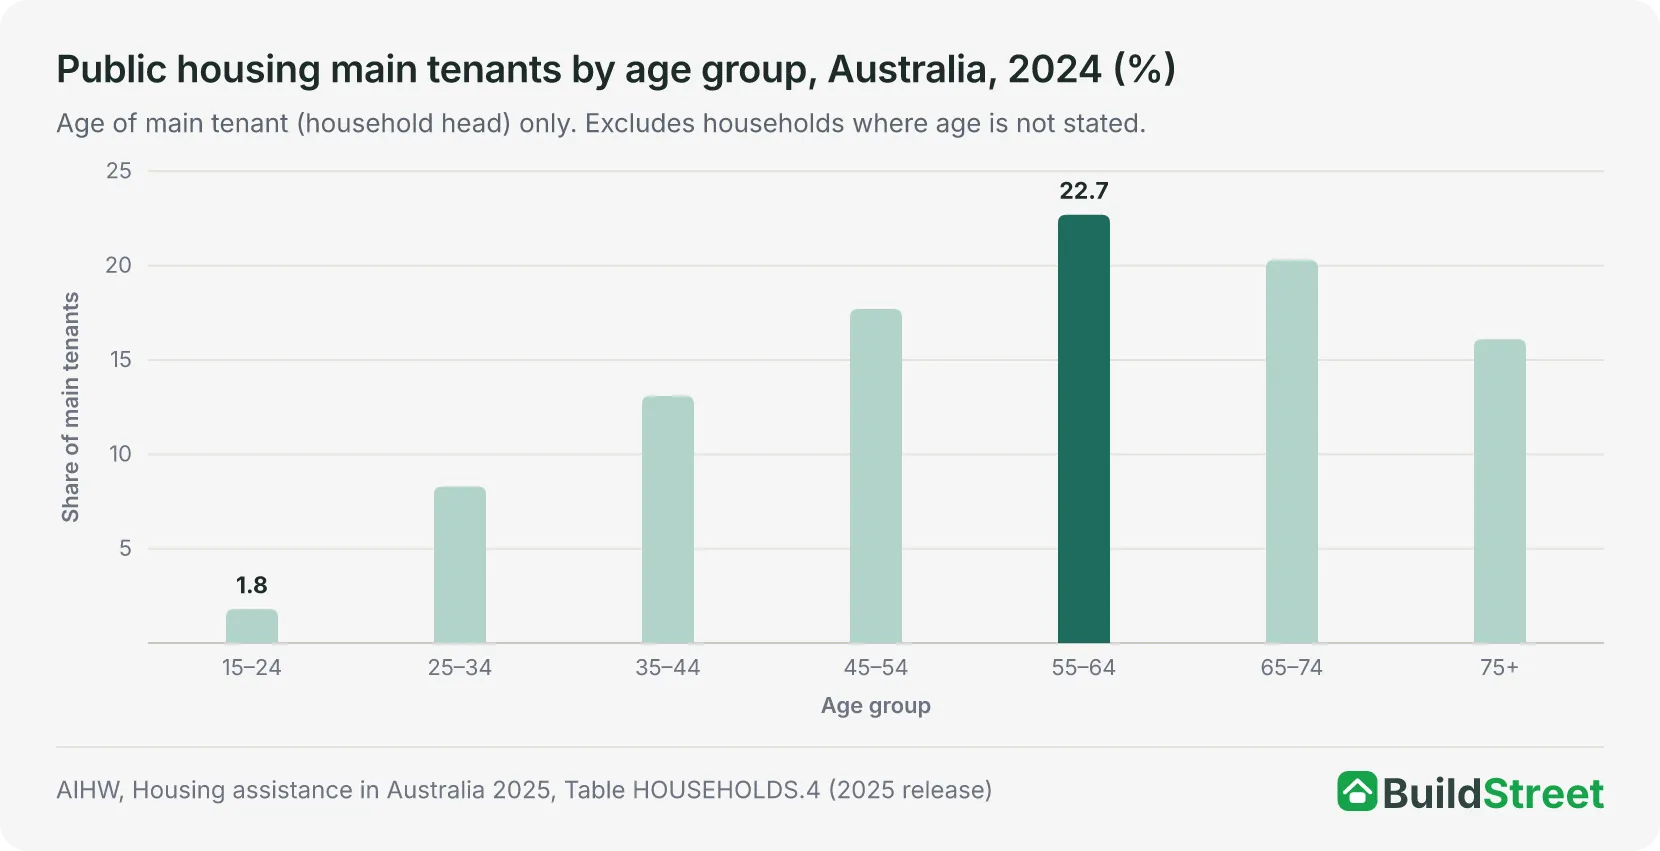
Public housing tenants are older than the broader population. More than 59% of main tenants are aged 55 or older, and 36% are 65 or over. The 75-and-over group is the single largest age band at 16.1%. At the other end, only 1.8% of main tenants are under 25.
This ageing profile affects both system management and dwelling suitability. Older single tenants who were allocated family-sized homes years ago may contribute to underutilisation rates in public housing. Lower underutilisation may depend on the availability of smaller homes nearby.
Income, disability, and Indigenous status
Public housing targets people with the greatest financial need. 85.8% of main tenants rely on a government payment as their main income source. The disability support pension (28.3%) and age pension (23.6%) are the two largest single income categories, together accounting for more than half of all main tenants. 6.6% of main tenants have employment as their main income source.
In 2024, 42.3% of main tenants had a disability, compared with about 18% of the general Australian population. Among all occupants, 14.2% were Aboriginal or Torres Strait Islander, compared with 3.8% of the national population at the 2021 Census. Women made up 63% of main tenants, which may reflect the profile of sole-parent households, domestic violence survivors and older single-person households in public housing.
Section 06 · THE WAITLIST
How many households are on the public housing waitlist?
The national public housing waitlist reached 189,536 households at 30 June 2025, up 12.5% from 168,552 at June 2024. This was the highest level in the comparable series since 2014 and the largest single-year increase in that series.
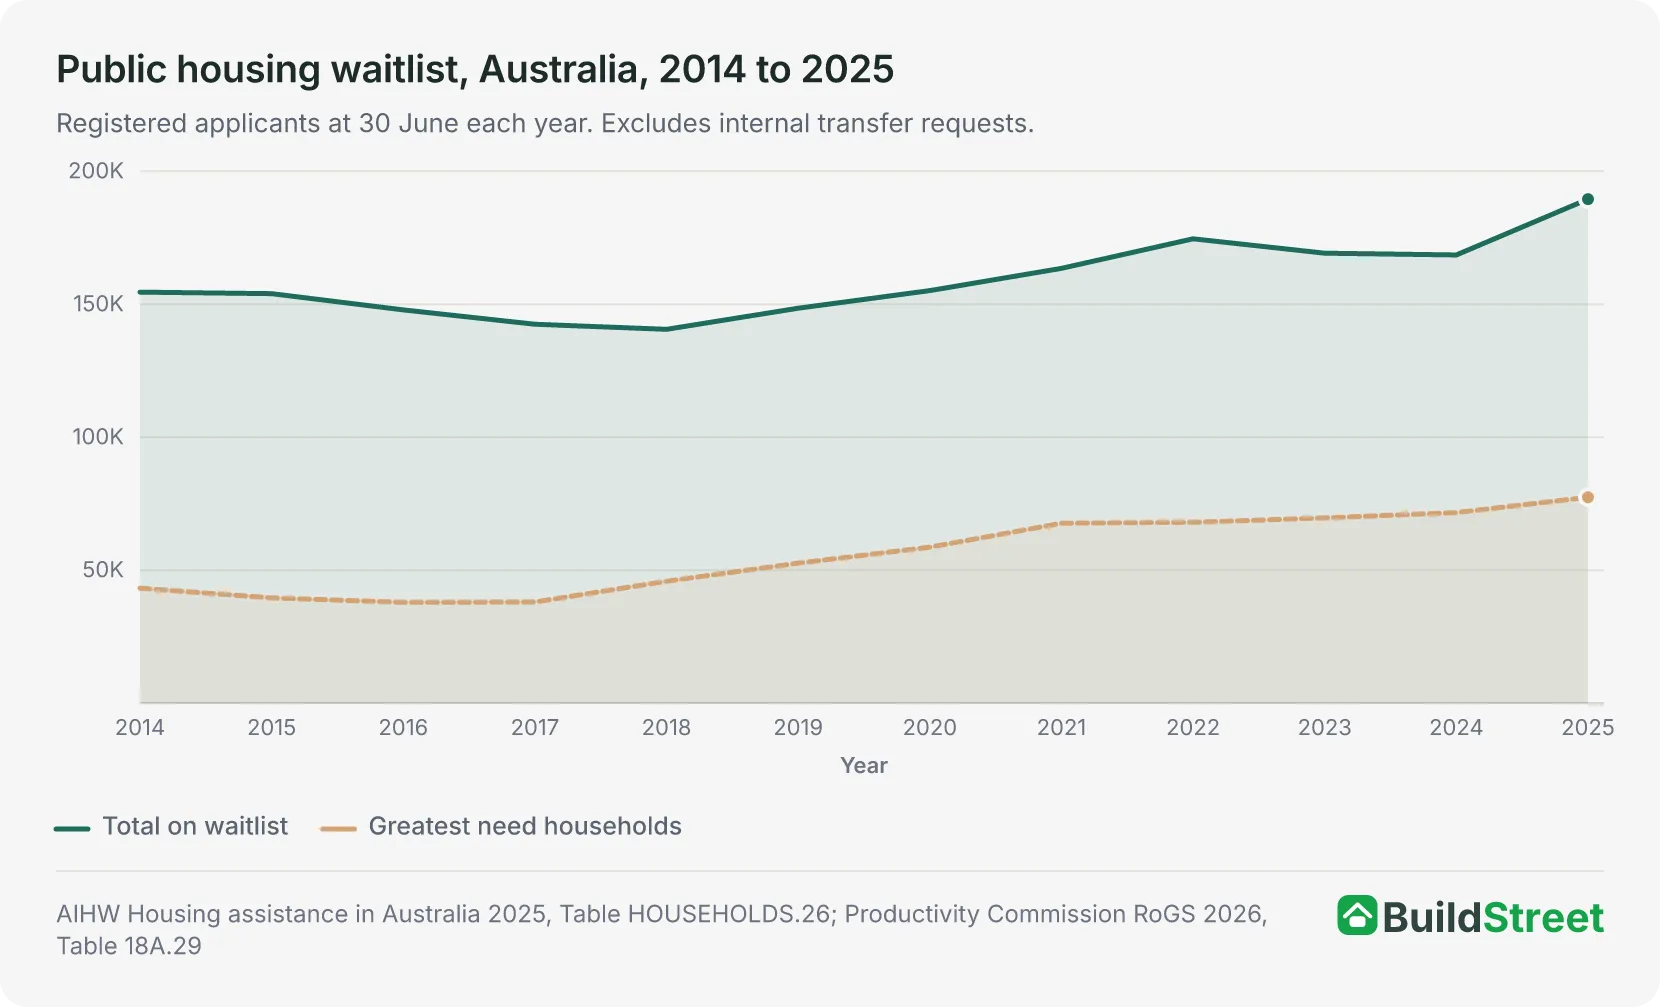
The waitlist fell to 140,578 at June 2018, then began to climb. The rise through 2019–2022 coincided with the COVID-19 period. After a brief easing in 2023 and 2024, the waitlist rose again in 2025, with most states recording higher numbers.
The waitlist measures registered applicants only; it does not capture all unmet housing need. Households in rental stress who have not applied, or who have been assessed as ineligible, are not included. Broader estimates of unmet need are higher than the official waitlist count.
Section 07 · ALLOCATIONS AND TURNOVER
How many households get public housing each year?
In 2024–25, 16,016 households were newly allocated to public housing. With 189,536 households on the waitlist at 30 June 2025, annual allocations covered roughly one in 12 registered households.
| Year | New allocations (total) | Of which greatest need | Greatest need share | Exits from public housing |
|---|---|---|---|---|
| 2024–25 | 16,016 | 13,471 | 84.1% | — |
| 2023–24 | 16,660 | 14,496 | 87.0% | 16,719 |
| 2022–23 | 16,510 | 13,640 | 82.6% | 16,238 |
| 2021–22 | 15,023 | 12,385 | 82.4% | 17,354 |
| 2018–19 | 19,711 | — | — | 30,186 |
| 2016–17 | 21,387 | — | — | 23,123 |
Source · AIHW Housing assistance in Australia 2025, Table HOUSEHOLDS.23; Productivity Commission RoGS 2026, Table 18A.29. Newly allocated households commenced public housing assistance in the reference year. Exits do not include internal transfers. The large exit figure in 2018–19 reflects the NSW transfer. Greatest need figures before 2021–22 are not directly comparable.
Why public housing turnover is low
In 2023–24, 16,719 households exited public housing from a base of 286,227 households, an annual turnover rate of 5.8%. This means exits were equivalent to roughly one in 17 public housing households that year, although not every exit necessarily created a dwelling immediately available for reallocation. At June 2024, 44.5% of ongoing public housing households had been in their current tenancy for 10 or more years.
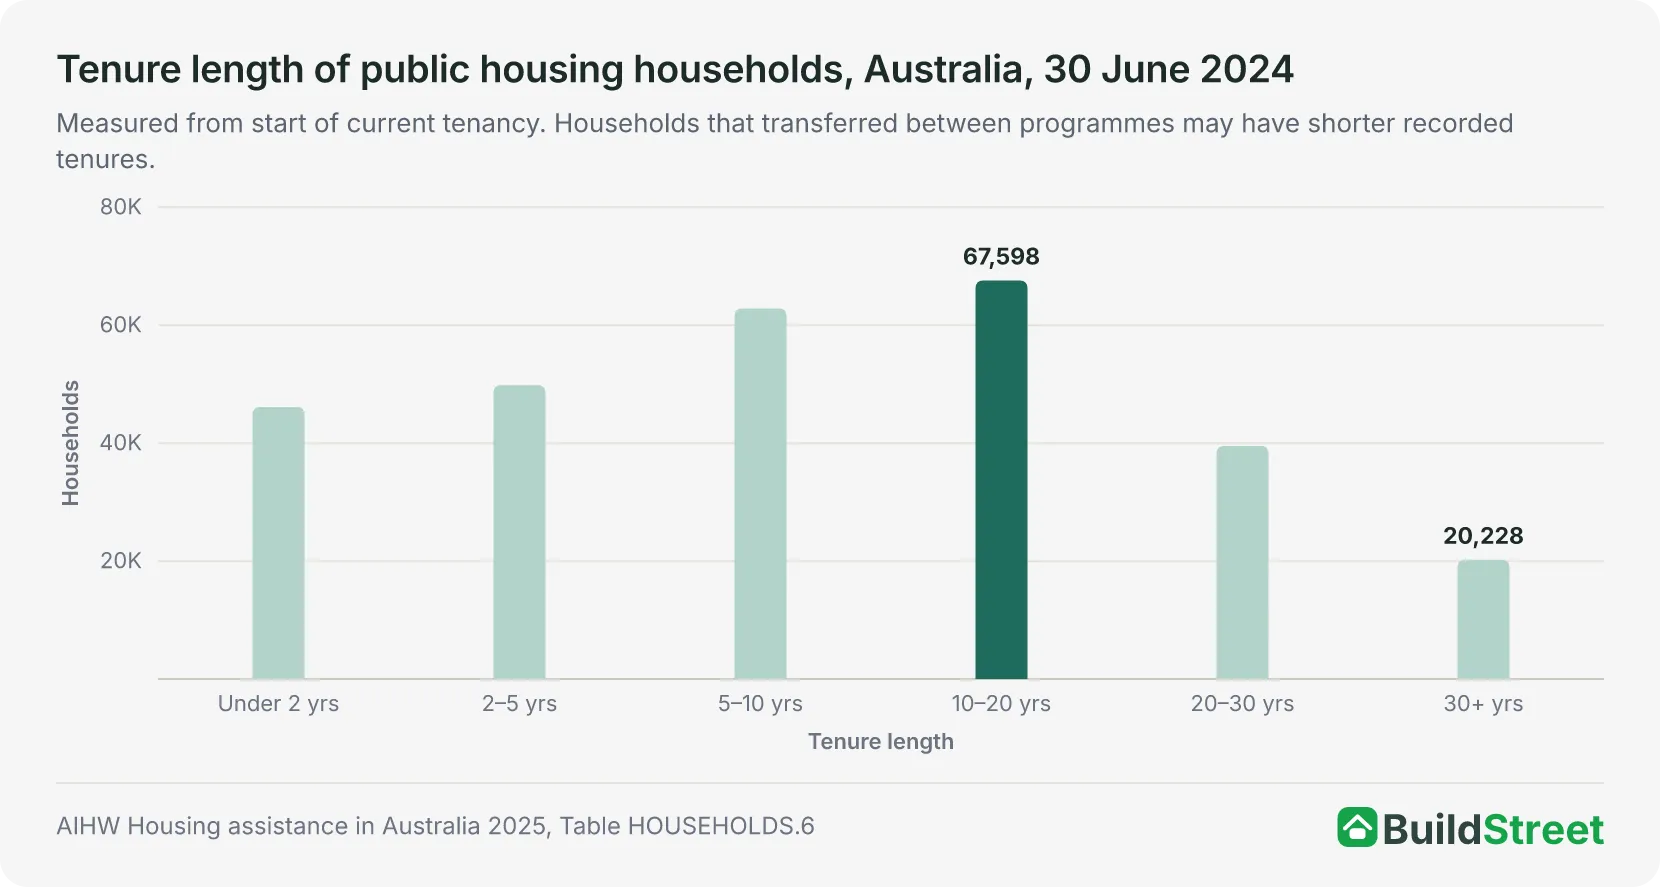
Long tenure is a common feature of public housing. Stable long-term housing is one of the intended outcomes of social housing, and many long-term tenants are elderly or have complex needs that make private market entry unlikely. However, low turnover means fewer homes become available for the waitlist each year. The size of the waitlist is affected by new supply, acquisitions, turnover and allocation policy.
Section 08 · HOUSING SUITABILITY
Public housing overcrowding and underutilisation in Australia
At 30 June 2024, 79.2% of public housing households were in suitably sized dwellings. A further 16.5% were in underutilised dwellings, meaning they had more bedrooms than needed, and 4.3% were overcrowded.
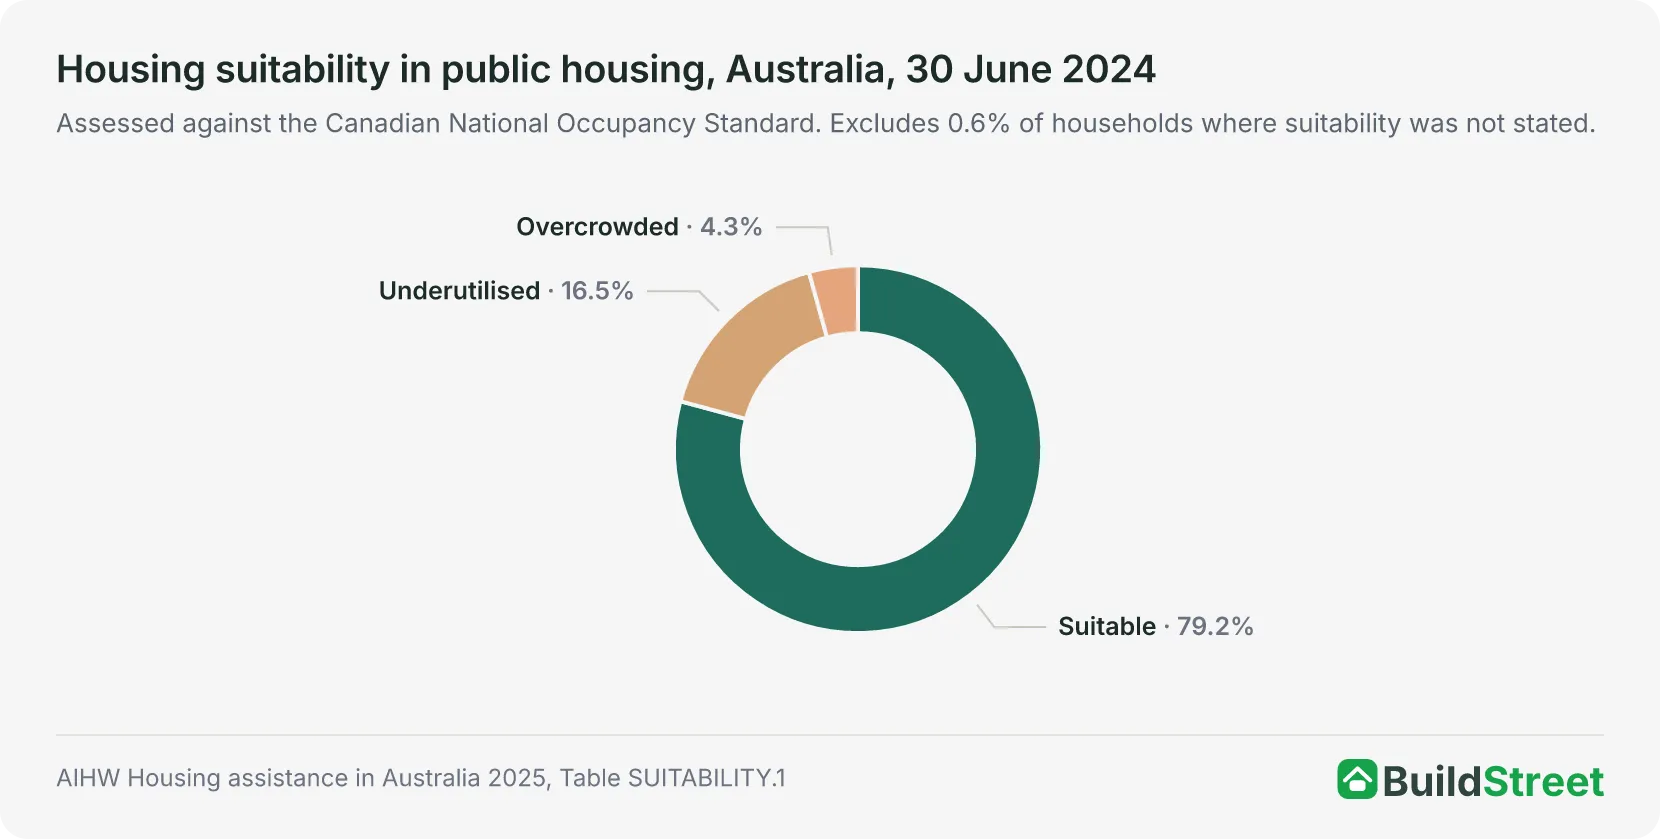
Underutilisation, at 16.5%, is the more common issue. Many of these dwellings are occupied by long-term tenants whose households have become smaller over time, for example after children have grown up and moved out. Several states offer voluntary incentives for downsizing, but take-up has been limited, partly because suitable smaller properties are not always available nearby.
Overcrowding, while a smaller share at 4.3%, is concentrated in specific groups. Indigenous households in public housing have an overcrowding rate of 9.9%, more than double the rate for non-Indigenous public housing households. Rates are higher in remote and outer regional areas.
Section 09 · STATE AND TERRITORY
Public housing in Australia by state and territory
New South Wales holds the most public housing with 92,709 dwellings at June 2025. Victoria (64,277) and Queensland (53,727) are the next largest. The Northern Territory (4,129) and Tasmania (5,051) have the smallest stocks by volume, though both have high social housing shares relative to their total household count.
Show full tables
| State / territory | Public housing dwellings | Share of national stock | Social housing as % of all households, 2024 |
|---|---|---|---|
| New South Wales | 92,709 | 31.3% | 4.5% |
| Victoria | 64,277 | 21.7% | 3.0% |
| Queensland | 53,727 | 18.1% | 3.5% |
| Western Australia | 33,940 | 11.5% | 3.8% |
| South Australia | 31,611 | 10.7% | 5.8% |
| Australian Capital Territory | 11,097 | 3.7% | 6.5% |
| Tasmania | 5,051 | 1.7% | 6.2% |
| Northern Territory | 4,129 | 1.4% | 14.4% |
| Australia | 296,541 | 100% | 4.1% |
Source · AIHW Housing assistance in Australia 2025; Productivity Commission RoGS 2026, Table 18A.3.
The ACT has the highest share of directly government-managed social housing, with 86.3% of ACT social housing still run as public housing. Tasmania and the Northern Territory have the lowest shares, reflecting Tasmania’s large-scale transfers and the significant community and Indigenous community housing presence in the NT. Victoria had the lowest social housing share of any state at 3.0%, partly because its larger population spreads its social housing stock across more households.
Public housing occupancy, vacancies, and turnaround times
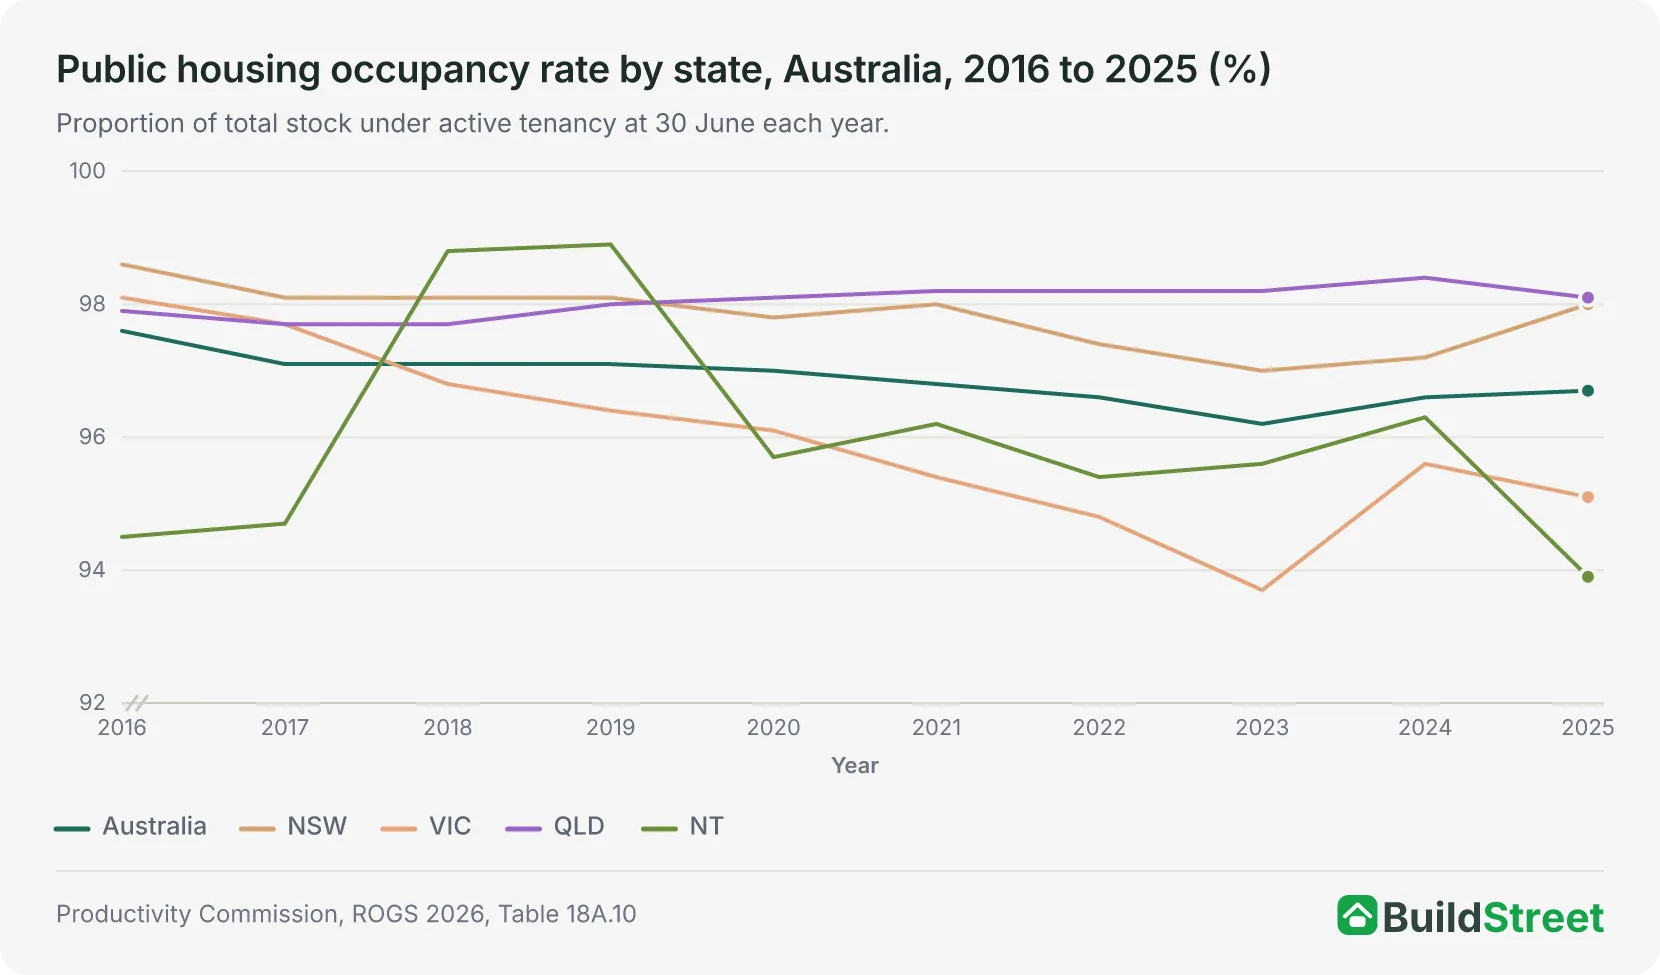
The occupancy rate shows what share of total public housing stock is under an active tenancy at 30 June each year. Nationally, this has held steady over the past decade, ranging from 96.2 to 97.6%. At the 2024–25 rate of 96.7%, 286,755 dwellings were actively occupied.
Occupancy rates vary by state. Queensland recorded the highest rate (98.1% in 2024–25). The Northern Territory recorded the lowest rate, at 93.9%, which may reflect the difficulty of maintaining and allocating properties in remote areas.
Victoria's rate fell from 98.1% in 2016 to 95.1% in 2025, with a dip to 93.7% in 2023. That dip reflects the period when the Victorian government began vacating properties ahead of demolition under the Big Housing Build programme, with properties cleared for demolition remaining in the total stock count but registering as unoccupied.
Public housing turnaround times by state
Turnaround time is the average number of days a property sits vacant between one tenant leaving and the next moving in. Shorter turnarounds mean homes return to use faster for households on the waitlist.
There are large differences between states. NSW averaged 28.4 days and Queensland 33.3 days. Western Australia averaged 93 days, down from 163 days in 2022–23. The Northern Territory averaged 140 days: on average, a vacant property there sat untenanted for nearly five months. Given the NT's high housing need, this represents a loss of effective supply. South Australia does not report this figure.
Methodology: Average days between tenancy end and commencement of next tenancy in same dwelling. WA methodology changed from 2021–22. SA data not reported. Source: Productivity Commission, ROGS 2026, Table 18A.14.
Dwelling suitability: overcrowding and underutilisation
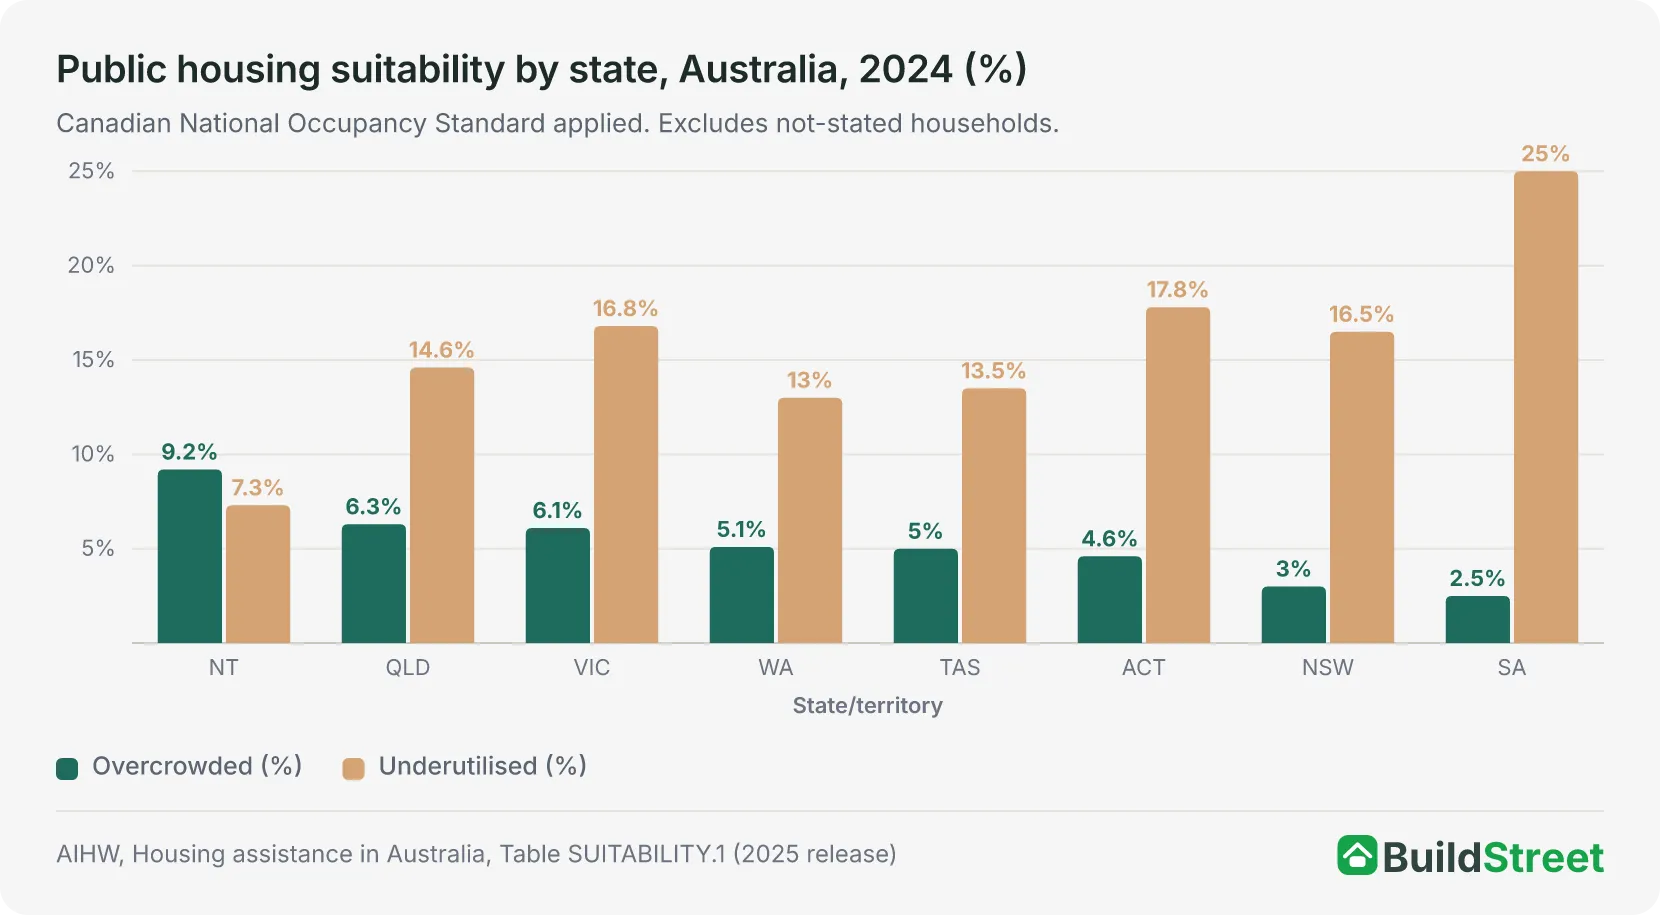
Nationally, 4.3% of public housing households (12,308) were in overcrowded homes, while 16.5% (47,134) were in homes larger than needed. At the state level, rates vary. South Australia has the highest underutilisation rate at 25%, likely reflecting an older tenant population in stock originally built for families. The Northern Territory has the highest overcrowding rate at 9.2%, consistent with larger household sizes in remote communities.
State and territory waitlists compared
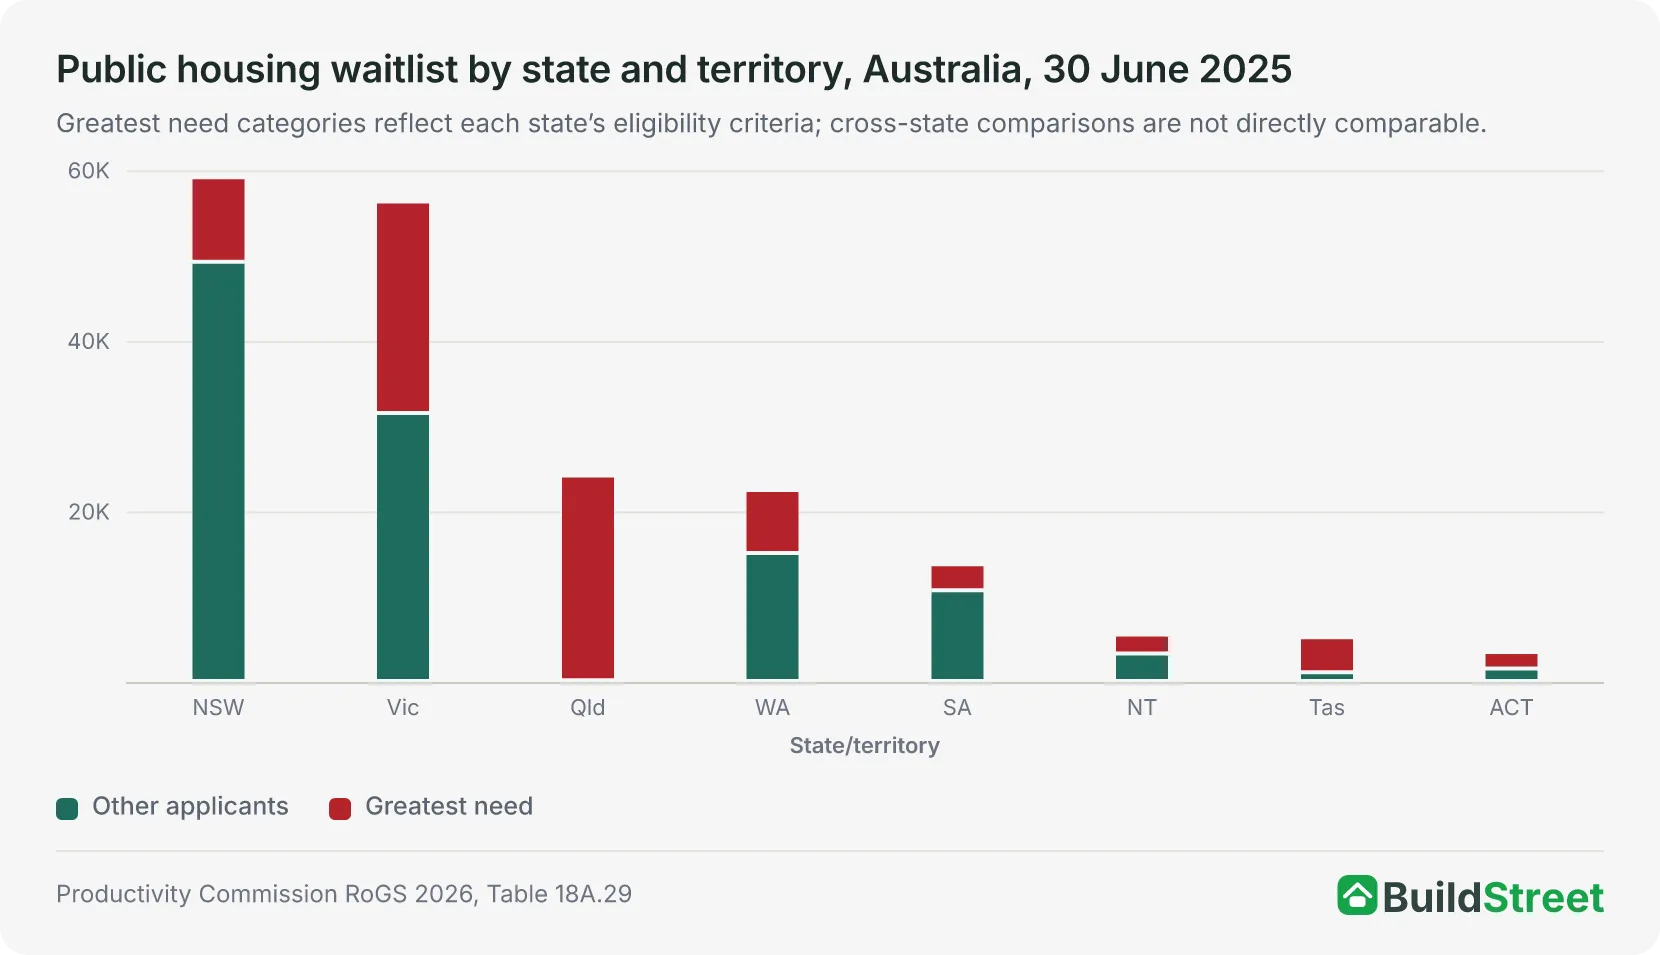
New South Wales and Victoria each had more than 50,000 households on the waitlist at June 2025, together accounting for 61% of the national total. Queensland's waitlist rose 28.1% in one year to 24,112 households. South Australia was the only state where the waitlist fell.
Show full tables
| State / territory | Total waitlist | Greatest need | GN as % of total | Change from June 2024 |
|---|---|---|---|---|
| New South Wales | 59,077 | 9,906 | 16.8% | +16.5% |
| Victoria | 56,230 | 24,803 | 44.1% | +9.4% |
| Queensland | 24,112 | 24,024 | 99.6% | +28.1% |
| Western Australia | 22,409 | 7,382 | 32.9% | +10.4% |
| South Australia | 13,687 | 3,021 | 22.1% | −2.5% |
| Northern Territory | 5,467 | 2,240 | 41.0% | +0.8% |
| Tasmania | 5,152 | 4,124 | 80.0% | +9.4% |
| Australian Capital Territory | 3,402 | 1,925 | 56.6% | +7.7% |
| Australia | 189,536 | 77,425 | 40.8% | +12.5% |
Source · Productivity Commission RoGS 2026, Table 18A.29; AIHW Housing assistance in Australia 2025, Table HOUSEHOLDS.27.
Queensland’s 99.6% greatest need classification reflects that state’s eligibility rules, where only households with immediate priority need can register. This is a definitional difference, not a sign that Queensland’s housing stress is uniquely severe. New South Wales had the lowest greatest need proportion at 16.8%, partly because some applicant data used in greatest-need classification was not collected in the same way as in other jurisdictions.
Section 10 · EXPENDITURE
Public housing expenditure in Australia
State and territory governments spent $7.9 billion on public housing in 2024–25: $4.4 billion in net recurrent expenditure (staffing, management, maintenance, rent subsidies) and $3.5 billion in capital expenditure (construction, major works, acquisitions).
Net recurrent expenditure per dwelling was $14,970 in 2024–25. Capital expenditure per dwelling was $11,834, though capital spending varies year to year depending on construction and acquisition programmes. In 2023–24, capital expenditure on public housing nationally was $2.7 billion, below the $3.5 billion in 2024–25, reflecting increased investment activity in that year.
| State | Net recurrent ($m) | Capital ($m) | Total ($m) | Total per person ($) |
|---|---|---|---|---|
| New South Wales | 1,291.5 | 1,022.1 | 2,313.6 | 274 |
| Victoria | 707.4 | 970.6 | 1,678.0 | 241 |
| Queensland | 609.1 | 510.1 | 1,119.2 | 197 |
| Western Australia | 860.4 | 551.3 | 1,411.7 | 489 |
| South Australia | 437.4 | 263.3 | 700.7 | 374 |
| Tasmania | 89.0 | 100.6 | 189.6 | 325 |
| ACT | 192.9 | 80.9 | 273.8 | 600 |
| Northern Territory | 251.5 | 10.6 | 262.1 | 960 |
| Australia total | 4,439.1 | 3,509.5 | 7,948.6 | 296 |
Source · Productivity Commission, ROGS 2026, Table 18A.1. Public housing net recurrent and capital expenditure only. Excludes SOMIH, community housing, and ICH expenditure. Per-person figures are per person in the state/territory population.
Western Australia and the ACT had high per-person expenditure relative to their public housing stock size. The Northern Territory's high per-capita cost is likely influenced by the complexity and expense of delivering housing in remote communities, including higher construction costs, limited infrastructure and specialist maintenance requirements.
Total public housing expenditure in 2024–25 of $7.9 billion translates to $26,804 per dwelling for that year when including both net recurrent and capital components. This figure varies by state and year. Because capital expenditure in a single year may include multi-year project completions or acquisitions, single-year per-dwelling figures should be treated as approximate.
Section 11
Common questions about public housing in Australia
How much public housing does Australia have?
Australia had 296,541 public housing dwellings at 30 June 2025, the most recent available figure. New South Wales holds the largest stock (92,709 dwellings), followed by Victoria (64,277) and Queensland (53,727). At June 2024, there were 297,684 public housing dwellings nationally.
Has public housing declined in Australia?
Yes. National stock fell from 343,301 dwellings in 2005 to 296,541 in 2025, a reduction of 46,760 homes (13.6%) over two decades. However, not all of this represents permanent loss from the broader social housing system. A large share reflects transfers to community housing management in South Australia (2017–18), New South Wales (2018–19, 2023–24, 2024–25) and Tasmania (2021–22). Transferred dwellings remain in social housing if they continue to be used for social housing.
How many households are on the public housing waitlist?
There were 189,536 households on the public housing waitlist at 30 June 2025, including 77,425 classified as greatest need. This is up 12.5% from 168,552 at June 2024, and the highest total in at least a decade. New South Wales and Victoria each had more than 50,000 households waiting.
Are public housing allocations the same as new homes built?
No. An allocation means a household was newly placed in the programme, not that a new home was built. Most allocations are into existing homes that became vacant when another tenant left. In 2024–25, 16,016 households were newly allocated.
What is the difference between public housing and community housing?
Public housing is owned and managed directly by state and territory housing authorities. Community housing is managed by not-for-profit providers. Both are social housing and both charge below-market rents. A key funding difference: community housing tenants can access Commonwealth Rent Assistance; public housing tenants cannot. This gives community housing a different funding model from public housing and is one reason governments have used community housing providers in some supply programmes.
References
- AIHW Housing assistance in Australia 2025 — supplementary data tables · aihw.gov.au
- Productivity Commission, Report on Government Services 2026 — Part G Section 18 Housing data tables (June 2026 release) · pc.gov.au
- UNSW City Futures Research Centre / CHIA — Quantifying Australia's unmet housing need: a national snapshot · unsw.edu.au
- AHURI Final Report No. 452 — Australia's multi-provider social housing system · ahuri.edu.au
