

Published 27 May 2026 · Updated 23 Sept 2026
Adelaide is the cheapest of Australia's five major capitals to build a detached house, with an average construction cost of $389,9491. Sydney is the most expensive at $565,749, leaving a gap of almost $176,000 before land, site works or consultant fees are added.
But the build price is only the starting point. Lot sizes, construction inflation, build times, population growth and the gap between building and buying all affect whether a city is genuinely affordable. The latest Australian Bureau of Statistics (ABS) data shows where building is cheapest, where costs are rising fastest, and where buyers face the biggest budget pressure.
 How long does it take to build a house in Australia?The average time from approval to handover is now about 11.5 months for a house, 14.8 months for a townhouse and almost 33 months for an apartment in Australia. While homes still take much longer to b…
 What the post-2020 cost surge means for homebuilding in AustraliaHouse construction prices in Australia surged 40.8% between September 2020 and June 2024, according to ABS producer price data for house construction. That increase has permanently reset the cost base…
What these figures measure
The ABS does not publish capital-city build cost tables, so these figures use state averages as proxies: South Australia for Adelaide, Western Australia for Perth, Queensland for Brisbane, Victoria for Melbourne, and New South Wales for Sydney. They cover the cost of constructing the house. Land, site preparation, professional fees and financing costs are excluded.
Why the gap between cities is so large
Trade availability is the dominant driver. When state governments run hospitals, roads and social housing projects at the same time as private housing, the same limited pool of bricklayers, carpenters and concreters has to cover more work. That competition can push labour costs higher. ABS producer price data for June 2026 shows trade shortages are still contributing to construction price rises across major states.
Section 01
Where building costs more, and why dwelling type matters
The ranking across the five capitals has been consistent in the ABS data for several years. Adelaide and Perth hold a clear cost advantage over the eastern seaboard cities.
The gap between Adelaide and Sydney is not marginal, at around $176,000. However, it is large enough to affect financing, contingency planning and design scope well before a block of land is purchased.
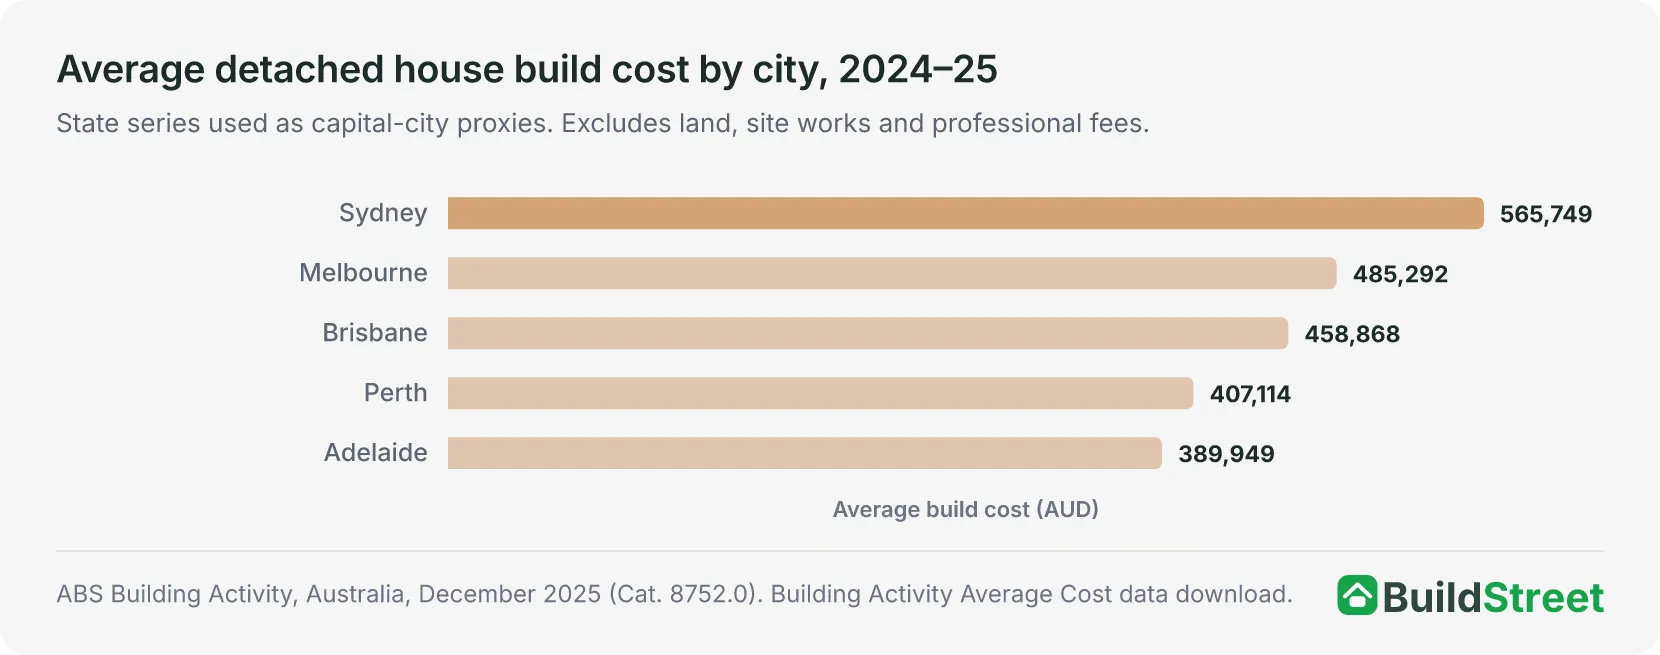
The longer-run ABS housing review for 2023-24 confirms the same order. The average cost of a completed new house that year was $374,261 in South Australia, $382,044 in Western Australia, $433,161 in Victoria, $450,612 in Queensland, and $520,204 in New South Wales. Adelaide and Perth were already the lower-cost leaders before the most recent figures were published.
Section 02
Average build costs by dwelling type
The type of dwelling matters as much as the city. Nationally, houses, townhouses and apartments have all increased sharply since 2020, but they have not moved at the same rate. Apartments overtook houses on average cost from around 2018 onward, driven by higher structural requirements, fire safety compliance and the cost of shared infrastructure in multi-storey buildings.
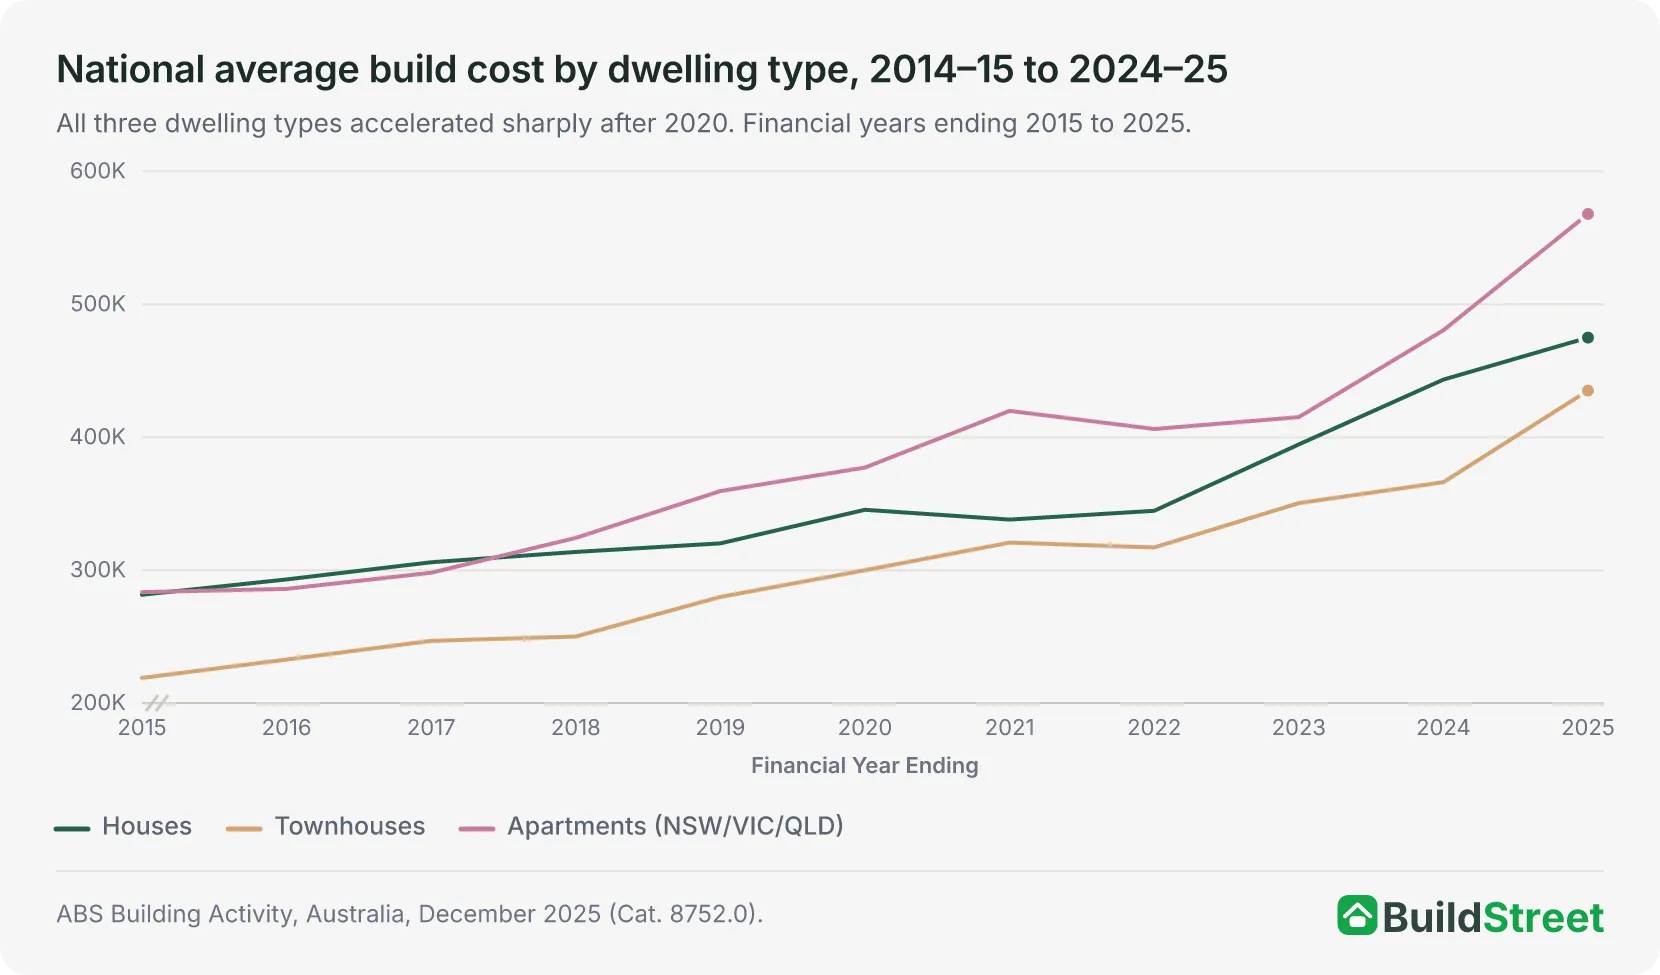
The steepest rise across all three construction categories occurred between 2020–21 and 2022–23, when supply chain disruptions intensified and trade shortages reached their peak.
Apartment construction costs grew fastest, rising 50.6% from $377,200 in 2019–20 to $567,947 in 2024–251. Houses grew 37.5% over the same period, from $345,410 to $474,939. The gap between apartment and house construction costs is now the widest in more than a decade.
Section 03
Where building is cheaper than buying in Australia
In every major city, the cost of building a new home is considerably lower than the mean price of an existing dwelling.
The gap is largest in Sydney, where the mean dwelling price was $1.305 million in the June quarter 20262 against a build-cost proxy of $565,749. However, that gap does not make Sydney the easiest place to build. It reflects how expensive the existing stock has become, not how accessible new construction is.
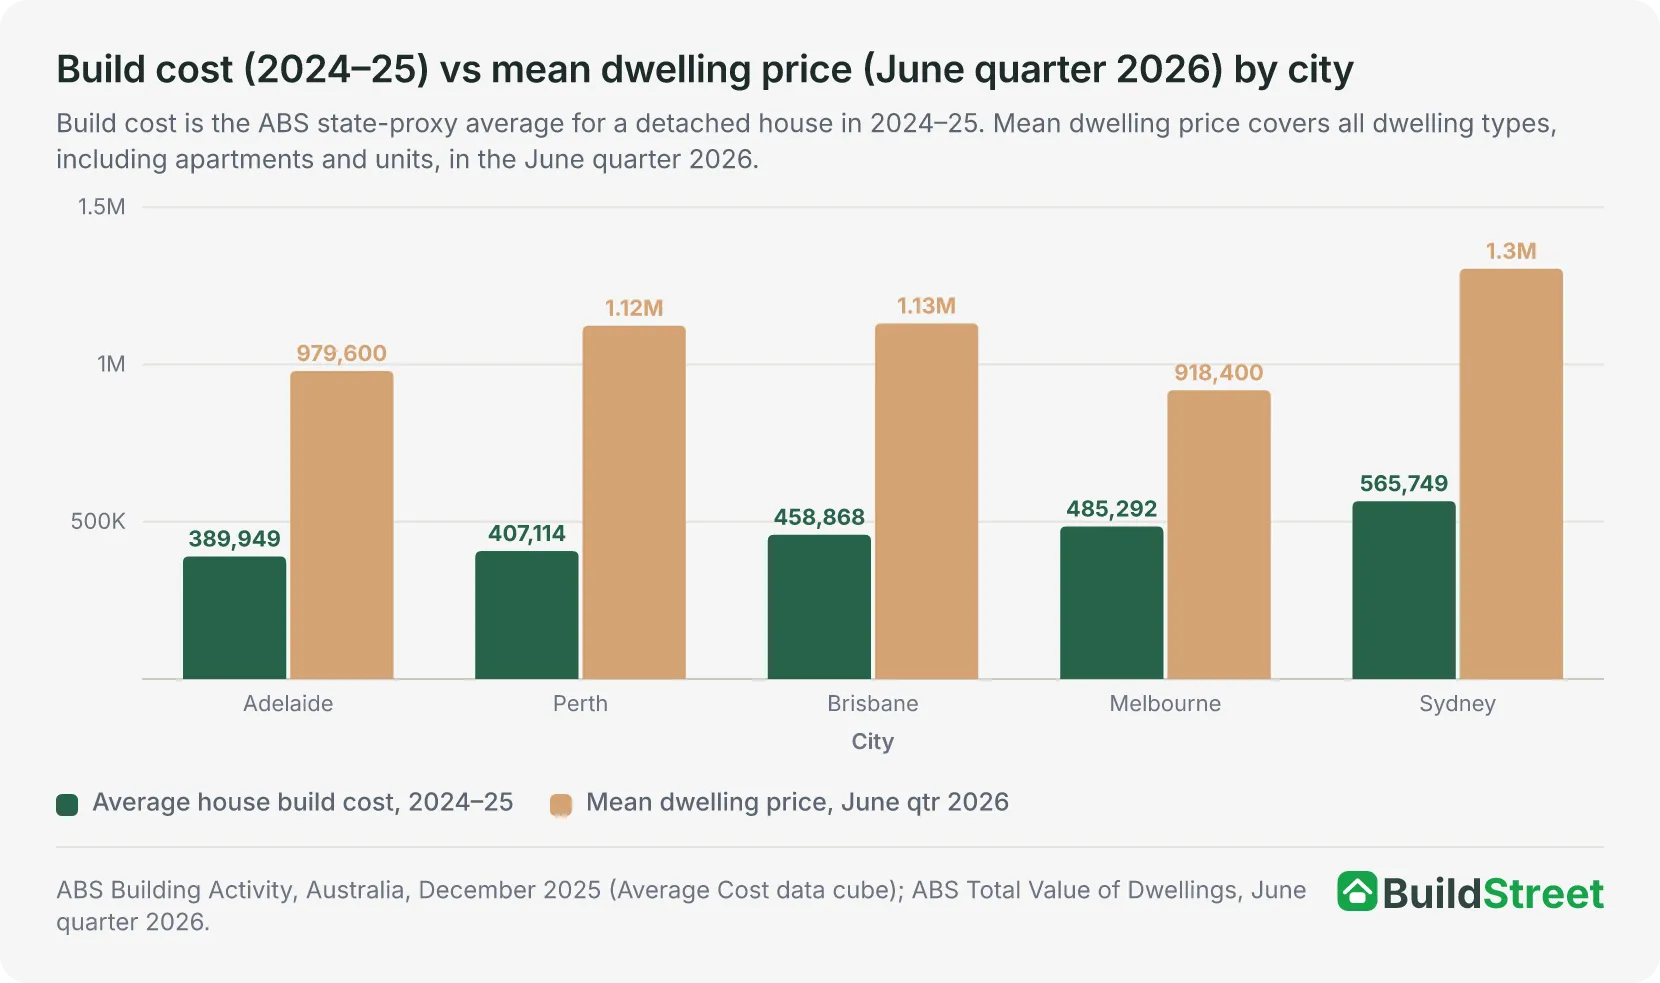
Melbourne shows the smallest gap in dollar terms because its existing dwelling prices are now the lowest of the five capitals, not because building there is cheap. Perth's gap has widened to the second-largest as its dwelling prices climbed. Brisbane's gap is larger than its build cost alone might suggest, driven by strong demand that has pushed up established dwelling prices. These comparisons exclude land, site preparation, consultant fees, financing costs and stamp duty.
Section 04
City-by-city: where is the best value for building in Australia?
Build cost alone does not show how affordable a city really is. A cheaper build can still come with longer construction times, smaller lots, faster price inflation or stronger population pressure.
The table below compares five factors that shape the real cost of building in each major city: average build cost, typical build time, average new lot size, current input-cost inflation and recent population growth.
| City | Avg Build Cost | Build Time | Avg Lot (m²) | Input Inflation | Pop. Added 2024–25 | Verdict |
|---|---|---|---|---|---|---|
| Adelaide (SA) | $389,949 | 3.38 qtrs | 468 | 4.4% p.a. | 18,647 | Best value |
| Perth (WA) | $407,114 | 4.37 qtrs | 399 | 3.9% p.a. | +2.4% rate | Good on price |
| Brisbane (QLD) | $458,868 | 2.36 qtrs | 459 | 4.4% p.a. | 58,223 | Middle ground |
| Melbourne (VIC) | $485,292 | 2.65 qtrs | 429 | 3.5% p.a. | n/a | Balanced |
| Sydney (NSW) | $565,749 | 3.17 qtrs | 423 | 3.5% p.a. | 75,230 | Toughest |
Source · ABS Building Activity Dec 2025 (build cost, 2024–25) and June 2025 (build time, 2024–25); ABS Producer Price Indexes June 2026 (input to house construction prices); ABS Regional Population Growth 2024–25. Build time is quarters from commencement to completion.
Section 05
How long does it take to build in each city?
Build time has a real cost that does not show up in the construction price. Every additional quarter on site is another quarter of rent, holding costs and loan interest.
In 2024–25, Brisbane completed a house in an average of 2.36 quarters from commencement to completion3. Perth took 4.37 quarters, nearly double. That difference changes the effective cost of building in Perth considerably, even though its base construction price looks attractive.
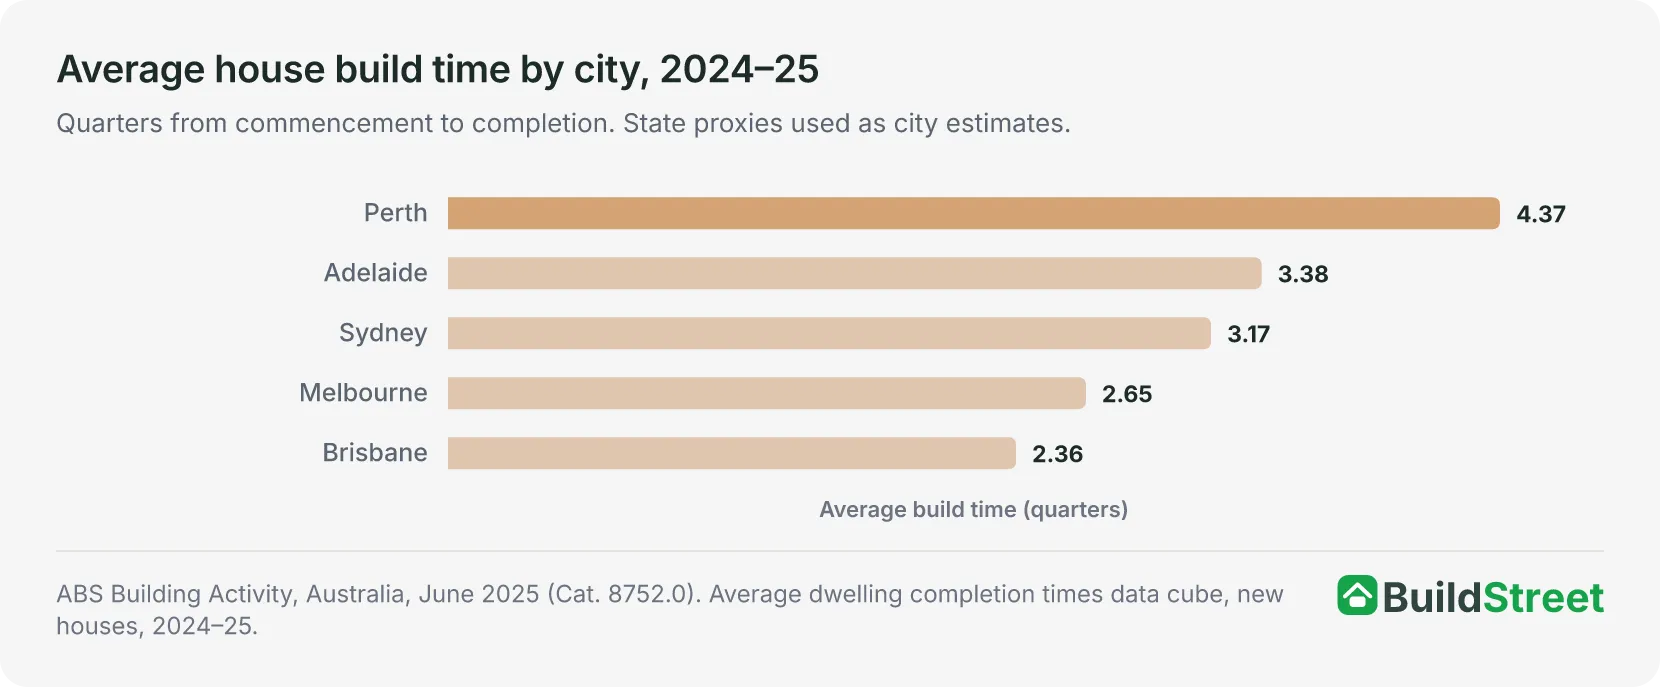
Perth's long build time is a direct consequence of the construction backlog that built up during the pandemic. The state entered the period with limited spare capacity, demand surged, and the queue of unfinished work grew faster than it could be cleared. For a buyer starting a project in Perth today, the inherited backlog still affects trade availability and scheduling.
Perth is the second-cheapest city to build in on base construction cost, but its 4.37-quarter average completion time changes the affordability picture. Holding costs, rent and finance charges can accumulate during construction, adding thousands, or potentially tens of thousands, of dollars to the final project cost. Western Australia recorded the largest post-pandemic construction backlog of any state, with private new houses under construction up 175.8% from 2019–20 to 2023–24.
Section 06
Where construction costs are rising fastest
The cheapest city to build in is not always the one with the slowest cost growth. Adelaide leads on base cost but is currently recording the fastest annual input inflation of the five capitals at 4.4%, level with Brisbane4.
Sydney and Melbourne have the slowest input inflation at 3.5%. Perth's input costs are rising at 3.9%, but its state-level house construction output prices are rising at 8.8% annually, the fastest of the five. That reflects the delayed unwinding of its earlier backlog.
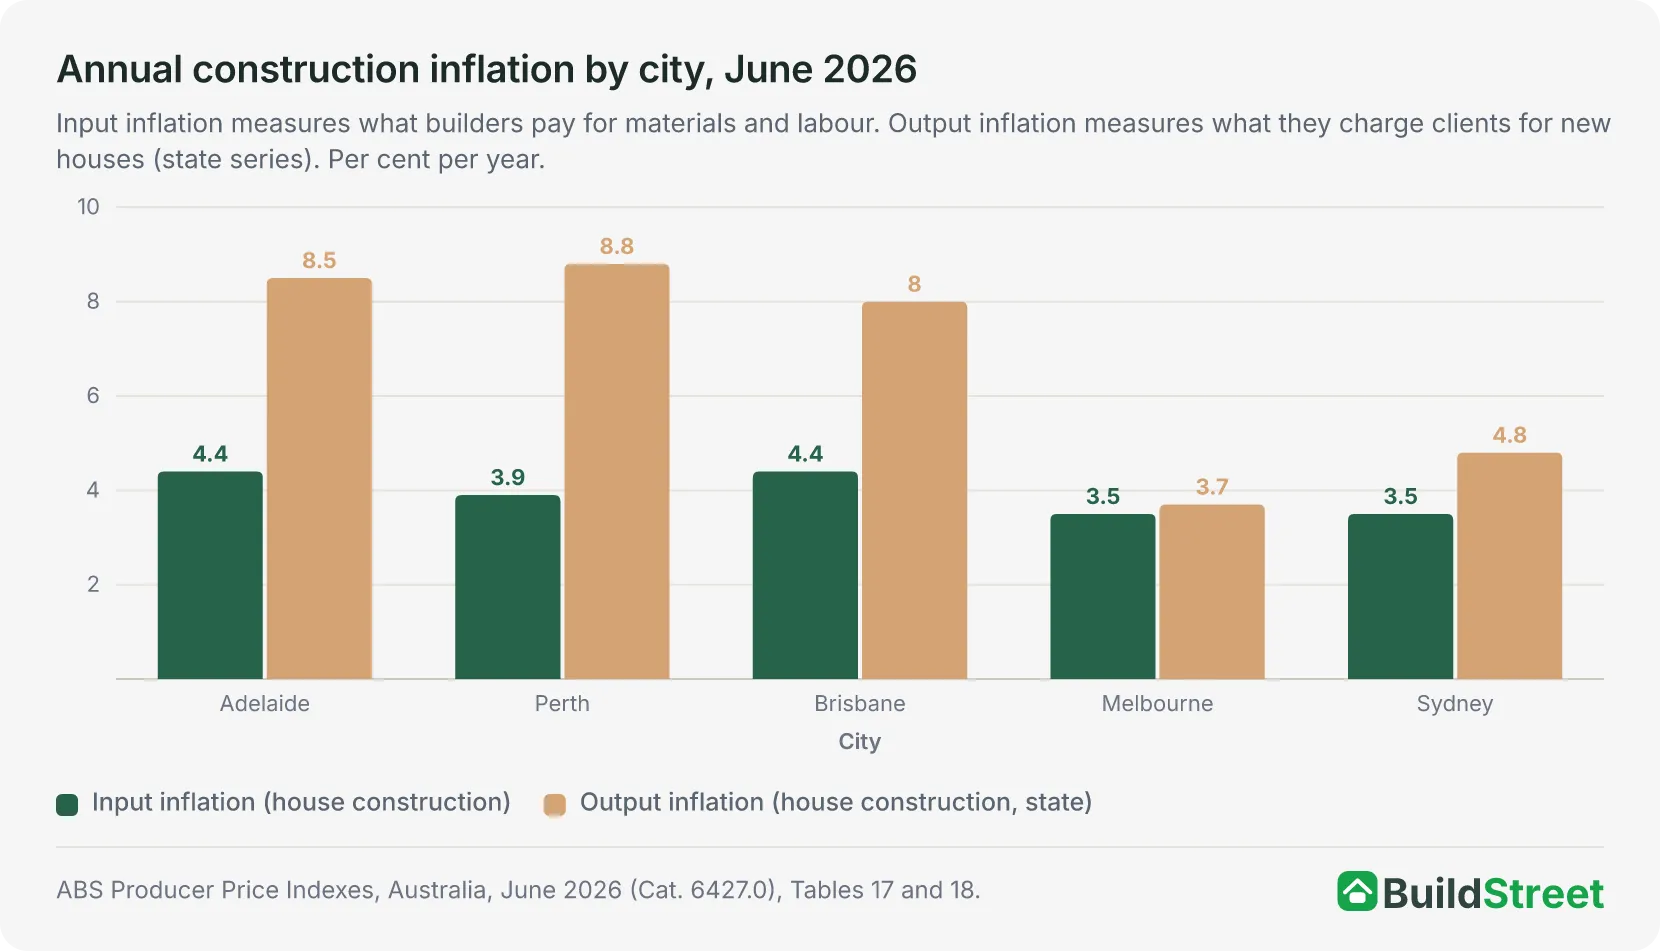
In Adelaide and Brisbane, output inflation exceeds input inflation, which suggests builders are passing on higher costs and facing additional price pressures beyond materials alone. In Sydney and Melbourne, the two series are closer together, suggesting less room for margin growth, or stronger competition keeping output prices more contained.
The national input price index for house construction rose from 118.8 in March 2020 to 167.8 in June 2026, a cumulative increase of 41.2%. That is why annual readings of 3.5% to 4.4% do not necessarily feel like relief on the ground. The system is now pricing off a much higher base than it was six years ago, and current data does not point to that base reversing.
Section 07
What lot sizes can reveal about land supply
Vacant land prices are not published consistently across all five capitals by a single official source, so the average lot size is used here as a proxy for land pressure. Smaller lots can indicate tighter urban land supply, stronger competition for buildable sites and greater pressure to fit more housing onto less land.
Lot sizes in 2021
Average site areas were 468 m² in Greater Adelaide, 459 m² in Greater Brisbane, 429 m² in Greater Melbourne, 423 m² in Greater Sydney and 399 m² in Greater Perth. Adelaide had the largest average lot size of the five capitals. Perth, despite being one of the lower-cost build markets, had the smallest average lot size.
How lots have shrunk since 2012
Average site areas fell across all five capitals over the decade to 2021. Brisbane recorded the steepest decline, down 20%, followed by Sydney at 18%, Melbourne at 12%, Perth at 11% and Adelaide at 6%. Brisbane's larger reduction suggests land supply has tightened more sharply there, particularly ahead of its recent population growth.
Section 08
Why build costs vary so much between cities
The $176,000 gap between Adelaide and Sydney is not random. Four structural factors explain most of the difference between cities: labour availability, land pressure, input costs and local demand.
Trade availability
Jobs and Skills Australia has recorded ongoing shortages of bricklayers, carpenters, plumbers and electricians since 2021. ABS producer price data for June 2026 also shows builders are still facing pricing pressure when securing trades. When the same limited pool of workers is shared across houses, apartments and public infrastructure, costs can rise across all three sectors.
Materials, freight and supply chains
Construction costs rose sharply after the pandemic because supply chain disruption, freight costs and labour shortages hit at the same time. Timber prices have since stabilised, but copper reached US$13,000 per tonne in early 2026, up 16.5% year on year. Copper is used throughout a build, including electrical wiring, plumbing and air conditioning.
Land constraints and density settings
Lot sizes have been shrinking across all five capitals. Infrastructure Australia notes that more housing requires enabling infrastructure, including roads, public transport and utilities. Where zoning and servicing do not keep pace with population growth, builders face tighter conditions and fewer available sites.
Weather, disasters and insolvency
Extreme weather events added delays and costs after the pandemic. Construction has recorded the highest number of corporate insolvencies of any Australian sector for three consecutive years. When builders collapse, surviving firms may price in higher risk.
Section 09
How interest rates have changed the cost of building
Construction costs are not the only pressure on borrowers. Over the past five years, Australia has also gone through its sharpest monetary policy tightening in more than a decade. For buyers borrowing to build, the cost of carrying the loan has risen separately from the cost of building the home itself.
April 2020 (Baseline)
- Typical variable rate
2.8–3.4%
- Monthly repayment ($730k, 25 yrs)
approx. $3,460
- RBA cash rate / Avg NSW loan
0.25%
- QLD loan size growth (1 yr)
not available
April 2026 (Current)
- Typical variable rate
5.7–6.3%
- Monthly repayment ($730k, 25 yrs)
$4,600–$4,850
- RBA cash rate / Avg NSW loan
$872,752
- QLD loan size growth (1 yr)
+16% (approx. $100k)
Monthly repayment estimates use principal and interest on a 25-year term. Actual repayments will vary by lender and loan structure. Source: RBA Statement on Monetary Policy, February 2026.
This comparison uses the same $730,000 loan in two different rate environments. In practice, many borrowers are now facing pressure from both sides: higher interest rates and larger loan sizes. The average new loan in NSW reached $872,752 in 2026, while Queensland loan sizes grew by approximately $100,000 in a single year. The monthly repayment difference of around $1,400 therefore sits on top of a loan principal that is already much larger than it was six years ago.
Higher construction costs and higher interest rates are stacking up. The monthly repayment gap of around $1,400 is significant, but it sits on top of a loan principal that has also grown because the build itself costs more. Both pressures are pushing buyer budgets in the same direction.
Section 10
Which city offers the lowest-cost conditions for first-home builders?
Adelaide stands out as the strongest all-round market for first-home builders among the five capitals. It has the lowest build-cost proxy, the largest average site area and much lower population pressure than the bigger East Coast markets. Greater Adelaide added 18,647 people in 2024–25, compared with 75,230 in Greater Sydney and 58,223 in Greater Brisbane5. That gives buyers more room to make a build work financially, without the same level of competition for land seen in larger cities.
Adelaide's main risk is rising input costs. Its current input inflation reading of 4.4% is the joint fastest of the five capitals, level with Brisbane. However, that increase is coming off a lower cost base than Sydney or Melbourne, and overall capacity pressure remains lower in absolute terms.
Perth ranks second on base cost and has mid-range current input inflation at 3.9%. But the low headline price comes with timing and capacity risks. Perth recorded the fastest population growth rate of the five capitals in 2024–25, at 2.4%, had the slowest average build time at 4.37 quarters, and recorded a net internal migration gain of 8,211.
Brisbane sits in the middle. It is cheaper than Sydney and Melbourne, has the fastest build time and still offers reasonably large average lots. The pressure point is demand. Queensland's average completed-house cost rose 44.0% between 2019–20 and 2023–24, the strongest growth among the major east and west coast states in the ABS housing review.
Melbourne offers a reasonable balance. Its build-cost proxy sits in the middle of the five, materials inflation is steadier at 3.5%, and its completion time of 2.65 quarters is second-fastest.
Sydney remains the hardest market by most measures: highest build costs, relatively small average lots, the highest mean dwelling price in the country, and the second-largest absolute population growth of any capital, behind Melbourne.
Section 11
Building smarter in 2026: smaller homes and modular construction
Faced with trade shortages, material cost pressure, longer build times, and expensive finance, builders and buyers are adapting. Two approaches are gaining ground among those trying to keep projects more predictable.
Smaller, high-performance footprints
The economics of 2026 are pushing buyers toward smaller floor plans. Fewer square metres can mean fewer trades, less material and lower exposure to cost blowouts during construction. Passive house systems, which once added 15% to 20% to build costs, now typically add around 5% to 10% as local expertise and supply chains have matured.
Modular and prefabricated construction
The Australian prefab market has grown by more than 20% annually in recent years. Because modules are built in factories while site preparation happens at the same time, total project timelines can be cut by 30% to 60%. The main appeal is cost certainty: the price is set before ground is broken, reducing the variation risk that has become a major problem in traditional construction.
Modular / Prefabricated
- Cost certainty
High cost certainty (fixed-price standard)
- Weather
Minimal weather delays (built indoors)
- Speed
30–60% faster than traditional
- Structure
Welded steel chassis, often termite-resistant
- Site impact
Low site impact (crane install, low waste)
- Example cost
Approx. $380,000 fixed (150 m² 3BR example)
Traditional Site-Built
- Cost certainty
Low (prime cost and provisional sum exposure)
- Weather
Frequent stoppages common
- Speed
12–24 months typical
- Structure
Timber or block frame, standard
- Site impact
Extended noise, waste and disruption
- Example cost
$400,000–$450,000+ variable
Data note: The example cost figures in the table are indicative industry estimates for a 150 m² three-bedroom home, not ABS data. Individual quotes will vary significantly based on site conditions, design specification, location and builder.
For traditional builds, industry professionals often recommend a 10 to 15% cash contingency buffer, kept liquid rather than borrowed, to cover variation costs. With national costs forecast to rise a further 4.0 to 7.5% through 2026, depending on the city, every quarter of delay carries a measurable dollar cost.
References
- ABS Building Activity, Australia, December 2025 — Average Cost of New Dwellings (data cube) · Australian Bureau of Statistics ↑ b
- ABS Total Value of Dwellings, June Quarter 2026 — Table 1. Total value of dwellings, all series · Australian Bureau of Statistics ↑
- ABS Building Activity, Australia — Average dwelling completion times (jun-2025) · Australian Bureau of Statistics ↑
- ABS Producer Price Indexes, Australia, June 2026 (Cat. 6427.0) · Australian Bureau of Statistics ↑
- ABS: Regional Population, 2024–25 · Australian Bureau of Statistics ↑
- ABS Building Activity, Australia, March 2026 (Cat. 8752.0) · Australian Bureau of Statistics
- ABS Producer Price Indexes, Australia (Cat. 6427.0) — latest release · Australian Bureau of Statistics
- ABS Characteristics of New Residential Dwellings, 15-Year Summary · Australian Bureau of Statistics
- ABS Consumer Price Index, Australia (latest release, Cat. 6401.0) · Australian Bureau of Statistics
- Infrastructure Australia, 2026 Budget Statement and 2025 Infrastructure Market Capacity Report · infrastructureaustralia.gov.au
- RBA Statement on Monetary Policy, February 2026 · Reserve Bank of Australia
- S2A Modular, Modular vs Traditional Construction in 2026 · s2amodular.com
- Altus Group, Australian Construction Price Outlook Q4 2025 · altusgroup.com
- RLB Australia Market Intelligence Update, Q1 2026 · rlb.com
