

Published 11 May 2026 · Updated 22 Sept 2026
Building a new house in Australia costs $474,939 on average for the structure alone, based on the latest ABS completion data. Add land, and the national total sits around $847,000 at the median1, climbing past $1.2 million in Sydney. Costs are still rising: ABS new dwelling prices rose 5.7% in the year to July 2026, driven by project builders passing on higher labour and materials costs2.
The number advertised is rarely the number you spend. Understanding what's included in a quoted price, and what isn't, is where most project budgets come undone.
 How long does it take to build a house in Australia?The average time from approval to handover is now about 11.5 months for a house, 14.8 months for a townhouse and almost 33 months for an apartment in Australia. While homes still take much longer to b…
 How many homes are built in Australia each year?Two distinct cycles have shaped Australia's housing output since 2010:
Section 01 · State Snapshot
What a new house costs right now, by state
Sydney's total land-and-build package sits at $1.23 million, while Adelaide comes in at $815,500. That $418,000 gap between the two is driven almost entirely by land, not construction. The per-metre build rate across standard homes overlaps considerably across states; it's the land beneath that separates affordable markets from expensive ones. Queensland's forecast escalation rate of 7.0–7.5% means Brisbane is closing the gap on Sydney faster than any other city.
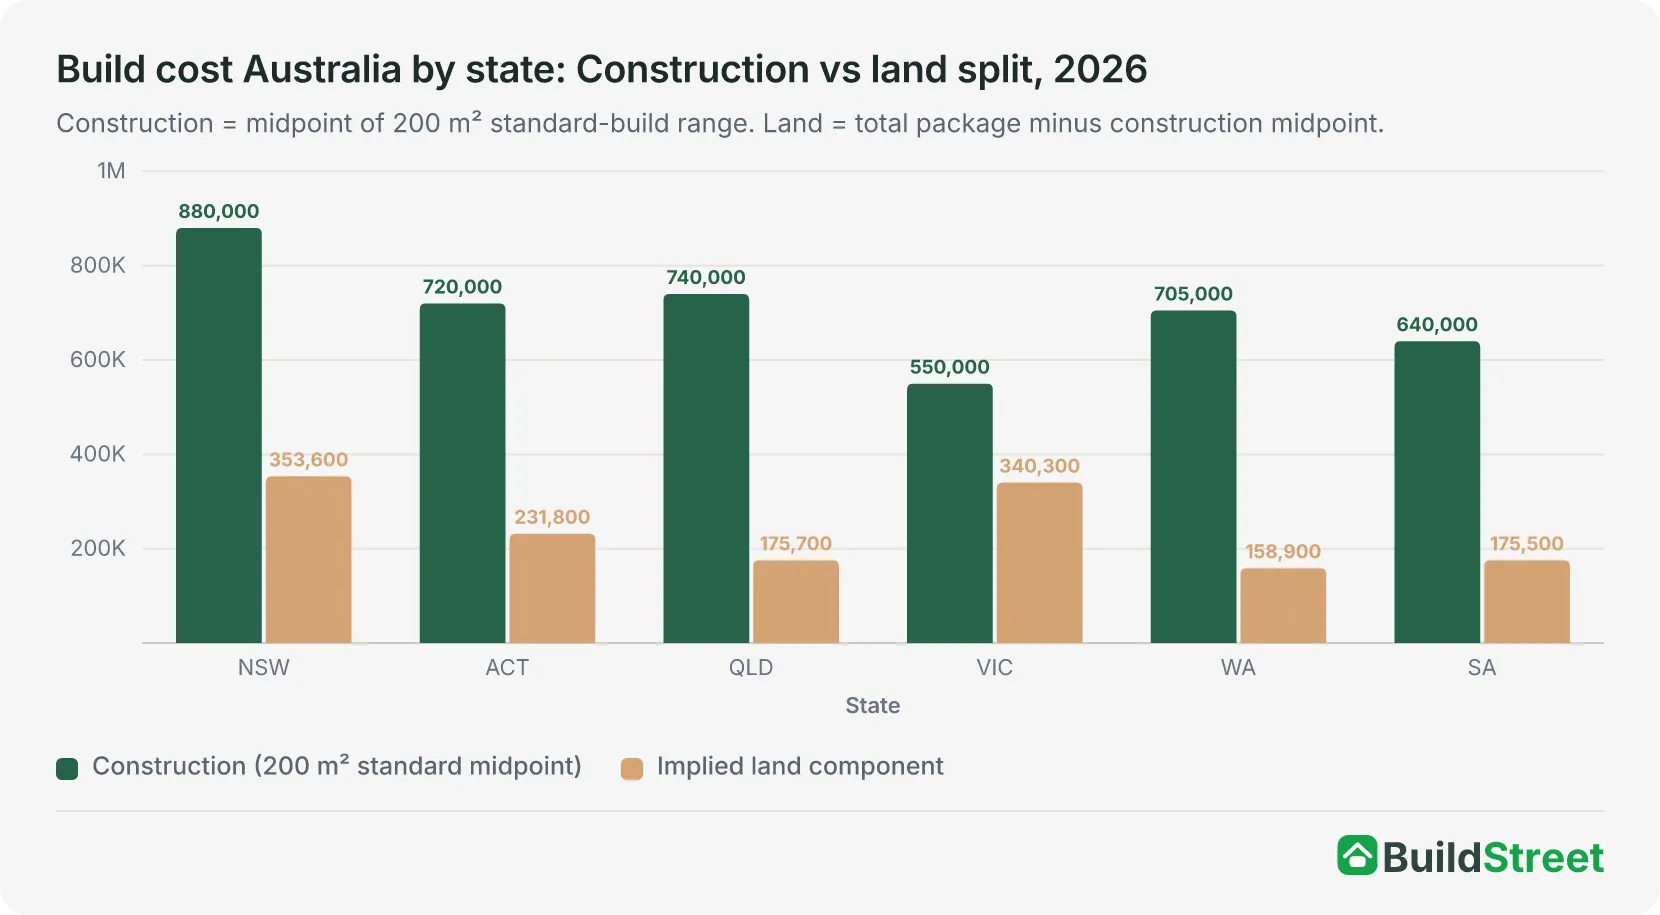
| State | Total (incl. land) | Construction /m² | 200 m² standard build | 2026 forecast |
|---|---|---|---|---|
| NSW (Sydney) | $1,233,600 | $3,300–$5,500+ | $660,000–$1,100,000 | 4.0–4.5% |
| ACT (Canberra) | $951,800 | $2,500–$4,700+ | $500,000–$940,000 | 4.5% |
| QLD (Brisbane) | $915,700 | $2,900–$4,500+ | $580,000–$900,000 | 7.0–7.5% |
| VIC (Melbourne) | $890,300 | $1,800–$3,700+ | $360,000–$740,000 | 4.0% |
| WA (Perth) | $863,900 | $2,300–$4,750+ | $460,000–$950,000 | 5.3–5.5% |
| SA (Adelaide) | $815,500 | $2,600–$3,800+ | $520,000–$760,000 | 5.1% |
| TAS | n/a | $1,700–$3,200+ | $340,000–$640,000 | n/a |
Source · ABS Building Activity, Australia, Dec 2025; Altus Group Q4 2025; RLB Market Intelligence Q1 2026.
Section 02 · 15-Year History
Average costs and home sizes, 2010 to 2025
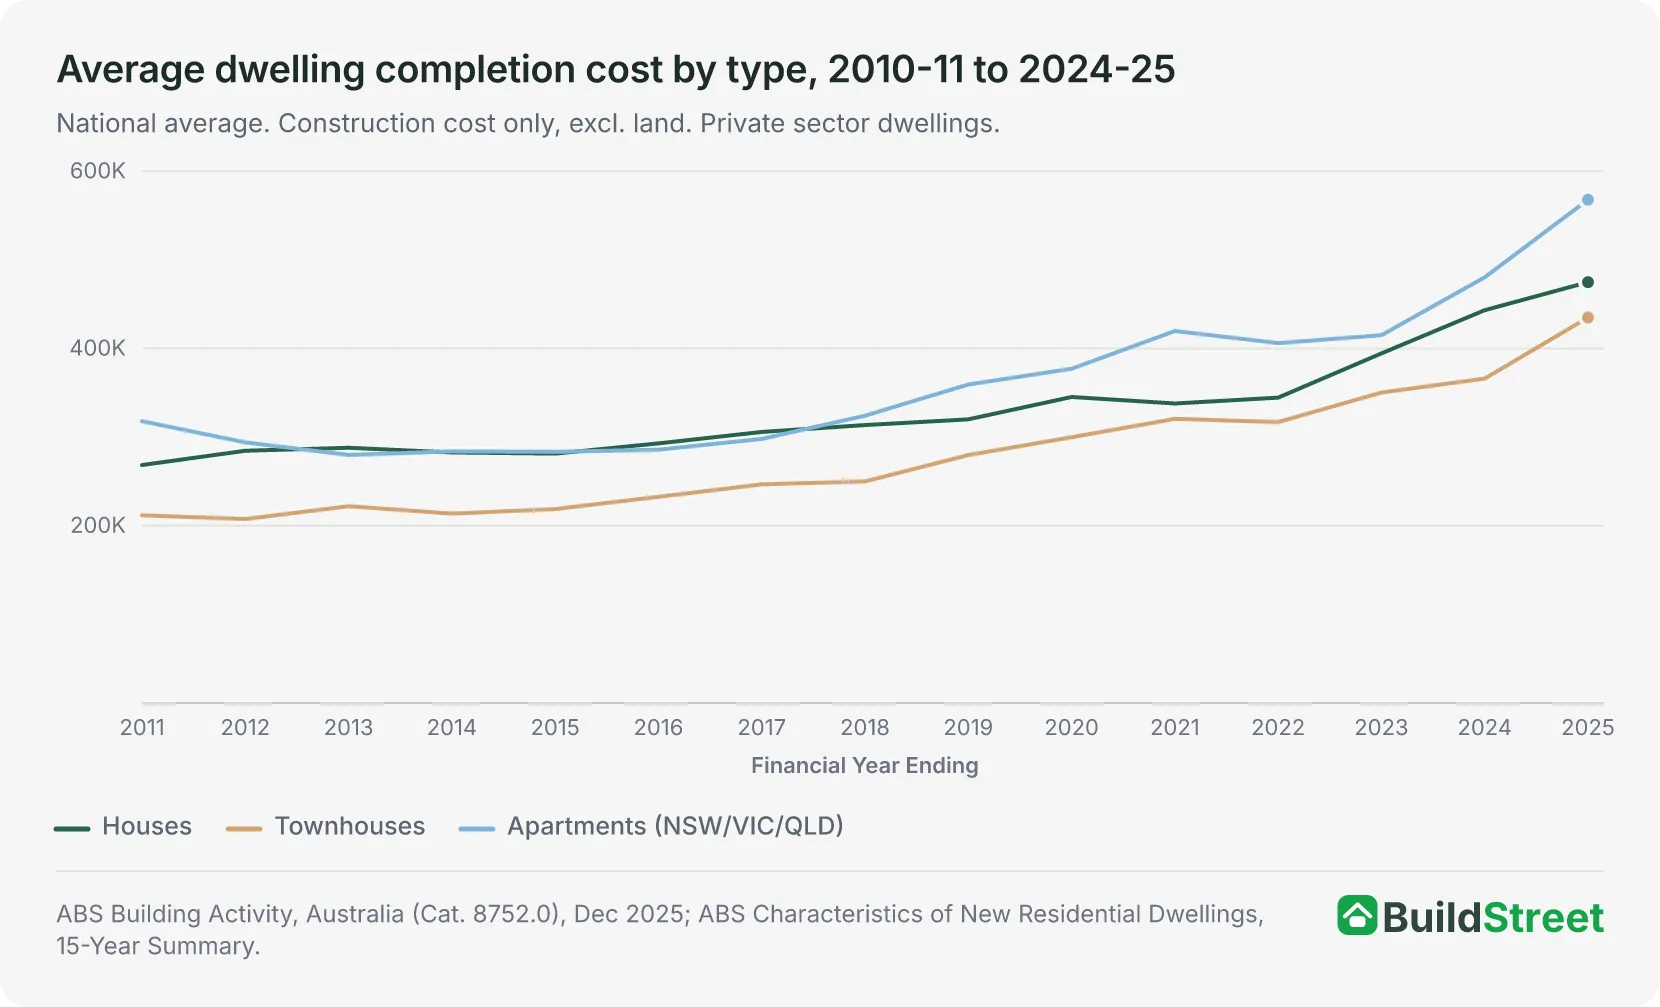
Construction costs held relatively steady through most of the 2010s, then the pandemic compressed nearly a decade of inflation into three years. House costs rose 77% nationally from 2010–11 to 2024–25, townhouses more than doubled at +105%, and the steepest single-year jump hit 14.5% between 2022–23 and 2023–24. Apartment data covers NSW, VIC and QLD only; the ABS does not publish apartment figures for other states due to insufficient completions. Apartment costs also carry a measurement bias because the ABS divides total building cost across all dwellings in a block, including shared lobbies and common areas.
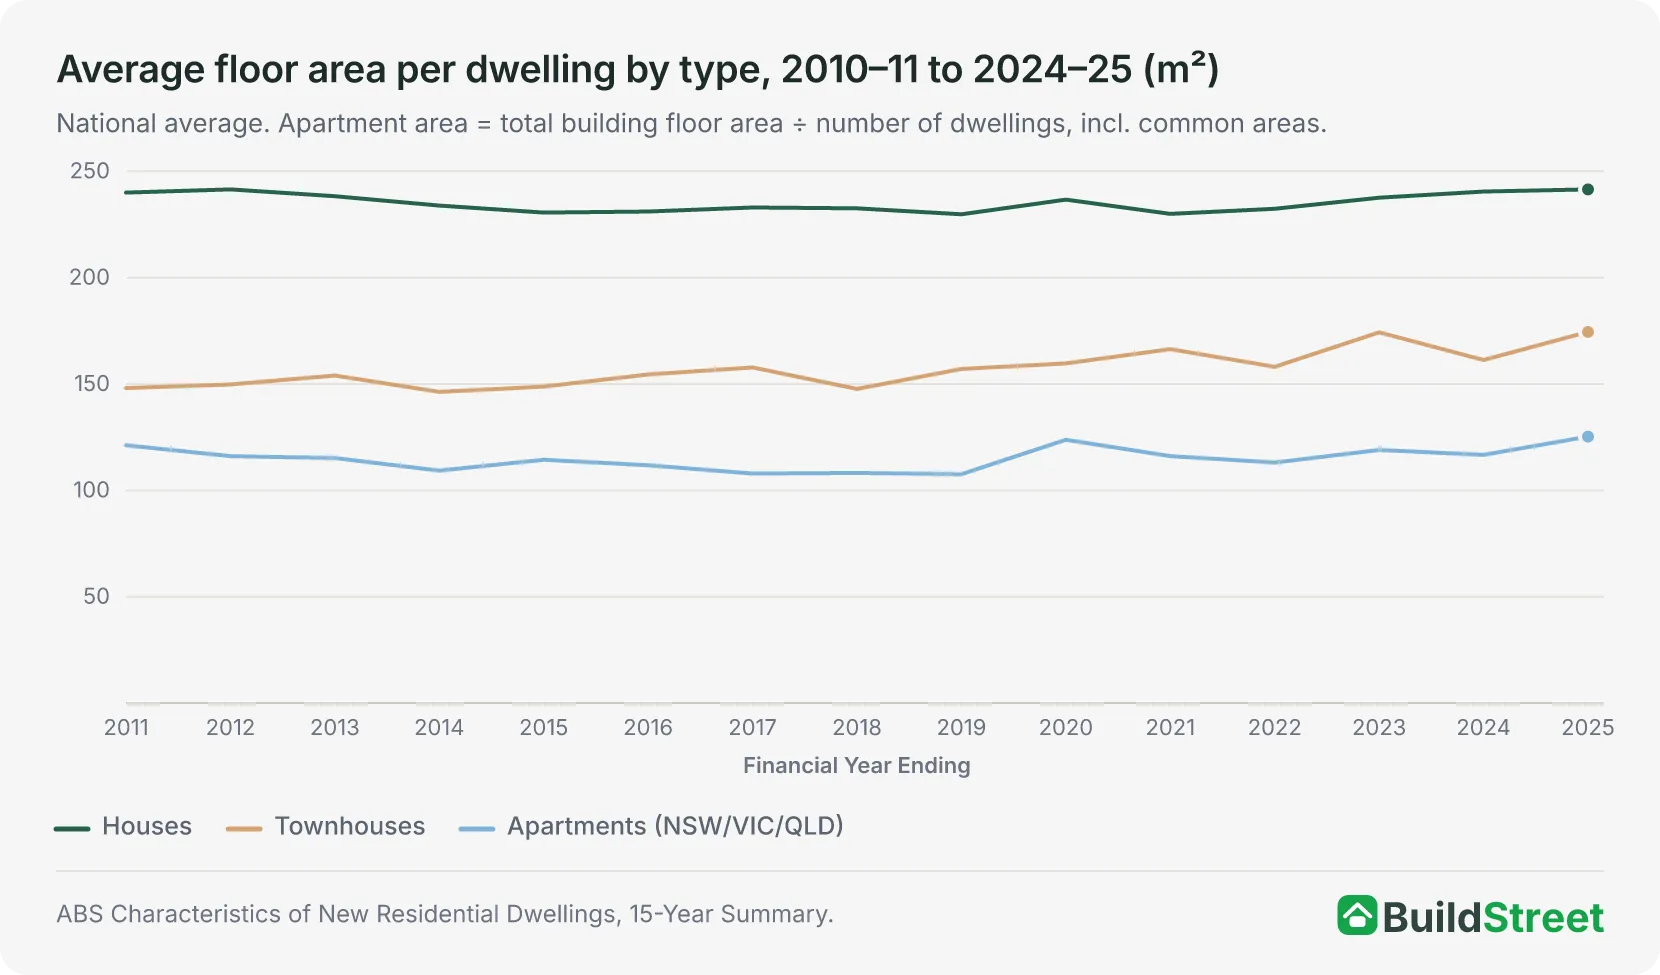
Australian houses are virtually the same size today as they were in 2010: 241.5 m² in 2024–25 against 240.0 m² in 2010–11. Costs nearly doubled while floor area barely moved. That divergence is pure price escalation per square metre, not bigger homes. Townhouses grew modestly from 148 m² to 174.5 m², partly reflecting a shift toward larger terrace-style builds in inner-city markets.
NSW and ACT consistently record the highest average build costs nationally. ACT's $645,052 average in 2024–25 partly reflects a project mix skewed toward larger, higher-spec builds. At the other end, SA's average of $389,949 makes it the most affordable state to build in. Select a dwelling type and toggle between average build cost and average floor area to see how each state compares.
| Houses (Average Build Cost) | |||||||||
|---|---|---|---|---|---|---|---|---|---|
| Financial year | NSW | VIC | QLD | SA | WA | TAS | NT | ACT | National |
| 2010–11 | $307,262 | $254,236 | $277,475 | $219,904 | $273,108 | $224,366 | $363,074 | $285,092 | $268,613 |
| 2011–12 | $314,320 | $274,796 | $287,295 | $228,912 | $299,387 | $248,132 | $364,020 | $317,314 | $284,739 |
| 2012–13 | $321,148 | $284,756 | $279,295 | $241,079 | $283,711 | $259,282 | $375,768 | $310,628 | $288,097 |
| 2013–14 | $302,125 | $278,664 | $278,471 | $236,618 | $282,923 | $257,675 | $359,826 | $344,831 | $282,801 |
| 2014–15 | $308,854 | $277,560 | $266,427 | $233,820 | $286,921 | $249,971 | $382,020 | $325,598 | $281,508 |
| 2015–16 | $322,446 | $287,773 | $293,191 | $247,811 | $281,321 | $255,154 | $379,050 | $372,205 | $293,042 |
| 2016–17 | $325,620 | $315,075 | $283,264 | $263,826 | $301,406 | $274,367 | $365,311 | $401,409 | $305,959 |
| 2017–18 | $348,264 | $316,537 | $289,319 | $270,979 | $297,428 | $291,538 | $356,110 | $431,504 | $313,715 |
| 2018–19 | $349,960 | $327,687 | $289,621 | $275,364 | $298,272 | $285,220 | $365,364 | $440,772 | $320,170 |
| 2019–20 | $399,478 | $345,201 | $312,857 | $279,083 | $316,846 | $302,974 | $354,256 | $450,478 | $345,410 |
| 2020–21 | $371,755 | $338,677 | $322,628 | $293,329 | $311,484 | $319,770 | $360,208 | $463,090 | $338,051 |
| 2021–22 | $400,728 | $343,478 | $324,125 | $295,292 | $293,958 | $340,891 | $376,957 | $455,259 | $344,656 |
| 2022–23 | $432,039 | $412,090 | $389,911 | $310,737 | $335,550 | $374,822 | $434,325 | $452,472 | $394,579 |
| 2023–24 | $520,907 | $433,431 | $450,807 | $371,627 | $380,874 | $411,797 | $471,006 | $563,824 | $443,333 |
| 2024–25 | $565,749 | $485,292 | $458,868 | $389,949 | $407,114 | $420,756 | $475,310 | $645,052 | $474,939 |
Source · ABS Building Activity, Australia (Cat. 8752.0), Dec 2025. Completion costs and floor areas for new private-sector dwellings by state, nominal dollars, land excluded. Apartment data covers NSW, VIC and QLD only.
Section 03 · Cost per square metre
What the ABS data implies about cost per square metre, by state
Western Australia is the most cost-efficient state to build in based on ABS 2024–25 completions, at $1,585/m² implied, despite Perth's rapidly rising land prices. NSW is the most expensive at $2,396/m². Tasmania's implied rate of $2,538/m² tops even NSW, driven by small sample size and the elevated cost of remote materials delivery. Worth noting across all states: ABS implied rates reflect contracts signed 12–24 months earlier, so they consistently sit below current QS quotes for new work.
| State | Avg house cost (2024–25) | Avg floor area (2024–25) | Implied cost/m² (ABS) | Current QS range (2026) |
|---|---|---|---|---|
| NSW | $565,749 | 236.1 m² | $2,396/m² | $3,300–$5,500+ |
| ACT | $645,052 | 298.2 m² | $2,163/m² | $2,500–$4,700+ |
| QLD | $458,868 | 230.9 m² | $1,987/m² | $2,900–$4,500+ |
| VIC | $485,292 | 253.5 m² | $1,914/m² | $1,800–$3,700+ |
| WA | $407,114 | 256.8 m² | $1,585/m² | $2,300–$4,750+ |
| SA | $389,949 | 218.1 m² | $1,788/m² | $2,600–$3,800+ |
| TAS | $420,756 | 165.8 m² | $2,538/m² | $1,700–$3,200+ |
| NT | $475,310 | 206.5 m² | $2,302/m² | $2,600–$3,500+ |
Source · ABS Building Activity, Australia, Dec 2025; Altus Group Q4 2025; RLB Q1 2026. Implied cost/m² = ABS 2024–25 state average completion cost divided by state average floor area. Current QS ranges are 2026 industry estimates for new contracts, which will exceed the ABS-implied rate.
Section 04 · Budget tiers
From basic brick-and-tile to fully bespoke: what each budget tier costs per square metre
Volume builders keep the floor low. Standard project homes with production-line designs and minimal selections sit at the bottom of these ranges. Moving to a semi-custom or architect-designed build can more than double the rate in NSW or the ACT. Three things consistently push a project out of its intended tier, regardless of state:
- Slope and site access. Sloping blocks need engineered retaining walls and split-level slabs. Narrow inner-city sites may require crane hire for material delivery. Either can add $30,000–$80,000+ before a single room is framed.
- Soil conditions. Reactive clay or uncompacted fill requires deep bored piers or heavily reinforced slabs instead of a standard footing. Geotechnical risk is rarely priced into a builder's base quote.
- Soft costs. Design fees, structural engineering, energy compliance reports, planning permits and surveying typically consume 10–15% of the total project budget before construction begins and rarely appear in a builder's base price.
| State | Standard / Volume | Mid-range / Semi-custom | Premium / Fully custom |
|---|---|---|---|
| NSW (Sydney) | $2,400–$3,200 | $3,200–$4,500 | $4,500–$8,000+ |
| VIC (Melbourne) | $1,800–$2,500 | $2,500–$3,700 | $3,700–$8,000+ |
| QLD (Brisbane / SEQ) | $2,200–$2,900 | $2,900–$3,800 | $3,800–$6,500+ |
| WA (Perth) | $2,300–$3,100 | $2,800–$3,500 | $4,000–$6,000+ |
| SA (Adelaide) | $2,100–$2,700 | $2,700–$3,400 | $3,400–$5,500+ |
| Tasmania | $2,400–$3,200 | $3,200–$4,200 | $4,200–$6,500+ |
| ACT (Canberra) | $2,500–$3,300 | $3,300–$4,500 | $4,500–$7,000+ |
| NT (Darwin) | $2,600–$3,500 | $3,500–$4,800 | $4,800–$7,500+ |
Source · Altus Group Q4 2025; RLB Q1 2026; BMT Cost Data, 2026. Rates are per m² and assume a flat, accessible site with M-class soil. Sloping blocks, reactive soils or remote locations will push costs beyond these ranges.
Section 05 · Land vs construction
Land has risen 500% in 25 years. Construction has risen 150%. That gap is the affordability crisis.
Building costs are not what made homeownership unaffordable in Australia. Construction and skilled labour costs rose by approximately 150% over the past 25 years. Residential land prices surged by more than 500% over the same period, more than double the Consumer Price Index and five times the rate of building material inflation.
The old 40/60 rule (where land accounts for 40% of total project value and the dwelling 60%) is now impossible in Sydney and increasingly unworkable in Brisbane and Melbourne. A mid-range 200 m² build in Sydney costs $660,000–$900,000 to construct; the median Sydney lot takes that project well above $1.3 million before landscaping, driveways or fencing.
The shortage is not land itself. It is shovel-ready land. State and local government zoning timelines, infrastructure servicing delays and developer contribution levies are all embedded in the retail lot price. Capital city lot sales fell 35.4% year-on-year in late 2025 as buyers hit their borrowing limits, yet median prices kept rising.
Section 06 · Government share
Before you pour a slab, you're already paying the government: how much each city extracts
A 2025 independent review of housing taxation identified how much of a new home's total cost flows to government through taxes, levies, infrastructure charges and regulatory compliance. Housing now carries one of the heaviest tax burdens of any consumer item in the Australian economy. GST applies only to new construction, stamp duty is levied on land and councils pass infrastructure contribution charges directly to the buyer. Those costs are typically borrowed against, meaning 30 years of compounding interest on top of the original tax bill.
| Capital city | Taxes on house & land package | Share of total | Change since 2019 | Taxes on new apartment | Apt. share |
|---|---|---|---|---|---|
| Sydney | $576,000 | approx. 50% | +$160k (+38%) | $346,000 | 38% |
| Brisbane | $257,000 | 34% | +$179k (+106%) | $256,000 | 34% |
| Melbourne | $237,000 | 32% | +$47k since 2019 | $236,000 | 32% |
| Perth | n/a | approx. 30% | n/a | $149,000 | 30% |
| Adelaide | n/a | approx. 31% | n/a | $183,000 | 31% |
Source · Centre for International Economics / HIA, Taxation's Major Impact on Housing, 2025. Government costs include GST, stamp duty on land, infrastructure charges and developer contribution levies. These are typically financed over a mortgage, compounding the total amount paid. Perth and Adelaide house-and-land package totals were not published in this review.
The same review identified a significant "time tax." Development approvals for a subdivision now take over a year on average, with at least seven months attributed to avoidable delays. In a high-rate environment, holding costs on development land during that wait compound directly into the final price.
Section 07 · Build vs Buy
Is building cheaper than buying? What the data actually shows
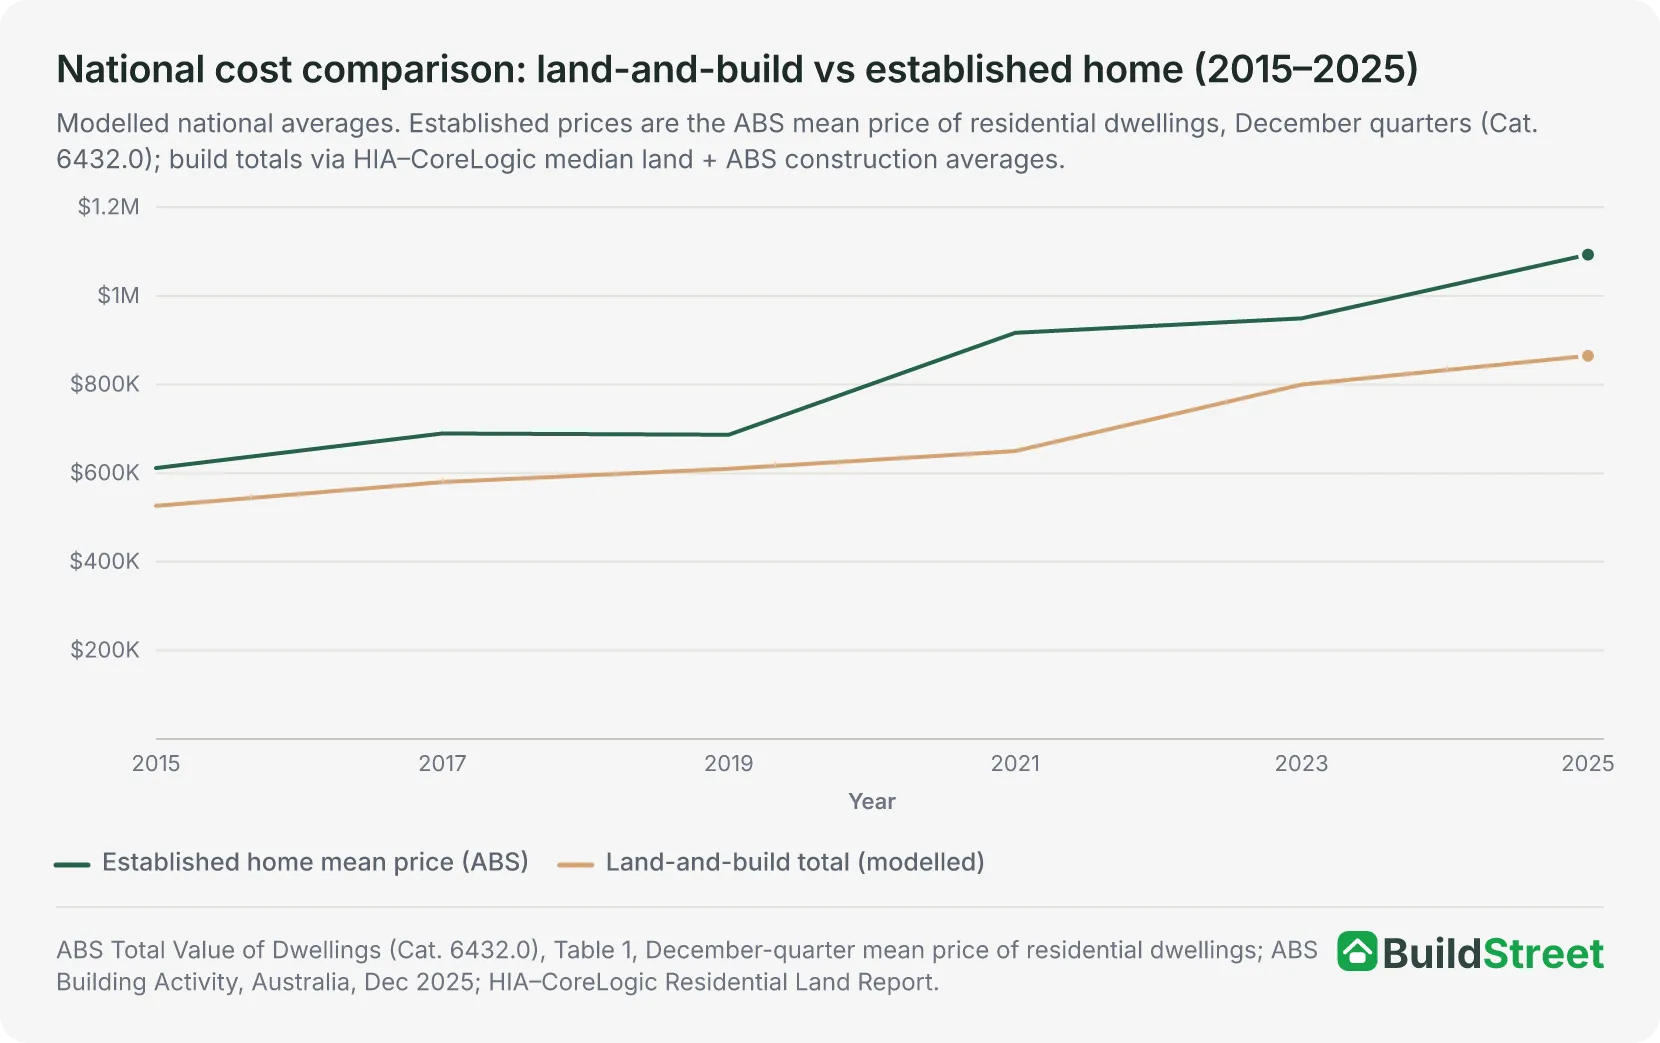
The dollar gap between buying established and building has grown from $85,300 in 2015 to $228,253 in 2025. That widening is mostly the story of established home prices accelerating, not building becoming cheaper. In real terms, building a new home now costs significantly more than it did a decade ago. But the price advantage of the land-and-build pathway has held consistently, every year across the full period.
Section 08 · First home buyers
What first home buyers can still claim: grants and concessions by state
Queensland offers the most generous grant nationally at $30,000, extended beyond June 2026 in the 2026–27 state budget3; Tasmania's grant fell to $20,000 for contracts signed from 1 July 20264. The federal 5% Deposit Scheme lets eligible buyers build or purchase with as little as a 5% deposit (2% for single parents), bypassing Lenders Mortgage Insurance entirely. The First Home Super Saver Scheme allows voluntary super contributions to be withdrawn at concessional tax rates to fund a deposit.
Demand-side grants in a supply-constrained market tend to get absorbed into higher land and property prices rather than improving net affordability. The grants help individual buyers cross the deposit threshold, but the broader market benefit is typically captured by land developers and volume builders. The structural fix is land supply reform, not cash grants.
| State / Territory | FHOG (2026) | Key conditions and stamp duty concessions |
|---|---|---|
| Queensland | $30,000 | Most generous nationally. Extended beyond 30 June 2026 in the 2026–27 state budget. New home must be valued under $750,000. Stamp duty abolished for first home buyers on new homes. |
| Tasmania | $20,000 | Reduced from $30,000: $20,000 for contracts signed 1 July 2026–30 June 2027. No property price cap on the grant. The full stamp duty exemption on established homes under $750,000 ended 30 June 2026. |
| South Australia | $15,000 | No property value cap for contracts signed post-June 2024. Zero stamp duty for eligible first-home buyers on new builds. |
| New South Wales | $10,000 | New builds up to $600,000 (or building contracts to $750,000). Supplemented by the First Home Buyer Assistance Scheme for stamp duty concessions. |
| Victoria | $10,000 | New homes up to $750,000. Full stamp duty exemption under $600,000; sliding-scale concession to $750,000. |
| Western Australia | $10,000 | New builds only. Modest relief against Perth's rapidly rising construction and land costs. |
| Northern Territory | $10,000 | New builds. Supplemented by specific home renovation grants for targeted demographic categories. |
| ACT | Nil (replaced) | FHOG abolished. Replaced by the Home Buyer Concession Scheme (HBCS), offering means-tested stamp duty concessions up to $35,238. |
References
- HIA, Housing target depends on faster land supply — HIA–Cotality Residential Land Report, March quarter 2026 · hia.com.au ↑
- ABS, Consumer Price Index, Australia, July 2026 · Australian Bureau of Statistics ↑
- Queensland Government, A Place to Call Home: Extending the $30,000 first home owner grant · aplacetocallhome.initiatives.qld.gov.au ↑
- First Home Owner Grant eligibility and historical amounts · sro.tas.gov.au ↑
- ABS Building Activity, Australia, March 2026 (Cat. 8752.0) · Australian Bureau of Statistics
- ABS Characteristics of New Residential Dwellings, 15-Year Summary · Australian Bureau of Statistics
- ABS Consumer Price Index, Australia (latest release, Cat. 6401.0) · Australian Bureau of Statistics
- Altus Group, Australian Construction Price Outlook Q4 2025 · altusgroup.com
- RLB Australia Market Intelligence Update, Q1 2026 · rlb.com
- CIE / HIA, Taxation's Major Impact on Housing (2025 Report) · hia.com.au
- HIA–CoreLogic Residential Land Report, Q3 2025 · hia.com.au
- Master Builders Australia, New home building inflation hits 16-month high · masterbuilders.com.au
