

Published 28 Aug 2026 · Updated 18 Sept 2026
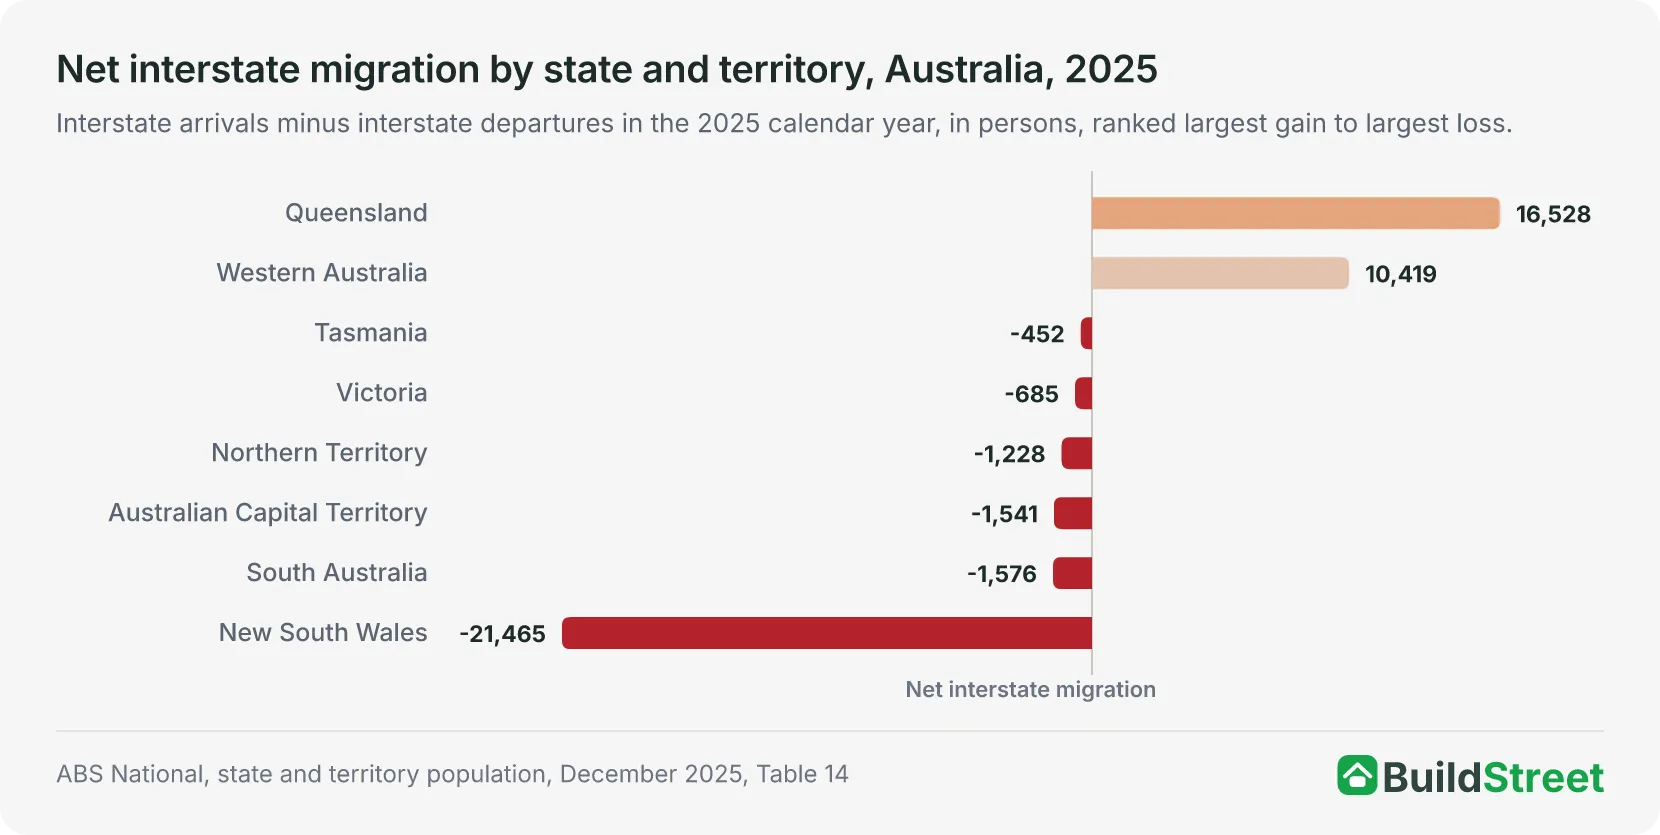 Where interstate migrants goWestern Australia gained a net 10,419 people from the other states and territories in 2025, the second largest gain of any jurisdiction, in its sixth consecutive year of net gains. The interstate migration article covers the flows between all eight states and territories, and how they shifted from 2020 onwards.
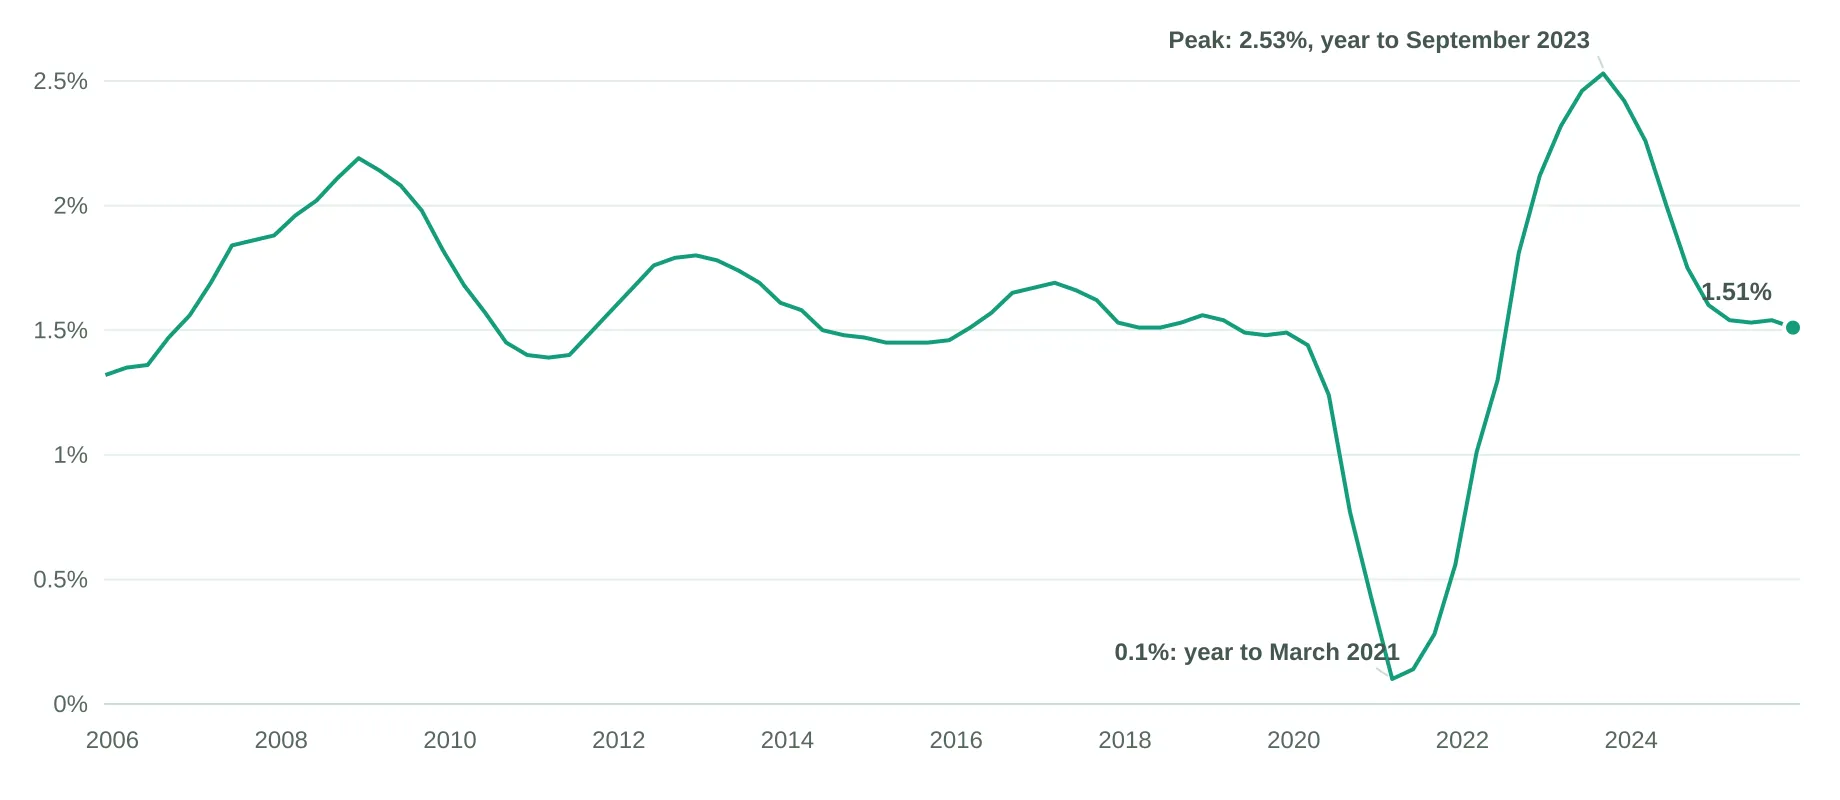 The national picture in fullWestern Australia held 11.1 per cent of Australia's people at 31 December 2025. The national population article covers the 27.8 million total, how fast it is changing, and the births, deaths and migration behind it.
Section 01 · The headline number
How many people live in Western Australia?
Western Australia had an estimated resident population of 3,076,528 at 31 December 2025, the most recent quarter in the ABS series1. That represented 11.1 per cent of Australia's 27,801,023 people.
It was the fourth-largest population of any state or territory, behind New South Wales at 8,641,085, Victoria at 7,121,913 and Queensland at 5,712,1241.
The ABS updates the estimate each quarter. The next release, covering the March quarter 2026, is due on 17 September 20261.
Section 02 · The pace
How fast is Western Australia's population growing?
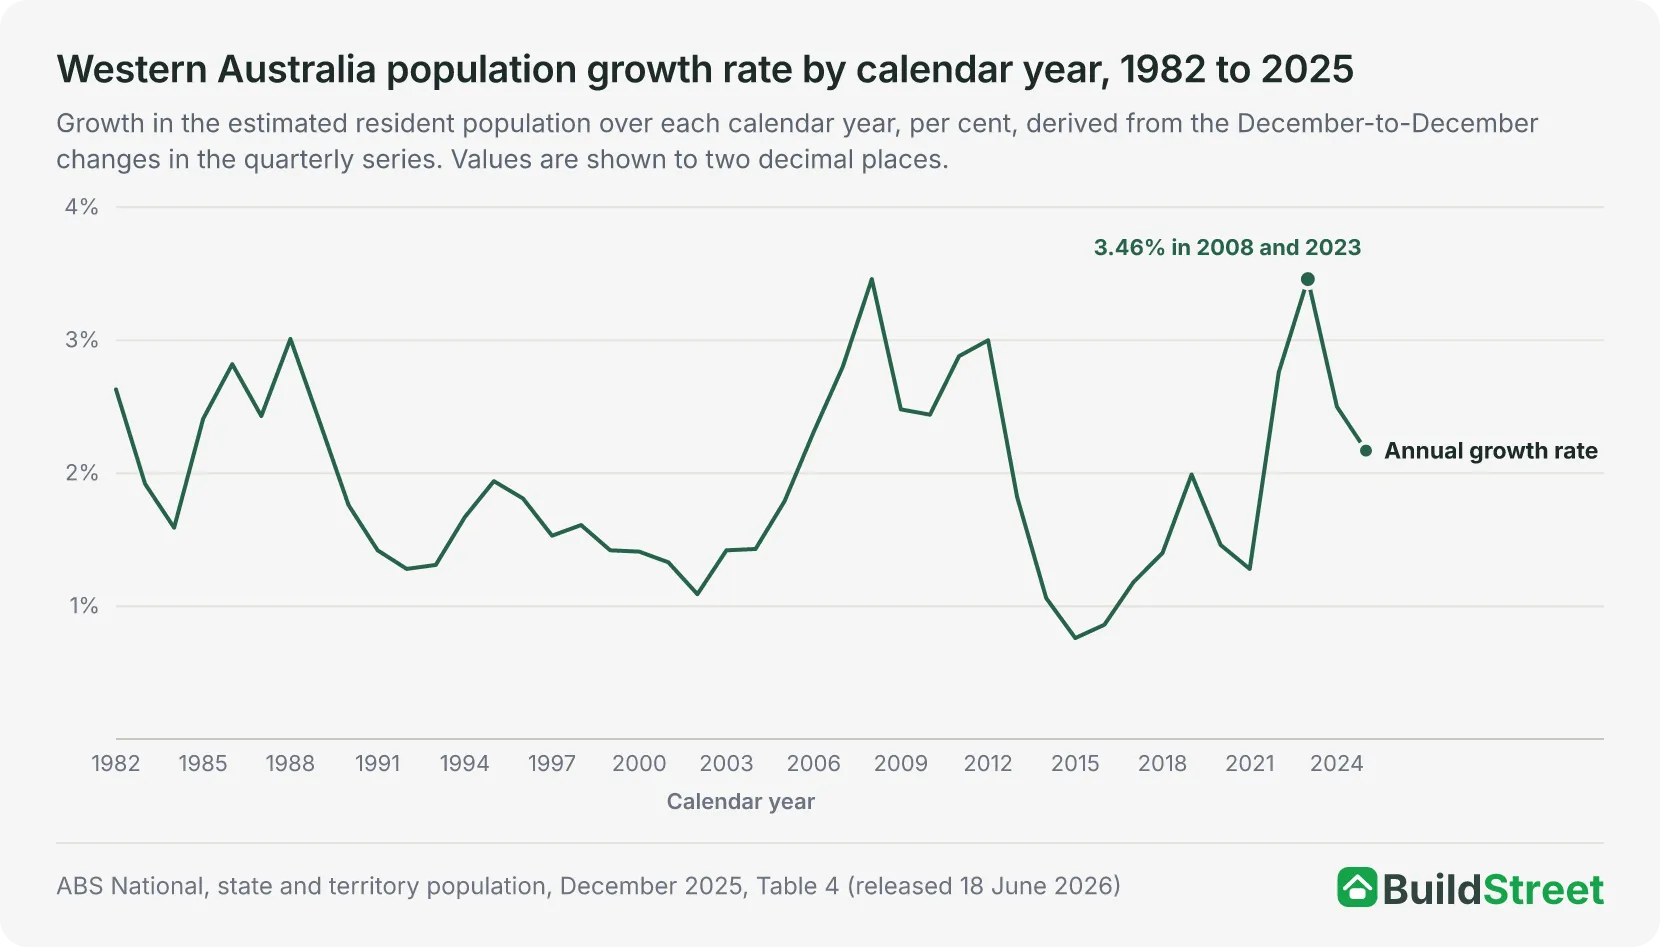
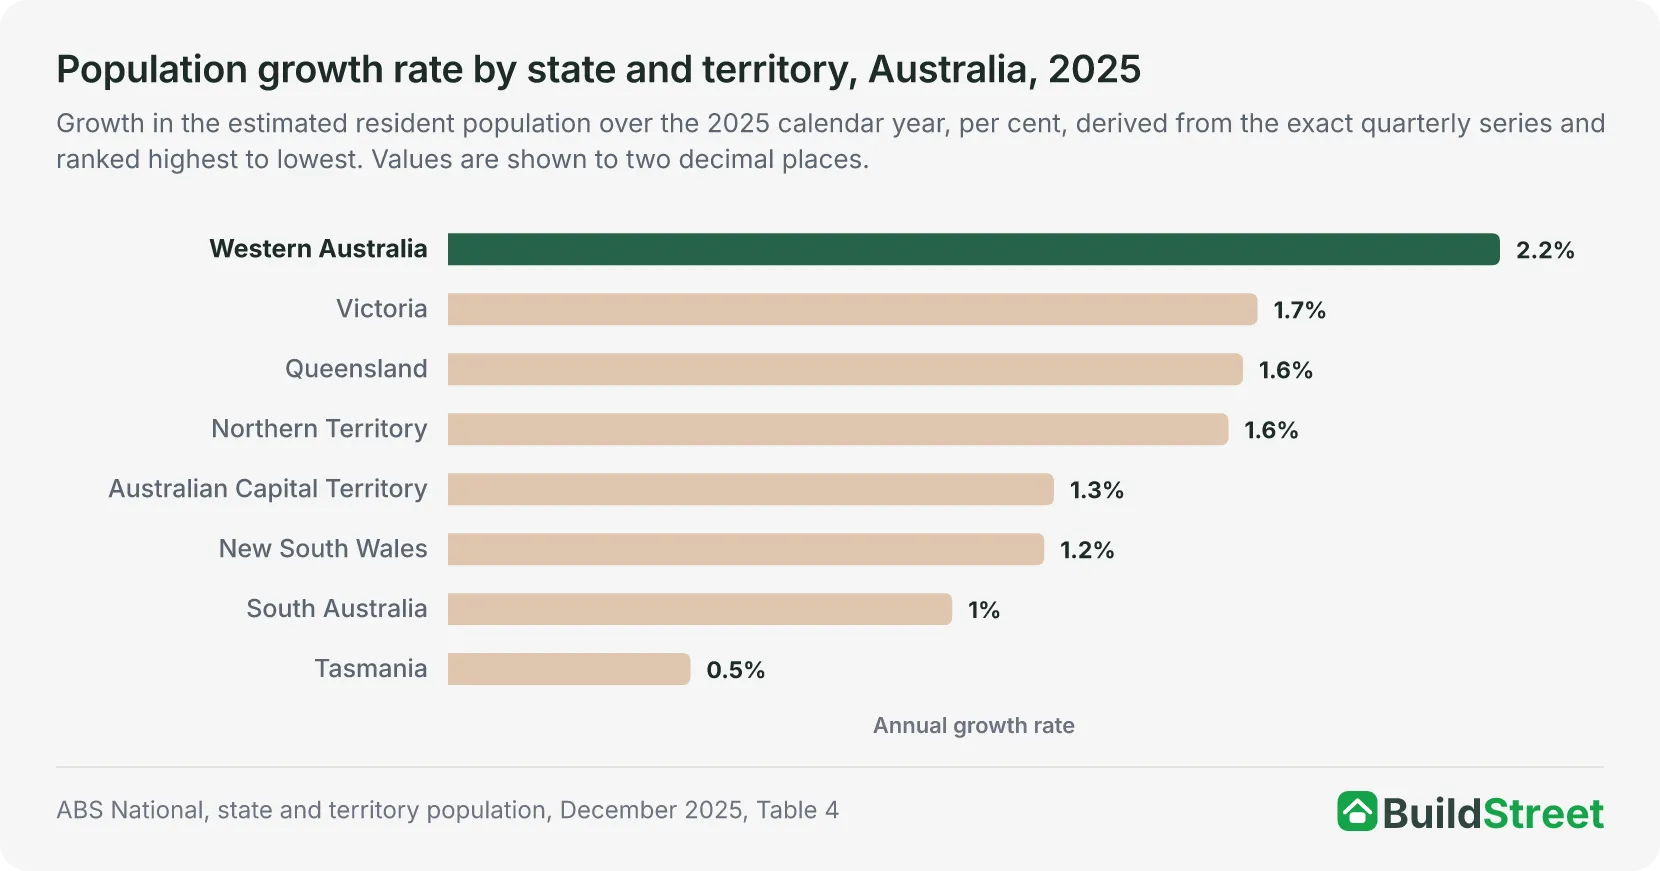
Western Australia added 65,465 people, or 2.17 per cent, in the year to 31 December 2025. The ABS summary rounds this to 65,500 or 2.2 per cent. Western Australia had the fastest growth rate of the eight states and territories1. By population growth, it ranked fourth, behind Victoria's 117,315, New South Wales's 104,611 and Queensland's 92,162.
The population has increased in every calendar year since 1982. Across the 44 calendar years from 1982 to 2025, based on the December-to-December changes in the quarterly series, the slowest growth came in 2015, when the state added 19,126 people or 0.76 per cent, the smallest increase and the slowest rate over that period. The fastest rates came in 2008 and 2023, both 3.46 per cent when rounded to two decimal places, with 2008 marginally faster before rounding; the largest increase was 98,124 people, in 20231.
Year-ending growth measured at other quarters covered a wide range. It slowed to 15,306 people or 0.60 per cent in the year to the June quarter 2016, the slowest reading from 1982 to 2025, and peaked at 100,315 or 3.56 per cent in the year to the September quarter 20231.
Section 03 · The drivers
What drives population growth in Western Australia?
Western Australia's population growth came from three components in the year to 31 December 2025. Net overseas migration added 40,422 people, natural increase (births minus deaths) added 14,624, and net interstate migration added 10,4191. The three components totalled 65,465, matching the state's population increase over the year.
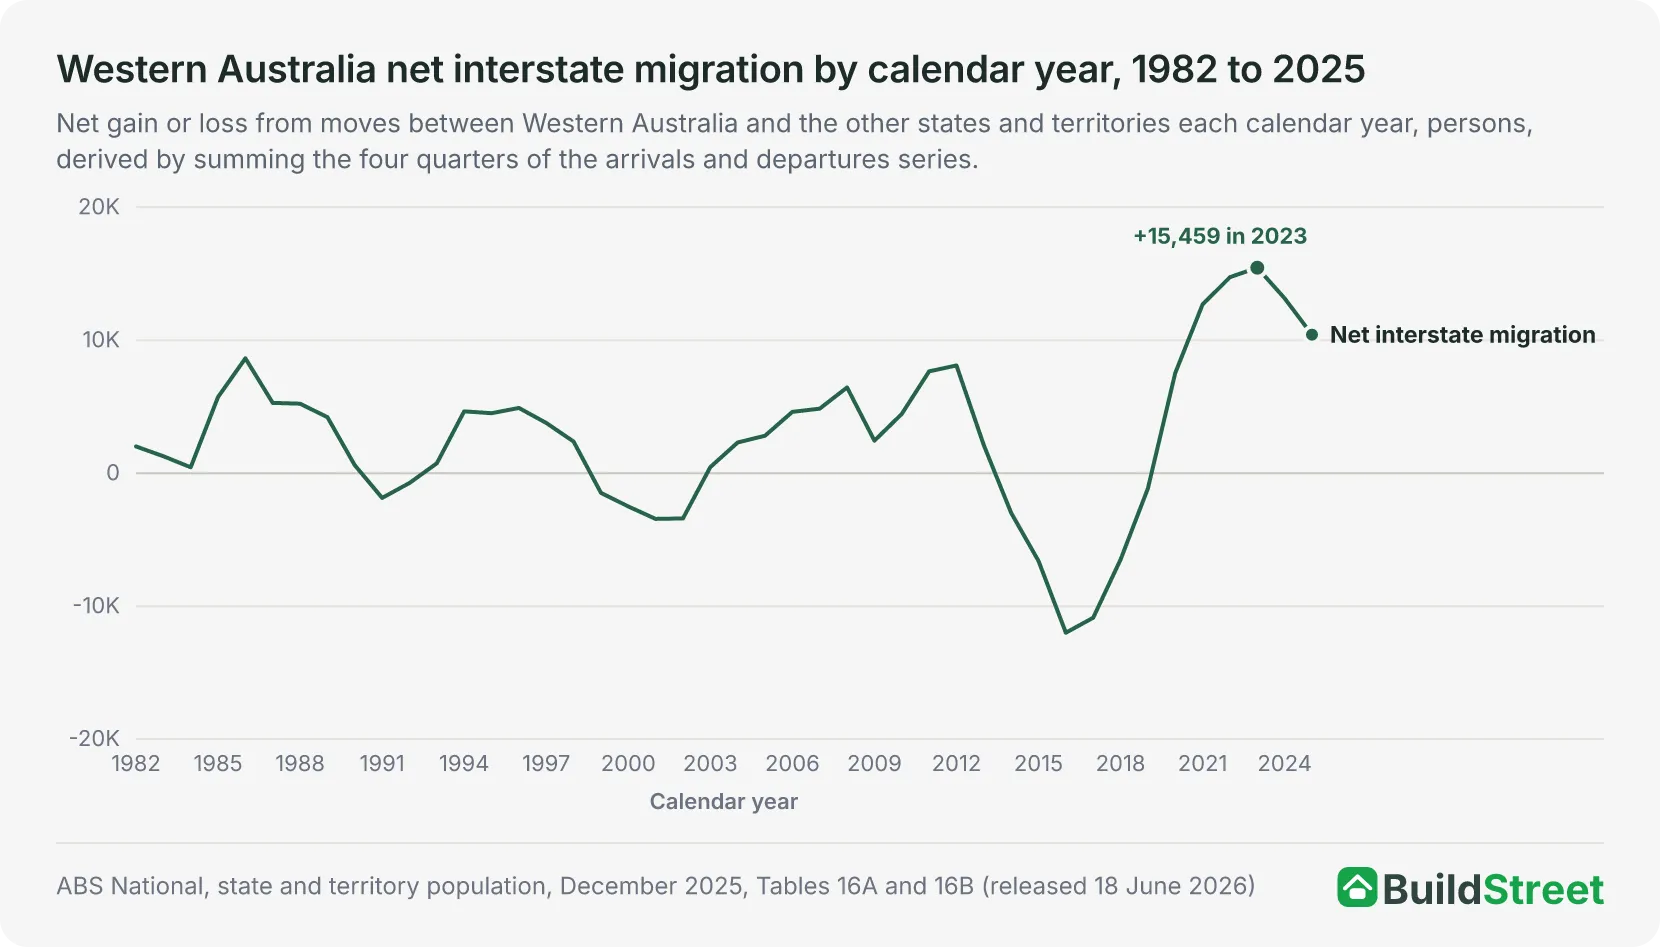
The interstate gain was the second largest in the country. A net 10,419 people moved to Western Australia from the other states and territories in 2025: 37,796 arrived and 27,377 left. Queensland, with a net gain of 16,528, was the only other jurisdiction to gain; the other six recorded net losses1. The 2025 gain was the smallest since 2020. After peaking at 15,459 in 2023, the largest gain from 1982-2025, the net inflow fell to 13,151 in 2024 and 10,419 in 2025.
The interstate flow has changed direction several times since 1982. Western Australia recorded a net gain in 32 of the 44 calendar years from 1982 to 2025, based on calendar-year totals of quarterly arrivals and departures, including each of the six years from 2020 to 2025. It recorded a net loss in each of the six years from 2014 to 2019, reaching a loss of 11,998 people in 2016, the largest over the period1.
The national birth and death series behind natural increase is covered in the births and deaths article.
| Western Australia's population growth by component, year to 31 December 2025 | ||
|---|---|---|
| Component | People | Derivation |
| Net overseas migration | +40,422 | 69,573 arrivals minus 29,151 departures |
| Natural increase | +14,624 | 32,906 births minus 18,282 deaths |
| Net interstate migration | +10,419 | 37,796 arrivals minus 27,377 departures |
| Total growth | +65,465 | Derived sum; the release's summary rounds it to 65,500 |
Source · ABS National, state and territory population, December 2025.
Section 04 · Perth and the regions
How much of Western Australia's population lives in Perth?
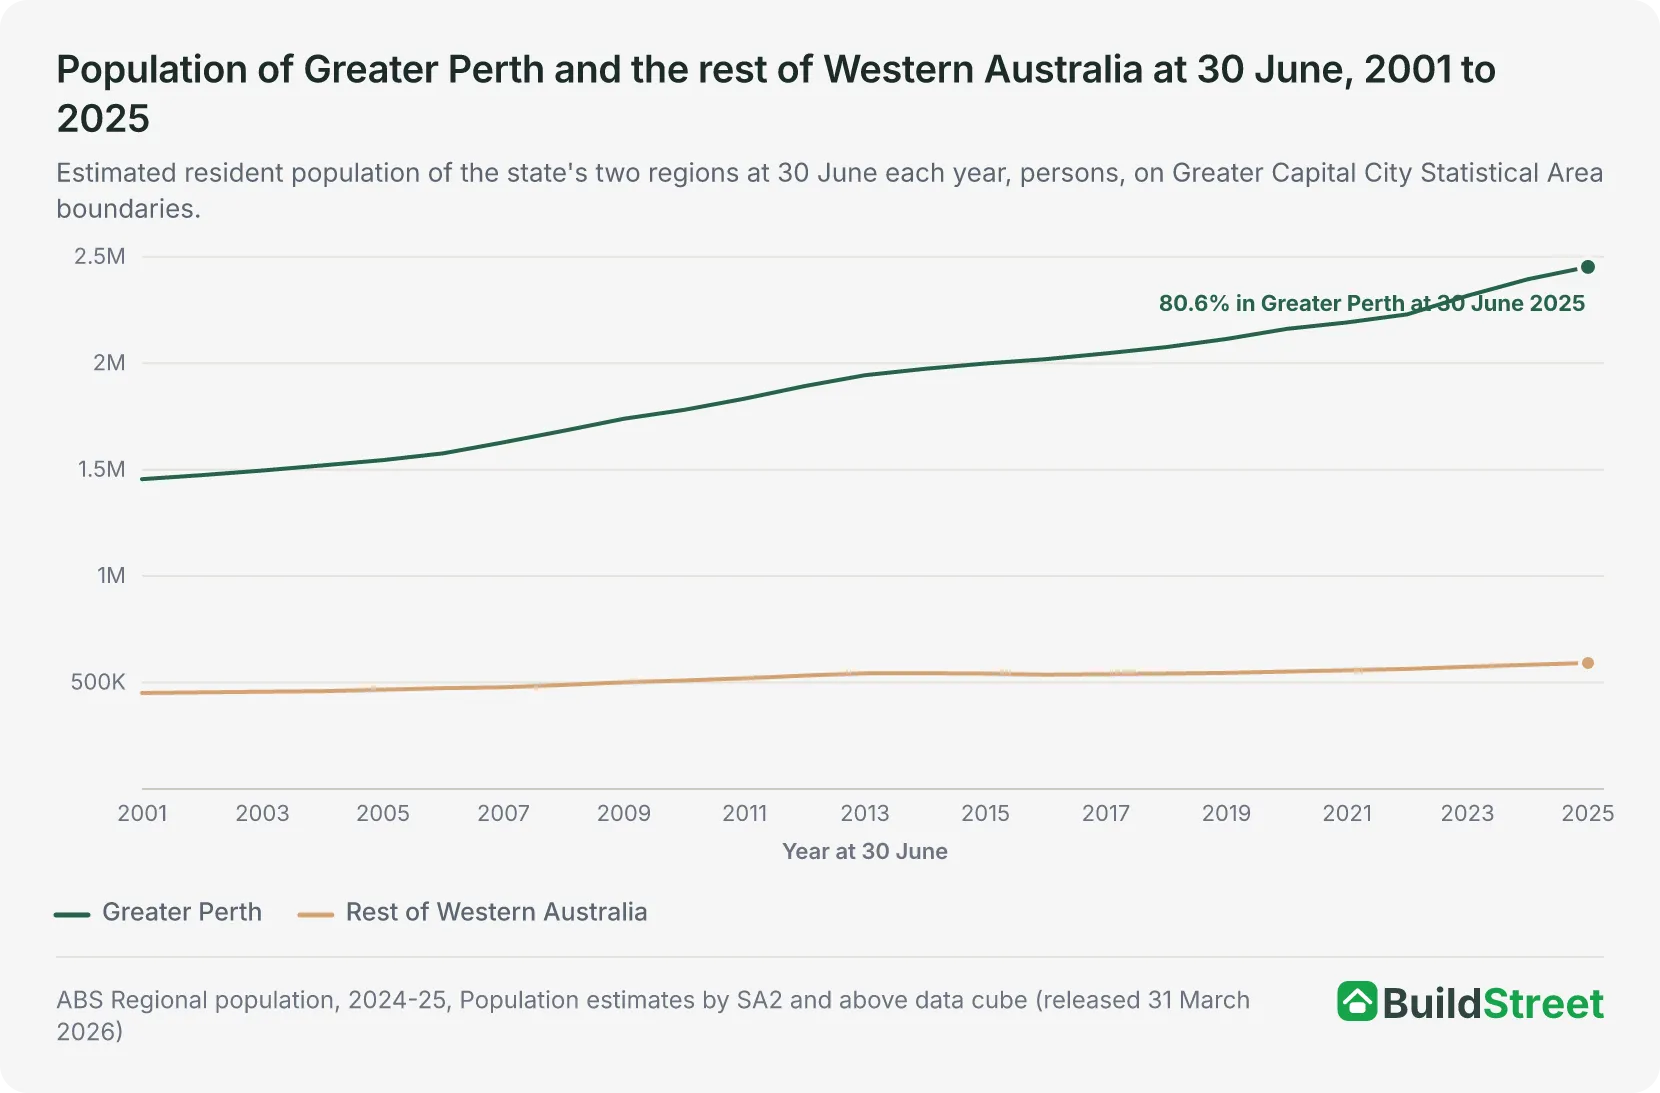
Western Australia had a larger share of its people in the capital than any other state at 30 June 2025. Greater Perth held 2,452,765 people at 30 June 2025 and the rest of the state 591,617, so the capital held 80.6 per cent of the 3,044,382 people23.
Among the other state capitals, Adelaide held 78.4 per cent of its two-region total, Melbourne 76.8, Sydney 65.6, Brisbane 50.0 and Hobart 44.323.
Perth's share increased from 76.3 per cent of the two-region total at 30 June 2001 to 80.6 per cent at 30 June 2025, and the population difference between the capital and the rest of the state widened from 1,004,448 people to 1,861,148 over the same period. The rest of the state's population fell in 2014-15 and 2015-16, from 543,685 at 30 June 2014 to 536,715 at 30 June 2016, before resuming growth23.
Greater Perth grew faster than any other capital city in 2024-25. The capital grew by 58,088 people or 2.4 per cent over the financial year, and the rest of the state by 8,147 or 1.4 per cent. The ABS publishes these increases, rounded, as 58,100 and 8,100. Perth had the highest growth rate of the eight capital cities, at 2.4 per cent, followed by Brisbane at 2.1 and Melbourne at 2.02. Greater Perth's growth comprised net overseas migration of 37,300 people, natural increase of 12,600 and a net internal migration gain of 8,200, rounded to the nearest hundred. Brisbane and Perth were the only capitals to have net internal migration gains.
The largest population increases in the state in 2024-25 were on Perth's outer edges. Alkimos - Eglinton, in the outer north-west, grew by 2,500 people, Brabham - Henley Brook, in the outer north-east, by 1,800 and Baldivis - North, in the outer south, by 1,700. These three areas had the highest growth rates in the state, at 13, 12 and 11 per cent. Alkimos - Eglinton also recorded the state's largest net internal migration gain, at 1,900 people2.
The capital's own long-run series is covered in the Perth population article.
| Greater Capital City Statistical Area boundaries, at 30 June 2025 | ||||
|---|---|---|---|---|
| Region | Population | Change over 2024-25 | Growth rate % | Share of two-region total % |
| Greater Perth | 2,452,765 | +58,088 | 2.4 | 80.6 |
| Rest of Western Australia | 591,617 | +8,147 | 1.4 | 19.4 |
| Two regions combined | 3,044,382 | +66,235 | 2.2 | 100.0 |
Source · ABS Regional population, 2024-25, Population estimates by SA2 and above data cube.
Section 05 · The national picture
How does Western Australia compare with the other states and territories?
Western Australia was the fourth most populous state or territory at 31 December 2025. It had 2,635,596 fewer people than Queensland and 1,165,975 more than South Australia1. Western Australia has ranked fourth in every quarter since the March quarter 1982, when its population first exceeded South Australia's. It ranked fifth in the first three quarters from June 1981.
How the state ranks depends on the measure. Western Australia's population grew by 2.17 per cent in 2025, the fastest of the eight states and territories, ahead of Victoria's 1.67 per cent, Queensland's 1.64 and the Northern Territory's 1.61. Its increase of 65,465 people ranked fourth, behind Victoria's 117,315, New South Wales's 104,611 and Queensland's 92,162, while its net interstate migration gain of 10,419 ranked second1. The ABS reports that net overseas migration was the major contributor to population change in all states and territories in the year ending 31 December 2025.
| Population by state and territory, Australia, as at 31 December 2025 | |||
|---|---|---|---|
| State or territory | Population | Change over 2025 | Growth rate % |
| New South Wales | 8,641,085 | +104,611 | 1.23 |
| Victoria | 7,121,913 | +117,315 | 1.67 |
| Queensland | 5,712,124 | +92,162 | 1.64 |
| Western Australia | 3,076,528 | +65,465 | 2.17 |
| South Australia | 1,910,553 | +19,728 | 1.04 |
| Tasmania | 579,110 | +2,908 | 0.50 |
| Australian Capital Territory | 487,202 | +6,033 | 1.25 |
| Northern Territory | 267,478 | +4,240 | 1.61 |
| Australia | 27,801,023 | +412,494 | 1.51 |
Source · ABS National, state and territory population, December 2025, Table 4.
Section 06 · The long run
How has Western Australia's population grown since 1981?
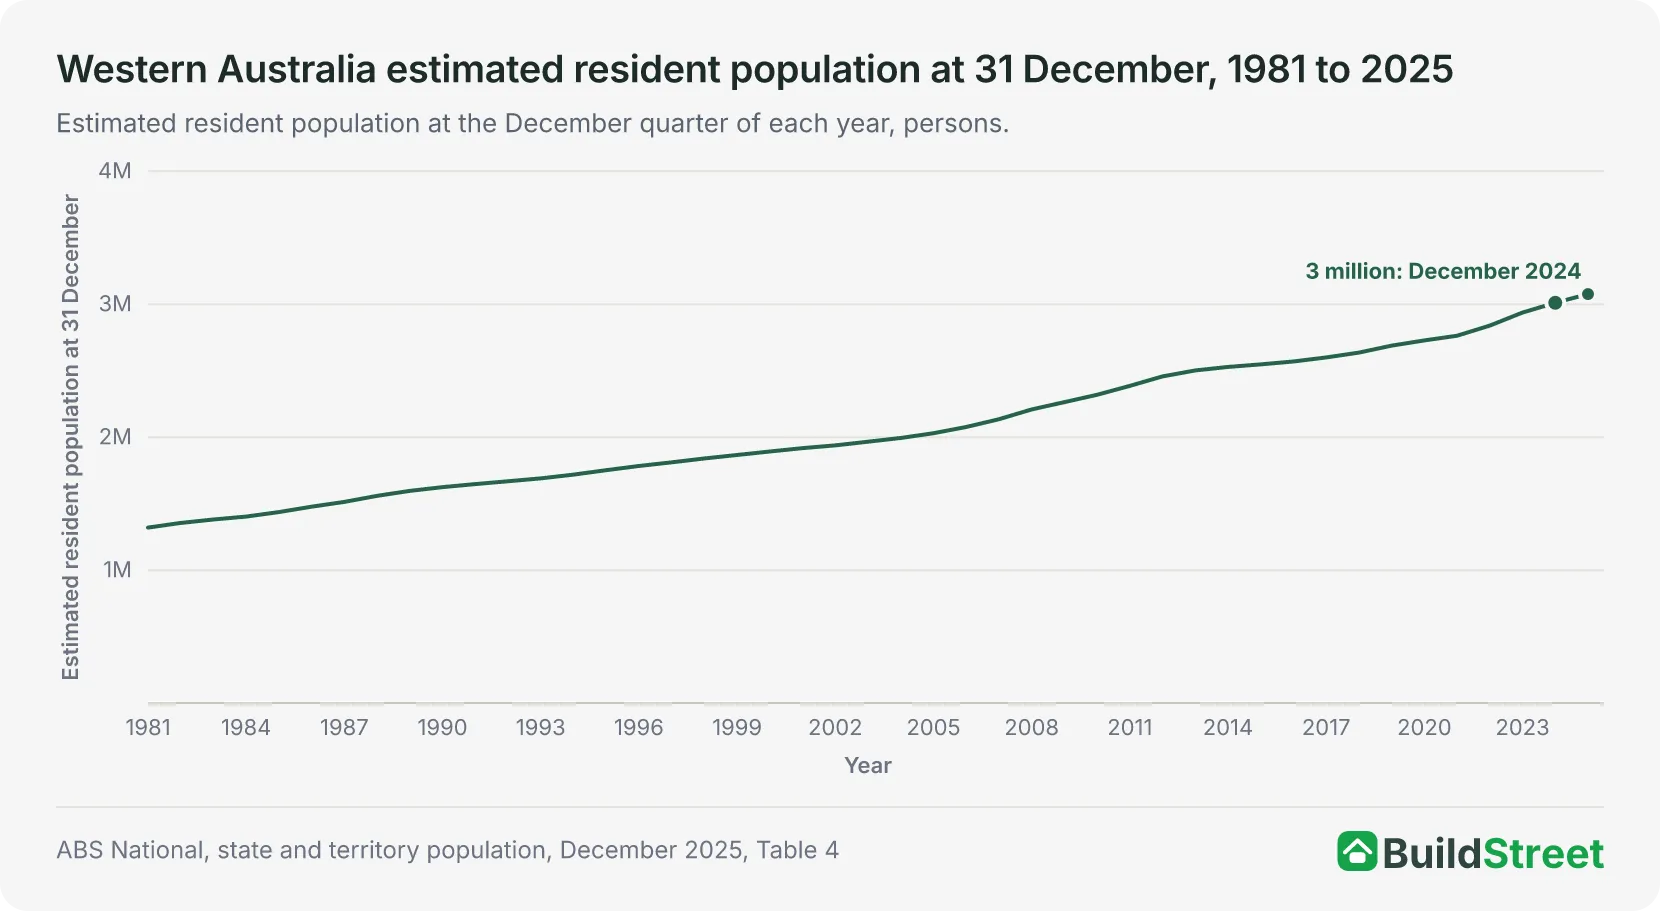
The state added 1,756,307 people between 31 December 1981 and 31 December 2025, growing from 1,320,221 to 3,076,528, or 2.33 times its 1981 population1.
Western Australia first exceeded 1.5 million people in the September quarter 1987, 2 million in the March quarter 2005, 2.5 million in the December quarter 2013 and 3 million in the December quarter 20241. These milestones are based on the first quarter in which the population reached or exceeded each threshold. The gaps between milestones were 17 years and 6 months from 1.5 million to 2 million, 8 years and 9 months from 2 million to 2.5 million, and 11 years from 2.5 million to 3 million.
The annual increase fell from 52,395 people in 2019 to 39,388 in 2020 and 35,053 in 2021, then rose to 76,283 in 2022 and 98,124 in 2023, before falling to 73,416 in 2024 and 65,465 in 2025, based on the December-to-December population changes1.
| Western Australia population milestones since 1981 | ||
|---|---|---|
| Milestone | First quarter at or above | Population that quarter |
| 1.5 million | September quarter 1987 | 1,505,294 |
| 2 million | March quarter 2005 | 2,004,644 |
| 2.5 million | December quarter 2013 | 2,502,188 |
| 3 million | December quarter 2024 | 3,011,063 |
Source · ABS National, state and territory population, December 2025, Table 4.
Section 07
Western Australia population: quick answers
What is the population of Western Australia?
Western Australia had an estimated resident population of 3,076,528 at 31 December 2025, according to the latest ABS quarterly population data, released on 18 June 20261. That was 11.1 per cent of Australia's 27,801,023 people and the fourth largest population of any state or territory, behind New South Wales, Victoria and Queensland. The next update, covering the March quarter 2026, is due on 17 September 2026.
How fast is the Western Australian population growing?
Western Australia added 65,465 people, or 2.17 per cent, in the year to 31 December 2025; the ABS's summary rounds the change to 65,500 (2.2 per cent). That was the fastest growth rate of the eight states and territories and the fourth largest increase1. Western Australia's population increased in every calendar year from 1982 to 2025.
How many people move to Western Australia from other states?
A net 10,419 people moved to Western Australia from the other states and territories in 2025: 37,796 people arrived and 27,377 left1. That was the second largest net interstate migration gain of any state or territory; Queensland, at 16,528, was the only other jurisdiction to gain. Western Australia recorded a net gain in each of the six calendar years from 2020 to 2025, after a net loss in each of the six years from 2014 to 2019.
How much of the Western Australian population lives in Perth?
Greater Perth had 2,452,765 of the 3,044,382 people across Greater Perth and the rest of Western Australia at 30 June 20252, which was 80.6 per cent, the highest capital city share among the six states. The capital's share was 76.3 per cent at 30 June 2001 on the same boundaries.
References
- ABS National, State and Territory Population, December 2025 · Australian Bureau of Statistics ↑ b c d e f g h i j k l m n o p q
- ABS Regional population, 2024-25 · Australian Bureau of Statistics ↑ b c d e f
- ABS Regional population, 2024-25: population estimates by SA2 and above, 2001 to 2025 (datacube 32180DS0003) · Australian Bureau of Statistics ↑ b c
- ABS, National, state and territory population methodology, December 2025 · Australian Bureau of Statistics
