

Published 31 Aug 2026
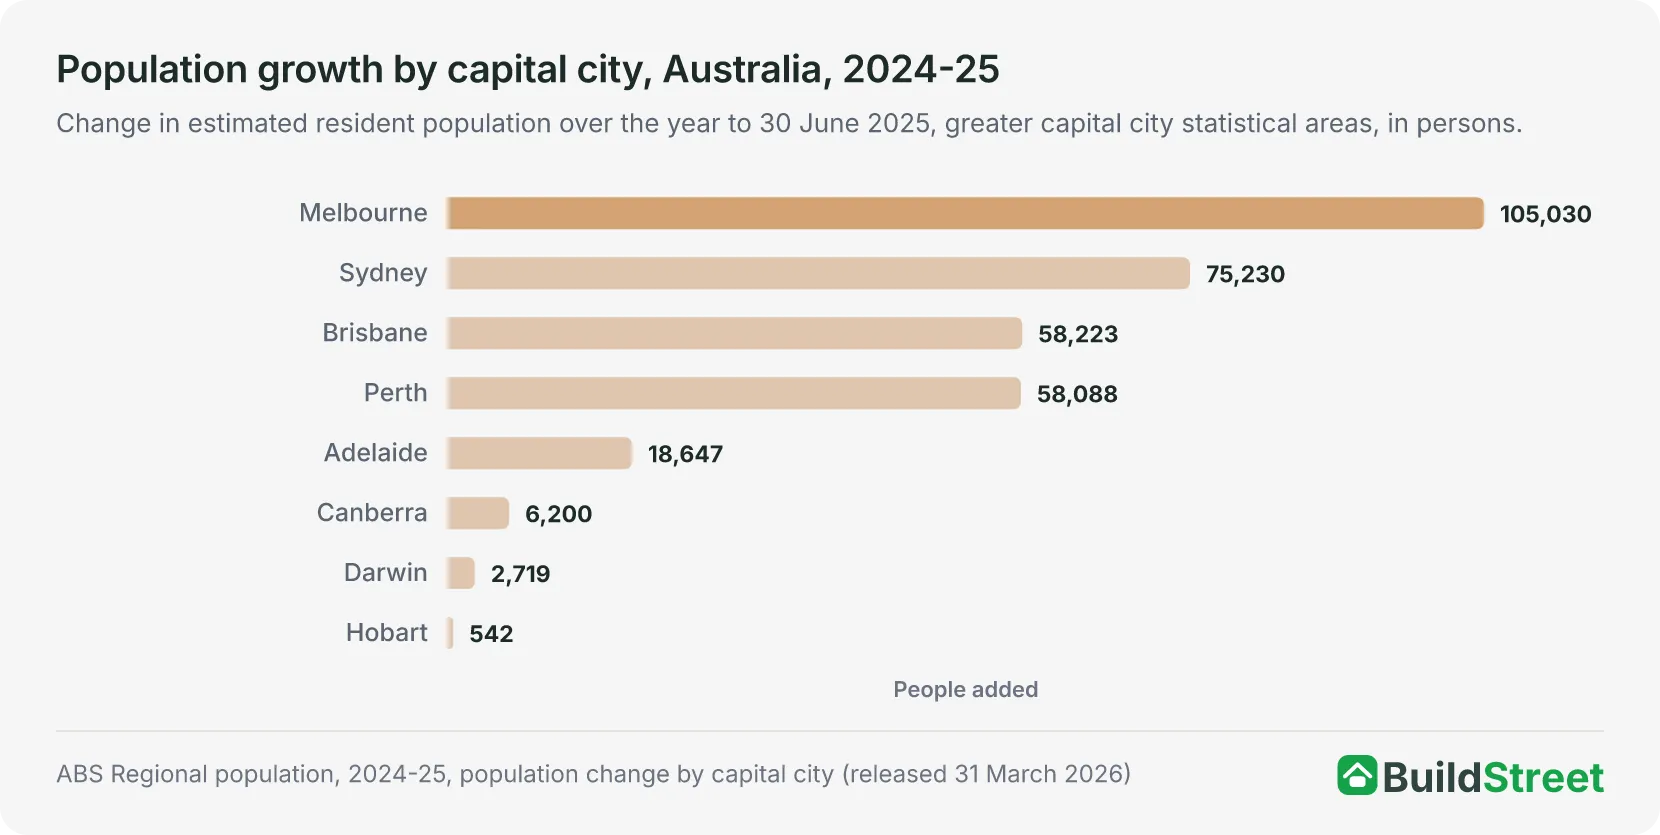 How other cities compareMelbourne added the most people of any capital in 2024-25 and Perth grew at the fastest rate, while Canberra ranked sixth on both measures. The cities article ranks growth across Australia's capitals and regional centres.
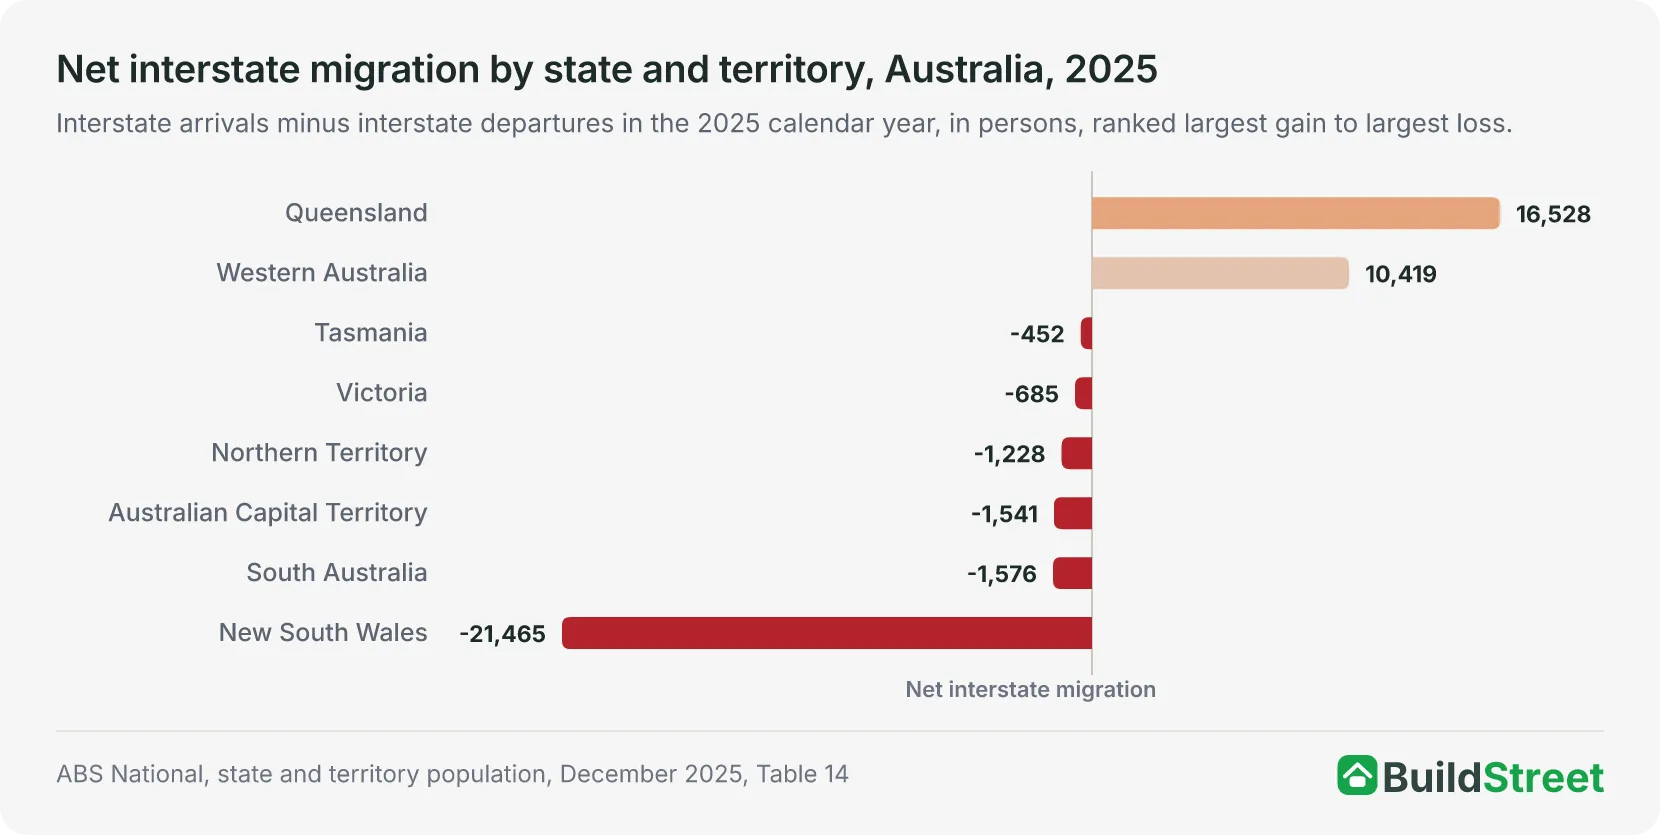 Moves between the states and territoriesNet internal migration subtracted 1,501 people from Canberra in 2024-25. The interstate migration article covers the annual state-to-state flows for all eight states and territories.
Section 01 · The headline number
How many people live in Canberra?
Canberra had an estimated resident population of 484,630 at 30 June 20251. That was the sixth- largest population among the eight capital cities. Adelaide, the fifth largest, had 1,491,015 people, and Hobart, the seventh largest, had 255,250. Canberra accounted for 1.8 per cent of the 27,613,654 people counted nationally2.
The ABS updates the city estimate once a year, at 30 June. The 2025 figures are preliminary and subject to revision2. The next release, covering 30 June 2026, is due on 25 March 20271.
Section 02 · The pace
How fast is Canberra's population growing?
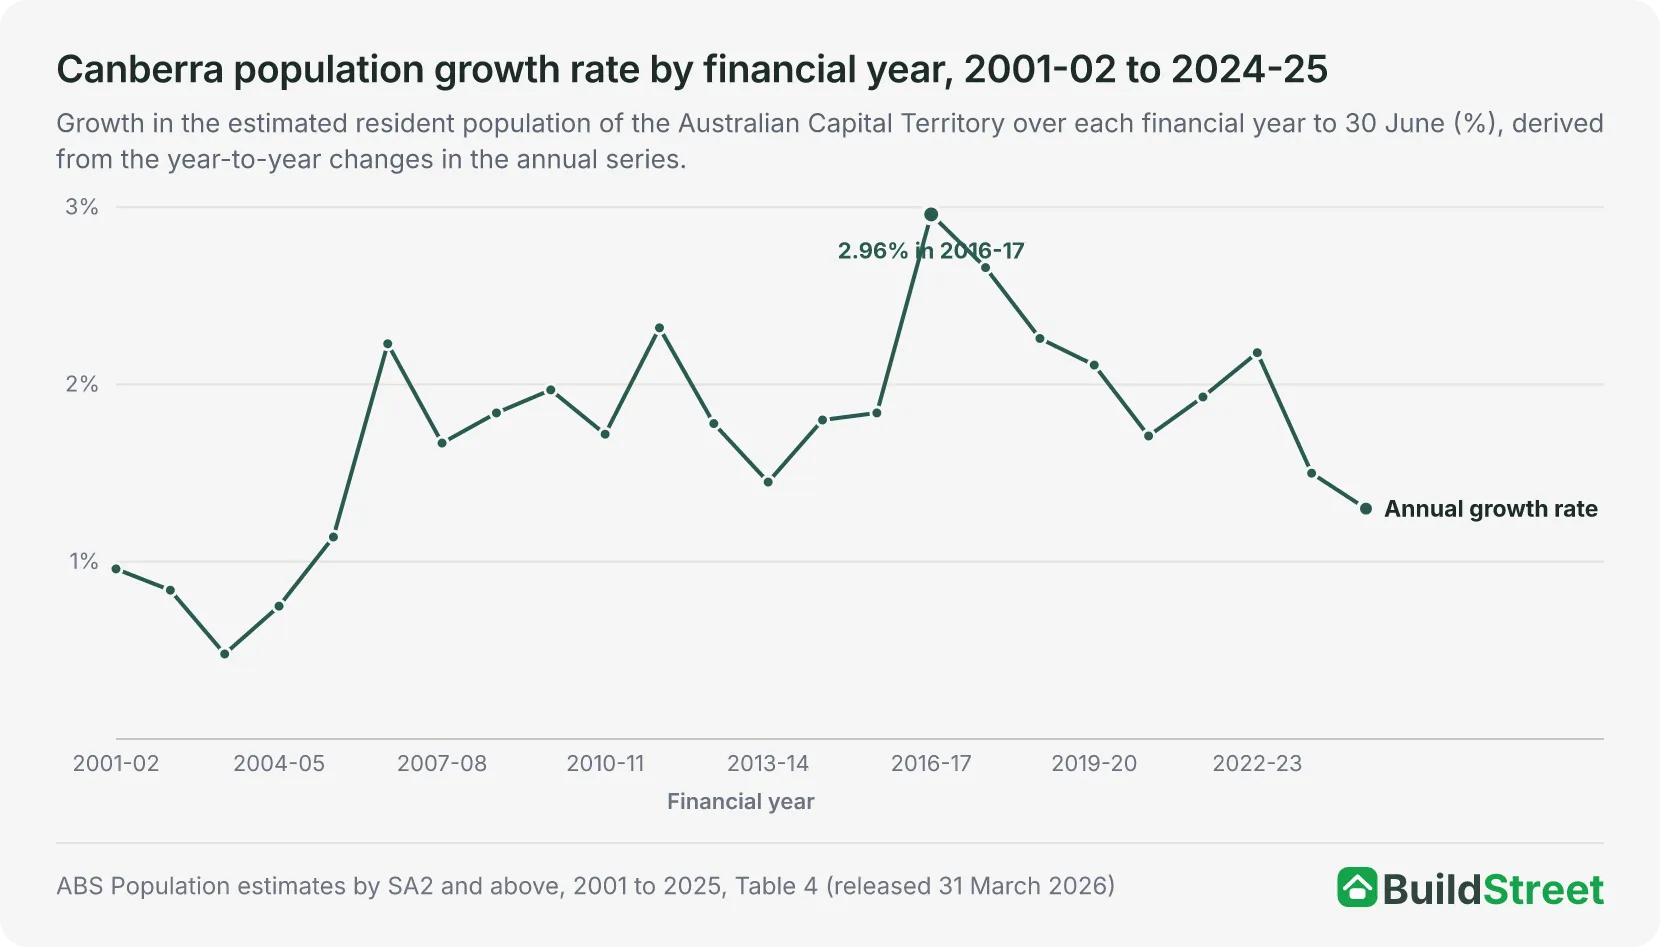
Canberra added 6,200 people, or 1.3 per cent, over the 2024-25 financial year. This was the smallest population increase since 2013-14, when the territory added 5,542 people, and the lowest growth rate since 2005-06, when the population grew by 1.14 per cent2.
From 2001-02 to 2024-25, Canberra's annual population growth ranged from 0.48 per cent to 2.96 per cent. The population increased in every year over that period. The fastest growth was in 2016-17, when the territory added 11,942 people or 2.96 per cent. The smallest increase was 1,583 people in 2003-04, when the population grew by 0.48 per cent. Growth stayed above 2 per cent for four consecutive years from 2016-17 to 2019-202.
Growth slowed from 2.18 per cent in 2022-23 to 1.50 per cent in 2023-24 and 1.30 per cent in 2024-252.
Section 03 · The drivers
What drives Canberra's population growth?
Net overseas migration was the largest contributor to Canberra's population growth in 2024-25, adding 4,819 people. Natural increase (the excess of births over deaths) added 2,882 people while net internal migration (moves to and from the rest of Australia) subtracted 1,5013. The three sum to 6,200, matching the change in the population series.
Canberra recorded a net internal migration gain of 2,159 people in 2021-22, followed by losses in each of the next three years. The losses were 974 people in 2022-23, 1,567 in 2023-24 and 1,501 in 2024-253. Brisbane and Perth were the only capitals with net internal migration gains in 2024-25, while Sydney and Melbourne recorded the largest losses1.
Net overseas migration was larger than the net internal migration loss in each of those three years. It peaked at 8,408 people in 2022-23, then fell to 5,864 in 2023-24 and 4,819 in 2024-25. All eight capitals recorded net overseas migration gains in 2024-25. Canberra's gain was the sixth largest, behind Adelaide's 17,824 and ahead of Darwin's 2,8473.
| Components of Canberra population change, 2024-25 | ||
|---|---|---|
| Component | People | Derivation |
| Net overseas migration | +4,819 | 11,007 arrivals minus 6,188 departures |
| Natural increase | +2,882 | 5,351 births minus 2,469 deaths |
| Net internal migration | -1,501 | 19,626 arrivals minus 21,127 departures |
| Total growth | +6,200 | Derived sum; equals the change published in the release's capital city table |
Source · ABS Population components by SA2 and above, 2021-22 to 2024-25, Table 4
Section 04 · The growth areas
Where in Canberra is the population growing fastest?
Canberra's fastest-growing areas in 2024-25 were in its outer north, the Molonglo Valley and Woden. The ABS identifies Taylor (up by 700 people) in Canberra's outer north, Phillip (580), south of the city centre, and Denman Prospect (560) in the Molonglo Valley as the territory's areas with the largest growth in 2024-25. Taylor grew from 4,809 to 5,512 people, Phillip from 6,556 to 7,135 and Denman Prospect from 4,939 to 5,503 over the year4.
The highest growth rates were recorded in Taylor, Strathnairn and Denman Prospect. The ABS reports rates of 15 per cent for Taylor, 14 per cent for Strathnairn and 11 per cent for Denman Prospect1.
Whitlam, in the Molonglo Valley, had the largest net internal migration gain in the territory, at 646 people, and Taylor had the largest natural increase, at 170, while the Belconnen town centre area had the largest net overseas migration gain, at 2424.
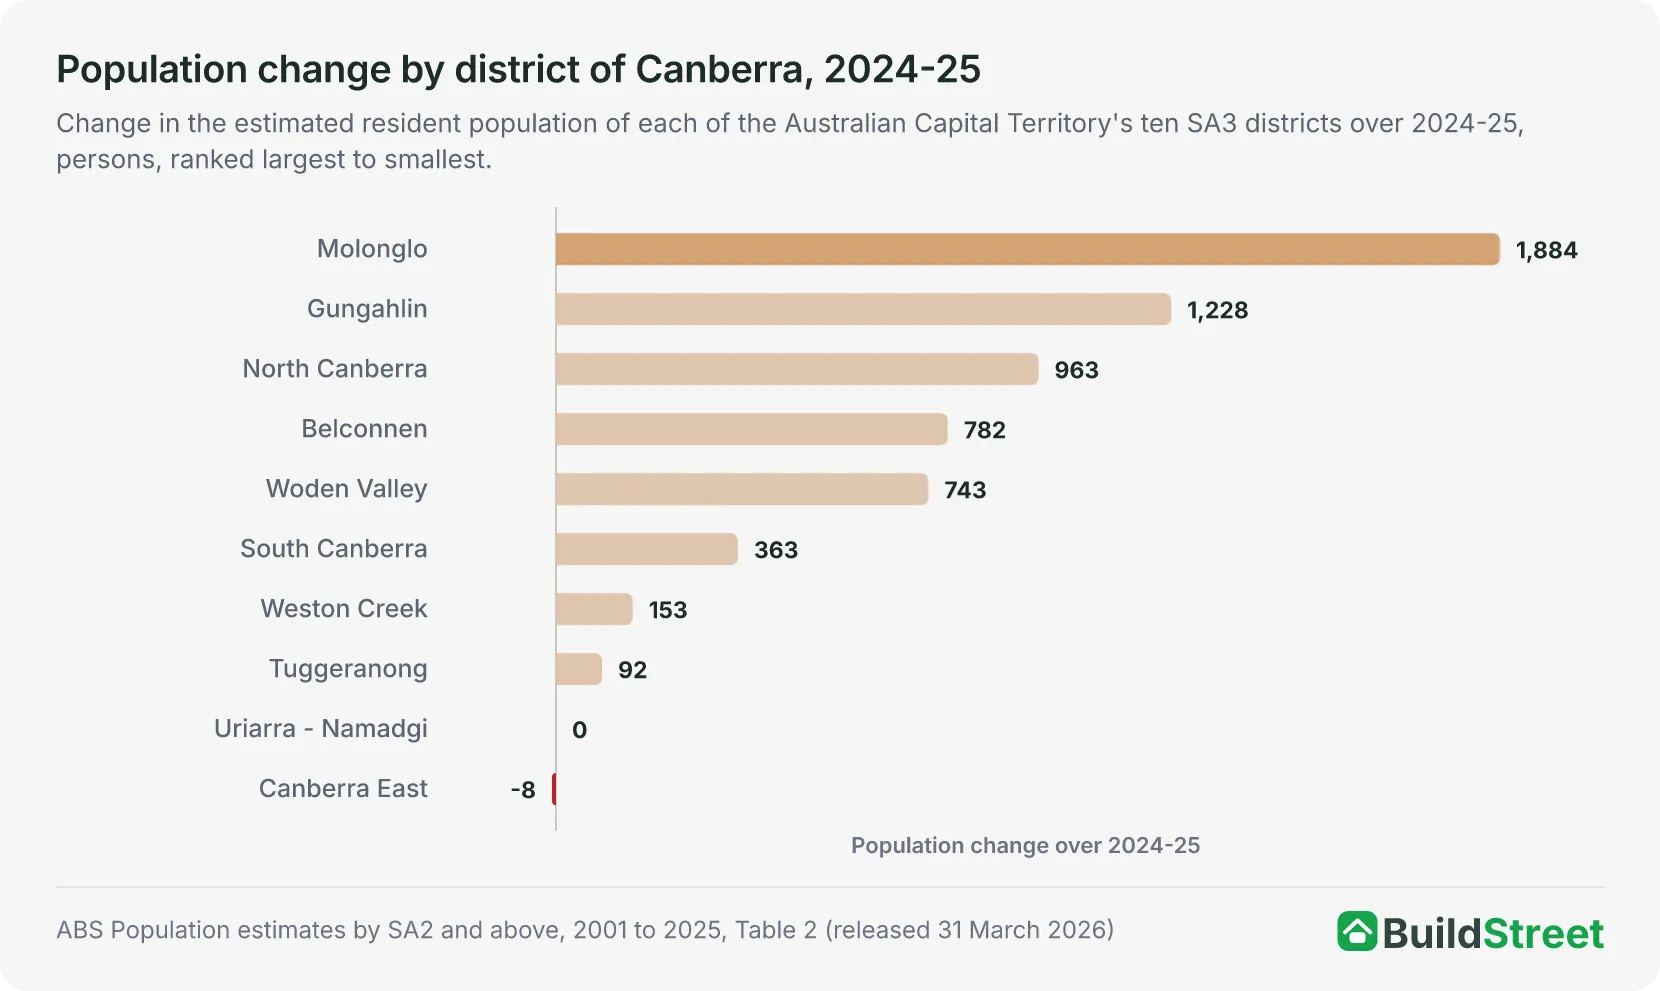
Among the territory's ten districts, Molonglo added the most people over 2024-25, at 1,884. It grew by 11.6 per cent, from 16,180 to 18,064, giving it both the largest population increase and the highest growth rate among the districts. Gungahlin added 1,228 people and North Canberra added 963. Belconnen, the most populous district at 110,132 people, added 782. Tuggeranong, with 90,199 people, added 92 people, or 0.1 per cent. Uriarra - Namadgi was unchanged, and Canberra East, down by eight people, was the only district to record a decline2.
The territory's centre of population, the midpoint of where its people live, sat over Lake Burley Griffin, south of Black Mountain, in June 2025. It barely moved over the year, with population growth relatively even across the territory1.
| The fastest growing areas of Canberra, 2024-25 | |||||
|---|---|---|---|---|---|
| Area (SA2) | District (SA3) | 30 June 2024 | 30 June 2025 | Change | Growth rate % |
| Taylor | Gungahlin | 4,809 | 5,512 | +703 | 14.6 |
| Phillip | Woden Valley | 6,556 | 7,135 | +579 | 8.8 |
| Denman Prospect | Molonglo | 4,939 | 5,503 | +564 | 11.4 |
| Strathnairn | Belconnen | 1,941 | 2,208 | +267 | 13.8 |
Source · ABS Population estimates and components by SA2, 2024 to 2025, Table 8
Section 05 · The border
Does Canberra's population include Queanbeyan?
The ABS Canberra figure does not include Queanbeyan. The capital city count covers the Australian Capital Territory only, while Queanbeyan sits across the border in New South Wales and is counted in the Queanbeyan district of the ABS Capital Region, the part of New South Wales surrounding the territory. That district had 69,504 residents at 30 June 2025, and added 1,093 people, or 1.6 per cent, in 2024-25. This was a higher growth rate than Canberra's 1.3 per cent. From 30 June 2001 to 30 June 2025, the Queanbeyan district grew 53.7 per cent compared with 50.7 per cent for the ACT2.
Googong, in the Queanbeyan district just outside the territory, grew from 8,496 to 9,323 people in 2024-25, an increase of 9.7 per cent. Net internal migration added 628 people. The ABS identifies Googong as the area with the highest population growth rate outside Australia's capital cities in 2024-254.
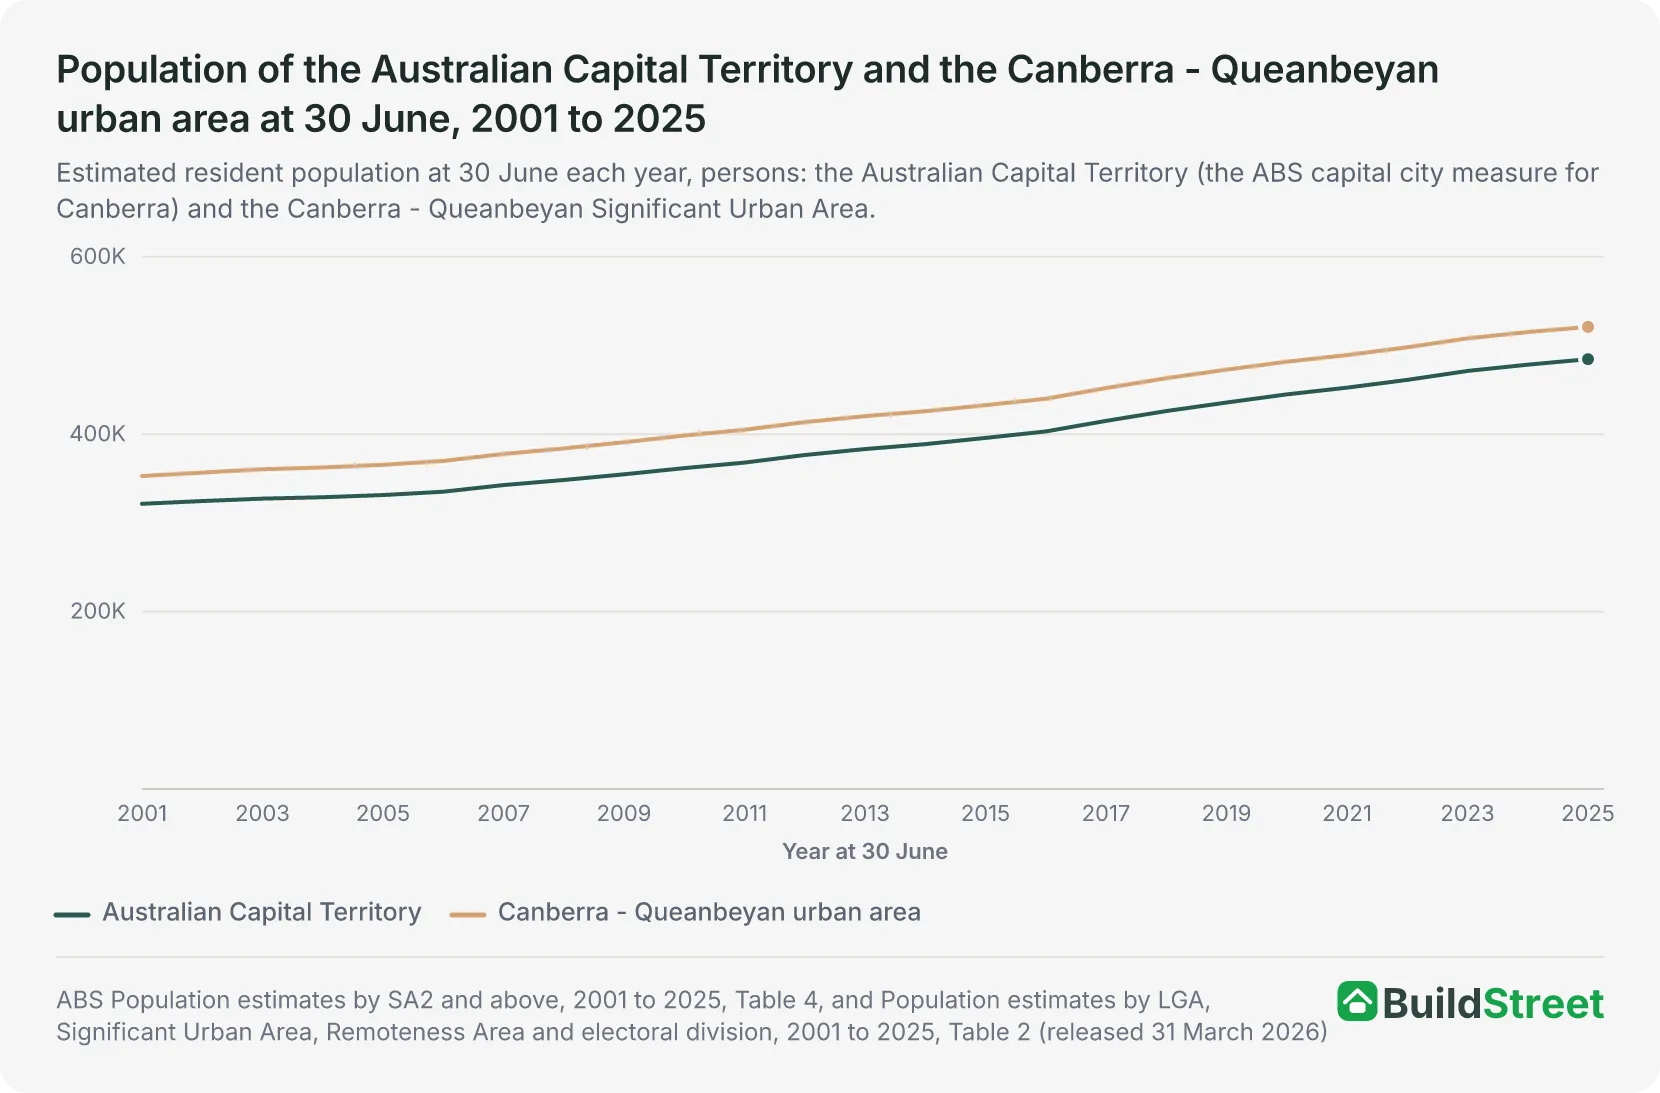
The ABS also publishes a cross-border population measure for Canberra and Queanbeyan. Significant Urban Areas represent urban centres of 10,000 people or more and may cross state and territory borders5. Using this measure, the Canberra - Queanbeyan Significant Urban Area had 521,049 residents at 30 June 2025. It added 5,894 people or 1.1 per cent in 2024-25, and had grown from 352,781 residents at 30 June 20016. That is 36,419 more people than the territory count.
Section 06 · The other capitals
How does Canberra compare with Australia's other capital cities?
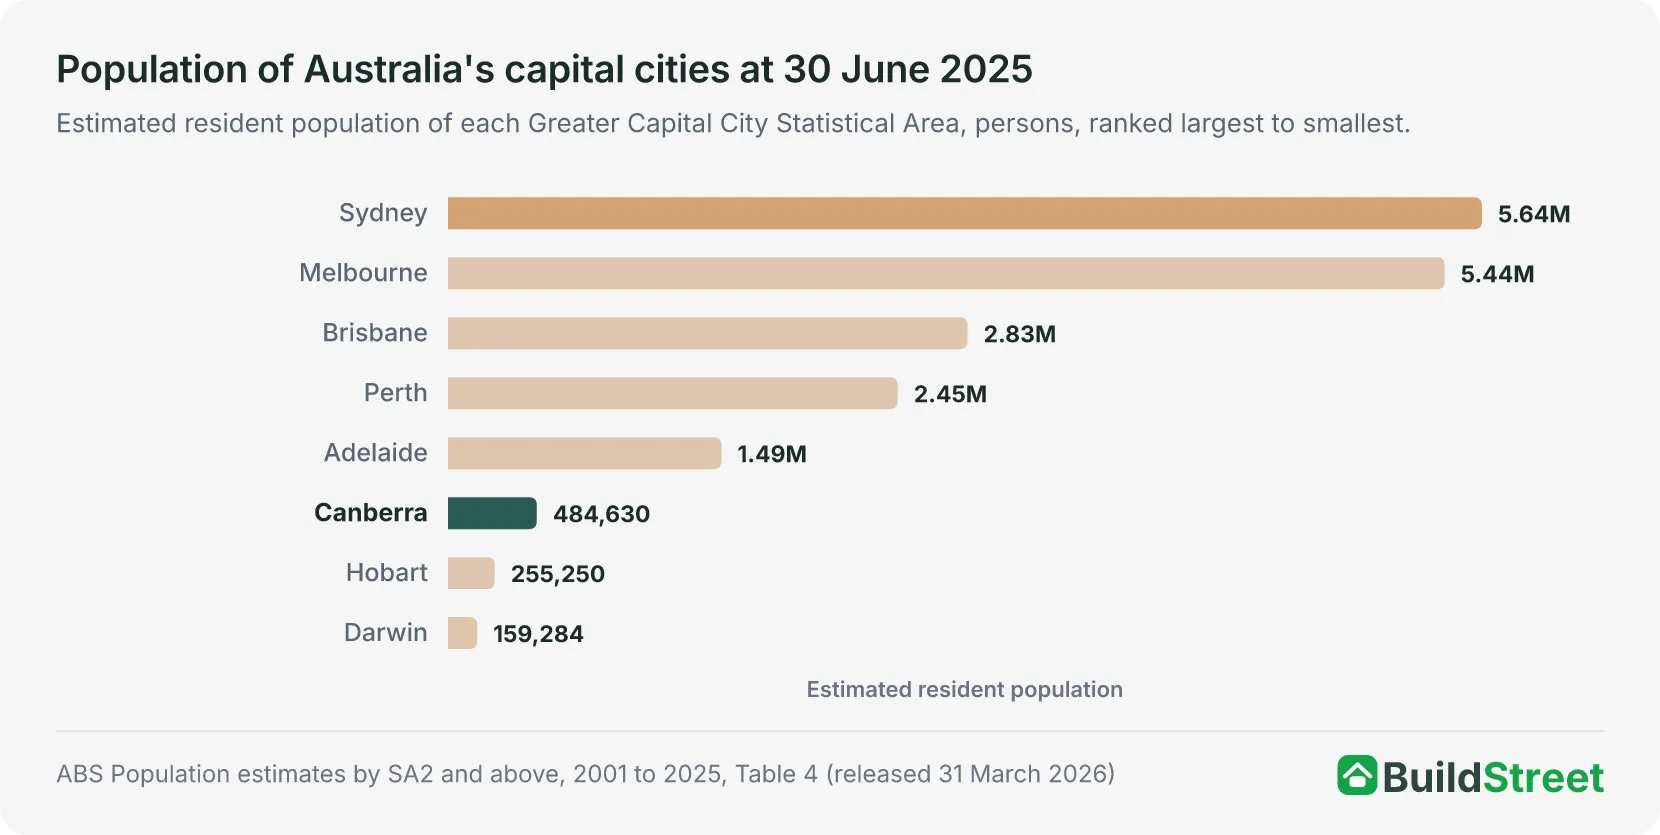
Canberra was the sixth largest of the eight capital city populations at 30 June 2025, with 484,630 people. The five larger capitals were Sydney at 5,638,830, Melbourne at 5,435,590, Brisbane at 2,833,524, Perth at 2,452,765 and Adelaide at 1,491,015. Hobart at 255,250 and Darwin at 159,284 had smaller populations2.
Canberra also ranked sixth for both population increase and growth rate in 2024-25. Its increase of 6,200 people was behind Adelaide's 18,647 and ahead of Darwin's 2,719. Its growth rate of 1.30 per cent was below Sydney's 1.35 per cent and above Adelaide's 1.27 per cent. Perth had the highest growth rate, at 2.43 per cent, followed by Brisbane at 2.10 per cent and Melbourne at 1.97 per cent, and Melbourne recorded the largest increase, at 105,030 people1.
Australia's eight capitals had a combined population of 18,750,888 people at 30 June 2025, after adding 324,679 (1.8 per cent) over the year. Canberra accounted for 2.6 per cent of the combined capital population1.
Adelaide's population data is covered in the Adelaide population article.
| Population of Australia's capital cities, as at 30 June 2025 | |||
|---|---|---|---|
| Capital city | Population | Change over 2024-25 | Growth rate % |
| Sydney | 5,638,830 | +75,230 | 1.35 |
| Melbourne | 5,435,590 | +105,030 | 1.97 |
| Brisbane | 2,833,524 | +58,223 | 2.10 |
| Perth | 2,452,765 | +58,088 | 2.43 |
| Adelaide | 1,491,015 | +18,647 | 1.27 |
| Canberra | 484,630 | +6,200 | 1.30 |
| Hobart | 255,250 | +542 | 0.21 |
| Darwin | 159,284 | +2,719 | 1.74 |
| All capital cities | 18,750,888 | +324,679 | 1.76 |
Source · ABS Population estimates by SA2 and above, 2001 to 2025, Table 4
Section 07 · The long run
How has Canberra's population changed since 2001?
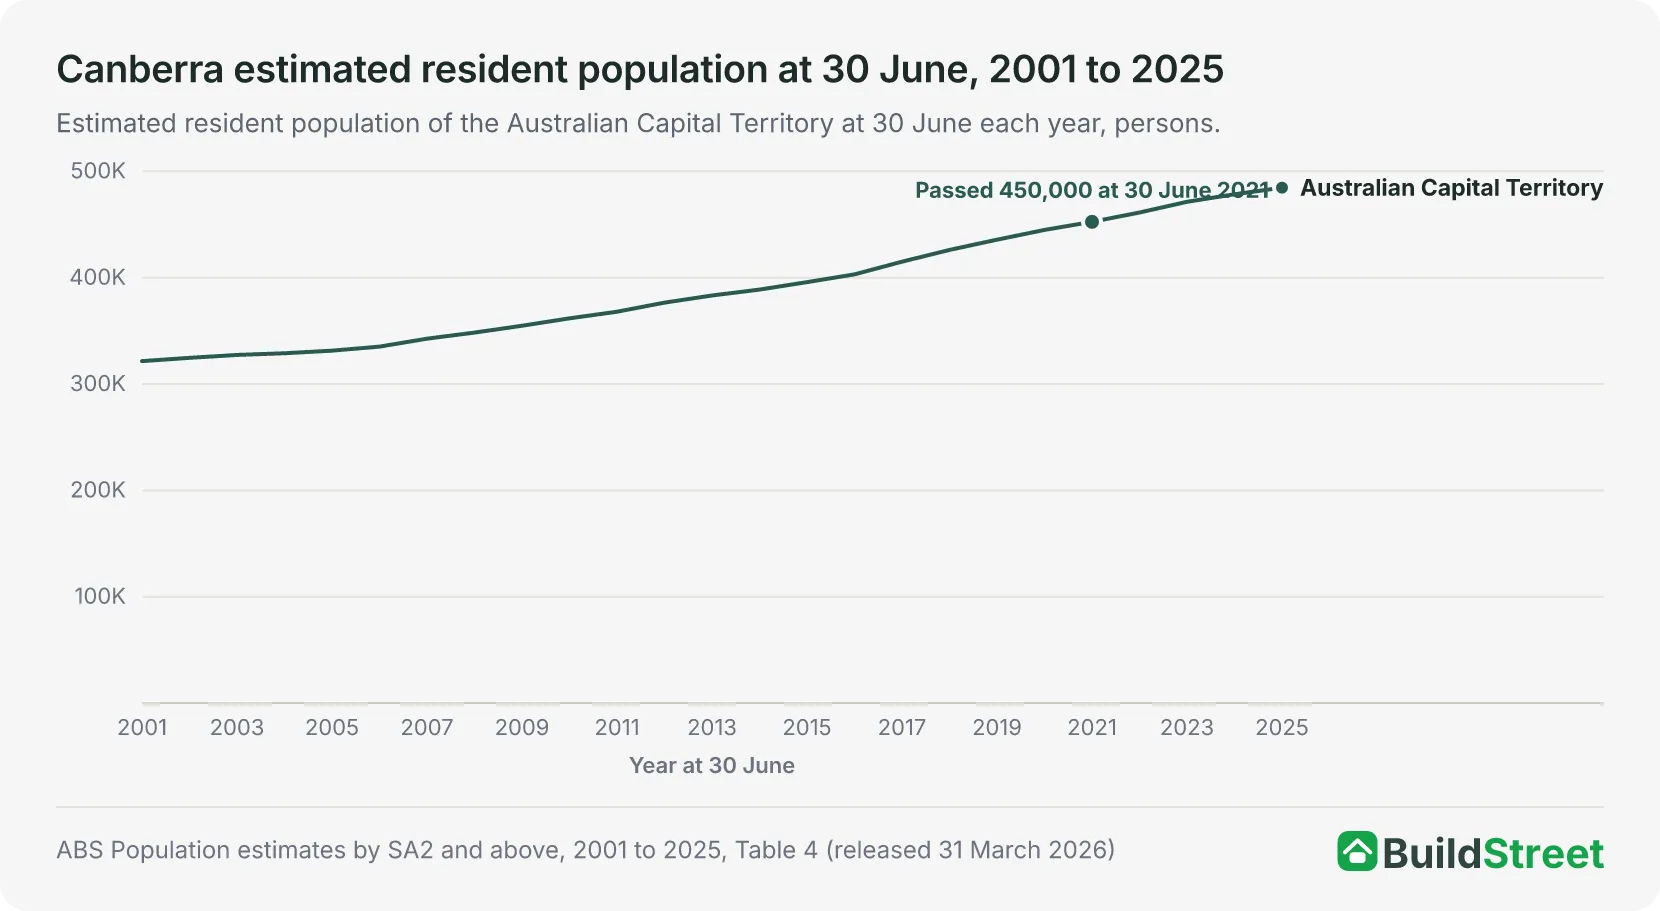
Canberra's population grew by 163,092 people between 30 June 2001 and 30 June 2025, rising from 321,538 to 484,630. By 2025, the population was 1.51 times its 2001 level2.
Canberra first exceeded 350,000 people at 30 June 2009, 400,000 at 30 June 2016 and 450,000 at 30 June 20212. The second milestone came seven years after the first, and the third came five years after the second.
Annual population growth has varied in recent years. The increase fell from 9,173 in 2019-20 to 7,605 in 2020-21, then rose to 8,754 in 2021-22 and 10,078 in 2022-23. It then fell to 7,090 in 2023-24 and 6,200 in 2024-252.
| Canberra population milestones in the annual series | ||
|---|---|---|
| Milestone | First 30 June at or above | Population that year |
| 350,000 | 30 June 2009 | 354,785 |
| 400,000 | 30 June 2016 | 403,104 |
| 450,000 | 30 June 2021 | 452,508 |
Source · ABS Population estimates by SA2 and above, 2001 to 2025, Table 4
Section 08
Canberra population: quick answers
How many people live in Canberra?
Canberra had an estimated resident population of 484,630 at 30 June 2025. The figure covers the whole Australian Capital Territory, which is how the ABS defines the capital city. Canberra had the sixth largest population of Australia's eight capital cities and accounted for 1.8 per cent of the national total of 27,613,654 in the same series. The 30 June 2025 estimates are preliminary. The next release, covering 30 June 2026, is due on 25 March 2027.
Is Canberra's population the same as the ACT's population?
Yes. The ABS measures capital cities on Greater Capital City Statistical Area boundaries, and the Australian Capital Territory does not have a rest of state region (the part of a state outside its capital), so the Canberra capital city population and the territory's population are the same. Both were 484,630 people at 30 June 2025.
How fast is Canberra's population growing?
Canberra added 6,200 people, or 1.3 per cent, over the 2024-25 financial year, the territory's lowest growth rate since 2005-06. The rate was the sixth fastest of the eight capital cities. Growth peaked at 11,942 people (2.96 per cent) in 2016-17, and the population increased in every year from 2001-02 to 2024-25.
Does Canberra's population include Queanbeyan?
No. The ABS capital city figure covers the Australian Capital Territory only, while Queanbeyan is counted in regional New South Wales. The Queanbeyan district had 69,504 residents at 30 June 2025. The cross-border Canberra - Queanbeyan Significant Urban Area, which covers urban areas on both sides of the border, had 521,049 residents on the same date.
Section 09
Australia population statistics
References
- ABS Regional population, 2024-25 · Australian Bureau of Statistics ↑ b c d e f g
- ABS Regional population, 2024-25: population estimates by SA2 and above, 2001 to 2025 (datacube 32180DS0003) · Australian Bureau of Statistics ↑ b c d e f g h i j k
- ABS Regional population, 2024-25: population components by SA2 and above, 2021-22 to 2024-25 (datacube 32180DS0005) · Australian Bureau of Statistics ↑ b c
- ABS Regional population, 2024-25: population estimates and components by SA2, 2024 to 2025 (datacube 32180DS0001) · Australian Bureau of Statistics ↑ b c
- ABS Regional population methodology, 2024-25 · Australian Bureau of Statistics ↑
- ABS Regional population, 2024-25: population estimates by LGA and Significant Urban Area, 2001 to 2025 (datacube 32180DS0004) · Australian Bureau of Statistics ↑ b
