

Published 2 Sept 2026 · Updated 16 Sept 2026
The Sunshine Coast urban area had 424,741 residents at 30 June 2025, making it the third largest urban area in Queensland and the ninth largest in Australia, according to the Australian Bureau of Statistics (ABS) Regional population data. The urban area added 8,018 people over the 2024-25 financial year, a growth rate of 1.92 per cent, the fourth highest rate among the country's ten largest urban areas. It accounted for 7.5 per cent of Queensland's 5,669,764 people. Among the urban areas without a capital city, only Gold Coast - Tweed Heads and Newcastle - Maitland were larger.
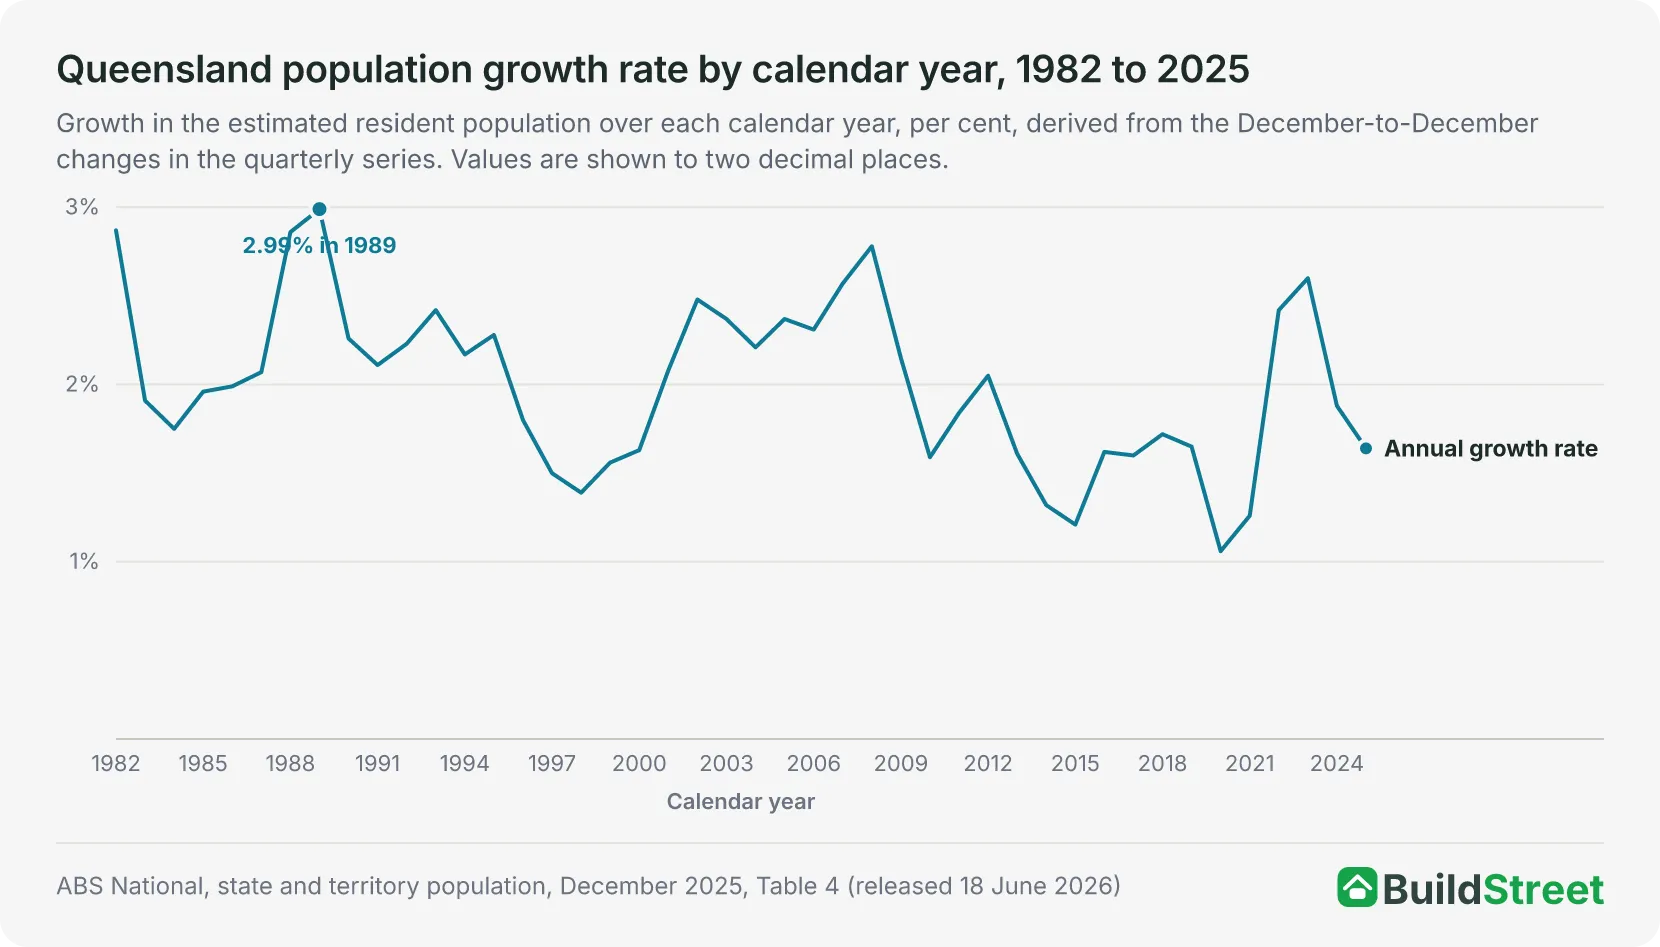 The state pictureQueensland had an estimated resident population of 5,669,764 at 30 June 2025 in the ABS annual series. The state article covers the total, its drivers and the split between Greater Brisbane and the rest of the state.
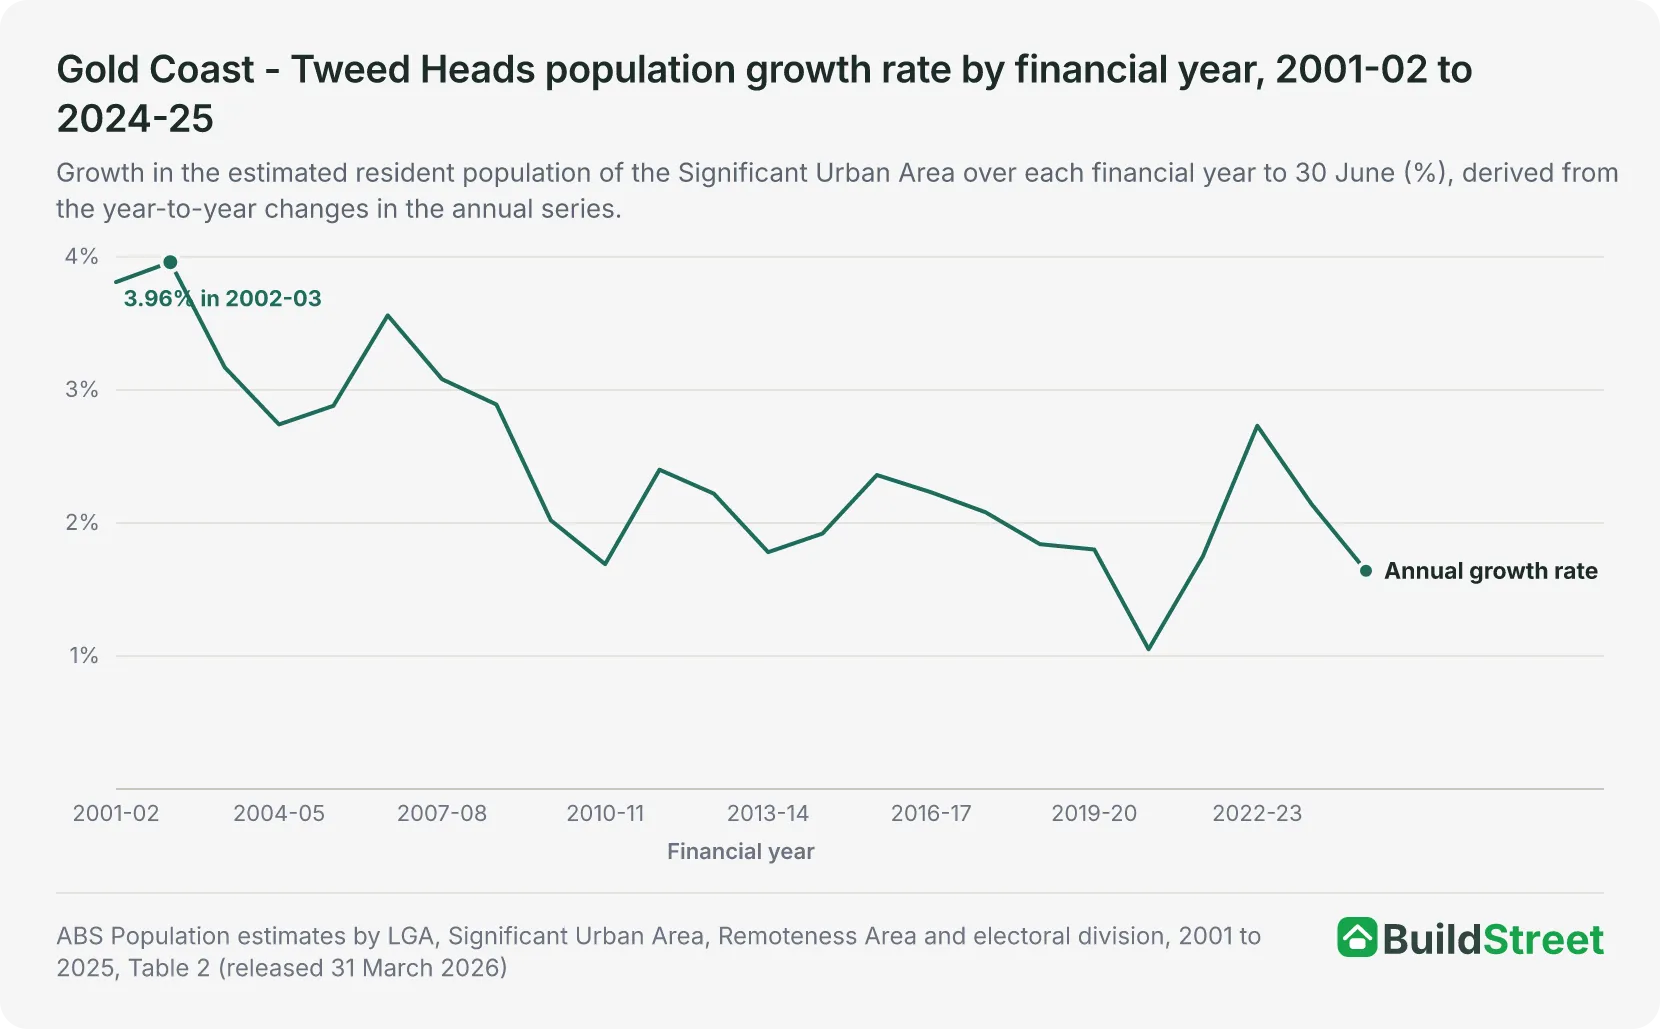 The Gold Coast comparisonGold Coast - Tweed Heads was Australia's sixth largest urban area at 30 June 2025, with 761,634 people, the largest without a capital city. The Gold Coast article covers its growth, drivers and cross-border boundary.
Section 01 · The headline number
How many people live on the Sunshine Coast?
The Sunshine Coast Significant Urban Area had an estimated resident population of 424,741 at 30 June 2025. That was the third largest population of the 19 urban areas in Queensland, behind Brisbane, whose urban area had 2,745,086 people on the same boundaries, and Gold Coast - Tweed Heads at 761,6341. The Sunshine Coast accounted for 7.5 per cent of Queensland's estimated 5,669,764 people at the same date, and 1.5 per cent of Australia's 27,613,654 people.
The estimates have a reference date of 30 June each year and are published once a year. The next release, covering 30 June 2026, is due on 25 March 20271.
Section 02 · The pace
How fast is the Sunshine Coast's population growing?
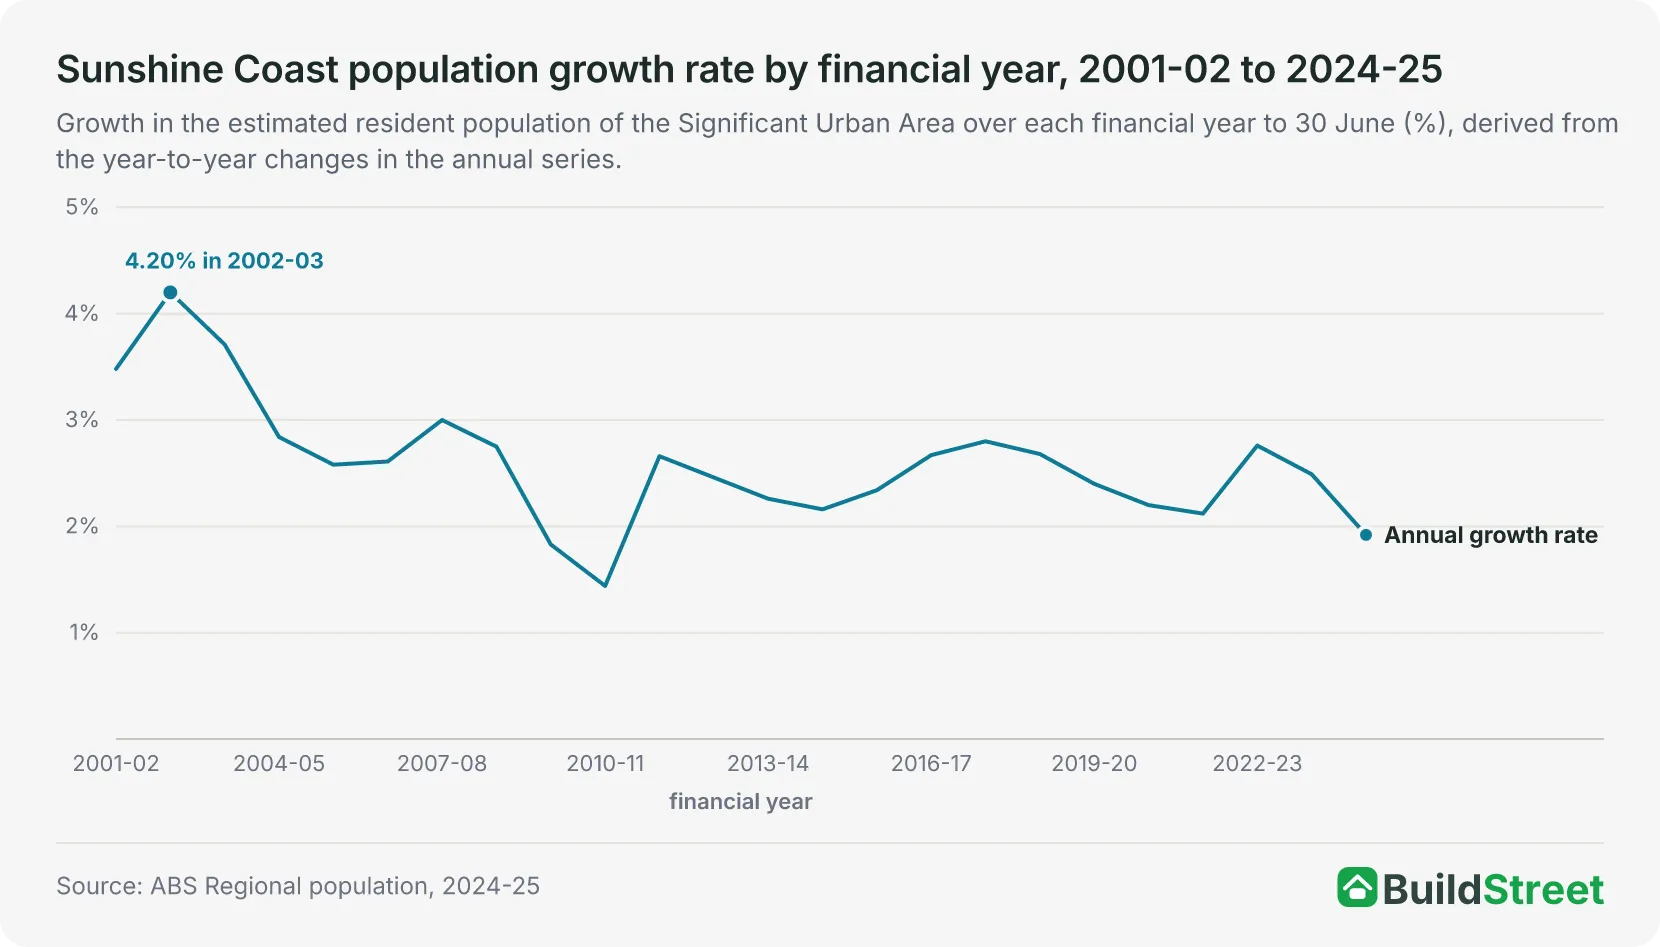
The Sunshine Coast urban area added 8,018 people, or 1.92 per cent, over the 2024-25 financial year. The increase was the smallest since 2015-16, when the urban area added 7,802 people. The increases in the three preceding years were larger, at 8,220 in 2021-22, 10,922 in 2022-23 and 10,109 in 2023-241.
Growth over the 24 financial years from 2001-02 to 2024-25 ranged from 1.44 per cent to 4.20 per cent, and the population increased in every year. The fastest year was 2002-03, when the urban area grew 4.20 per cent, adding 9,979 people. The largest increase in people was in 2022-23, when the urban area added 10,922 people, or 2.76 per cent. The slowest year was 2010-11, at 4,306 people, or 1.44 per cent1.
Growth slowed in each of the two years after the 2022-23 peak, from 2.76 per cent in 2022-23 to 2.49 per cent in 2023-24 and 1.92 per cent in 2024-25. The 2024-25 rate was the lowest since 2010-11. Only two years were slower: 2009-10, at 1.83 per cent, and 2010-11, at 1.44 per cent. Across the rest of Queensland, the ABS region outside Greater Brisbane grew 1.42 per cent over 2024-25, and Greater Brisbane grew 2.10 per cent. The rest-of-state population increase was rounded to 39,700 people, or 1.4 per cent1.
Section 03 · The drivers
What drives the Sunshine Coast's population growth?
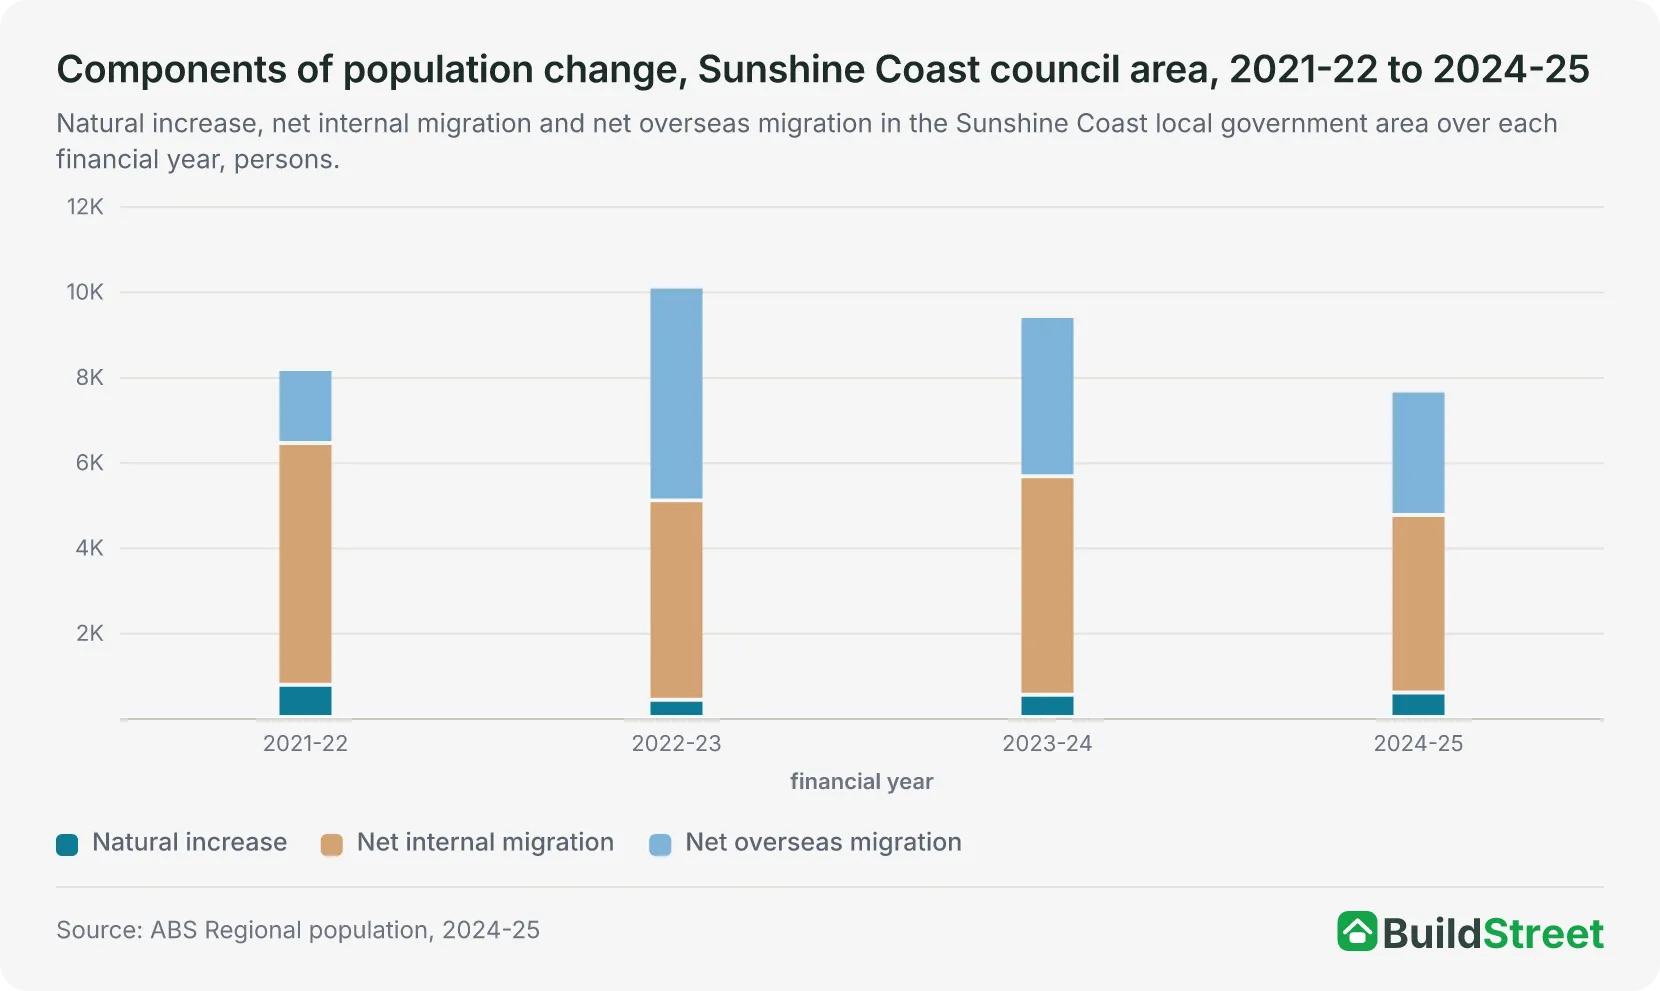
In 2024-25, net internal migration added 4,159 people to the Sunshine Coast council area, the largest of the three components of the council area's change. Net overseas migration added 2,920 people. Natural increase (the excess of births over deaths) added 5801. The three sum to the council area's increase of 7,659 people, a growth rate of 2.05 per cent.3 The ABS publishes components of change for council areas rather than for urban areas, so the driver figures are for the council boundaries.
The Sunshine Coast council area's net internal migration gain was the fifth largest of the 546 council areas in 2024-25, behind Melton in Victoria at 7,441 and three council areas in Greater Brisbane: Moreton Bay at 5,195, Logan at 5,105 and Ipswich at 4,8931.
In Noosa Shire, deaths exceeded births in 2024-25, so natural increase subtracted 167 people, with 368 births against 535 deaths. Net overseas migration, at 567 people, was the largest component of Noosa's growth, and net internal migration added 136. The three sum to the council area's increase of 536 people, a growth rate of 0.91 per cent1. Together, the two council areas added 8,195 people over 2024-25. That is a council-boundary figure and is not comparable with the urban area's increase of 8,018, which covers a different boundary.
Net internal migration was the largest component of the Sunshine Coast council area's growth in three of the four financial years from 2021-22 to 2024-25. The exception was 2022-23, when net overseas migration added 5,014 people against 4,674 from internal migration. The internal migration gain was 5,666 in 2021-22, 4,674 in 2022-23, 5,123 in 2023-24 and 4,159 in 2024-25, the lowest of the four years. In Noosa, deaths exceeded births in each of the four years, and net overseas migration was the largest component in each1.
| Components of population change by council area, Sunshine Coast region, 2024-25 | |||||
|---|---|---|---|---|---|
| Council area (LGA) | Natural increase | Net internal migration | Net overseas migration | Total change | Growth rate % |
| Sunshine Coast | +580 | +4,159 | +2,920 | +7,659 | 2.05 |
| Noosa | -167 | +136 | +567 | +536 | 0.91 |
| Both council areas | +413 | +4,295 | +3,487 | +8,195 | 1.89 |
Source · ABS Population estimates and components by LGA, 2024 to 2025, Table 3
Section 04 · The growth areas
Where on the Sunshine Coast is the population growing fastest?
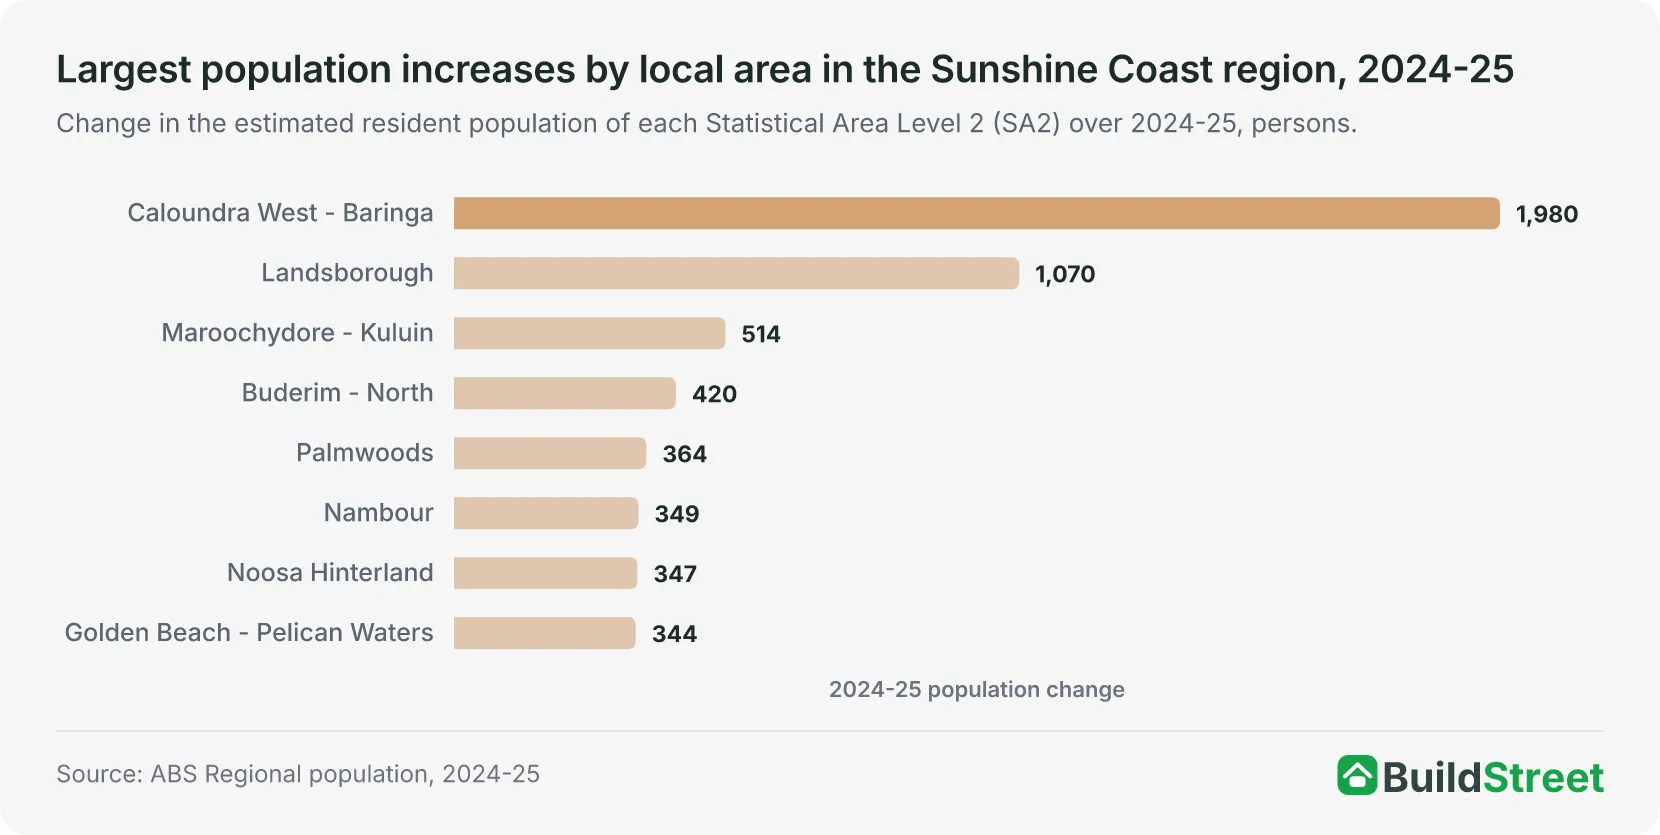
Caloundra West - Baringa, at the southern end of the urban area, recorded both the largest increase and the highest growth rate of the 34 local areas in the Sunshine Coast region in 2024-25. Its population grew from 21,892 to 23,872, an increase of 1,980 people, or 9.0 per cent. Its increase was also the largest of the 960 local areas the ABS lists outside the capital cities, and is rounded to 2,000 people1. Net internal migration accounted for 1,586 of the 1,980, with natural increase adding 302 and net overseas migration adding 92.5
Landsborough, in the hinterland behind Caloundra, had the second largest increase in the region. It grew from 20,558 to 21,628, an increase of 1,070 people, or 5.2 per cent. No other local area in the region added more than 514 people. Maroochydore - Kuluin added 514 people, Buderim - North added 420 and Palmwoods added 364, growth of between 2.0 and 2.8 per cent. None of the 34 local areas recorded a decline. The smallest change was in Tewantin, at 13 people, or 0.1 per cent1.
Among the region's seven statistical areas, Caloundra grew fastest in 2024-25, adding 3,139 people, or 2.95 per cent, across its nine local areas. The Sunshine Coast Hinterland was next, adding 1,846 people, or 2.74 per cent. The Noosa area, covering the coastal part of Noosa Shire, grew slowest, adding 390 people, or 0.80 per cent1.
Noosa's population is covered in the Noosa population article.
| Population change by statistical area (SA3), Sunshine Coast region, 2024-25 | |||||
|---|---|---|---|---|---|
| Statistical area (SA3) | Local areas (SA2s) | 30 June 2024 | 30 June 2025 | Change | Growth rate % |
| Caloundra | 9 | 106,232 | 109,371 | +3,139 | 2.95 |
| Sunshine Coast Hinterland | 6 | 67,333 | 69,179 | +1,846 | 2.74 |
| Maroochy | 4 | 67,783 | 68,634 | +851 | 1.26 |
| Buderim | 4 | 62,754 | 63,569 | +815 | 1.30 |
| Nambour | 4 | 54,262 | 55,069 | +807 | 1.49 |
| Noosa | 6 | 49,045 | 49,435 | +390 | 0.80 |
| Noosa Hinterland | 1 | 25,904 | 26,251 | +347 | 1.34 |
Source · ABS Population estimates and components by SA2, 2024 to 2025, Table 3
Section 05 · The state picture
How does the Sunshine Coast compare with other cities in Queensland?
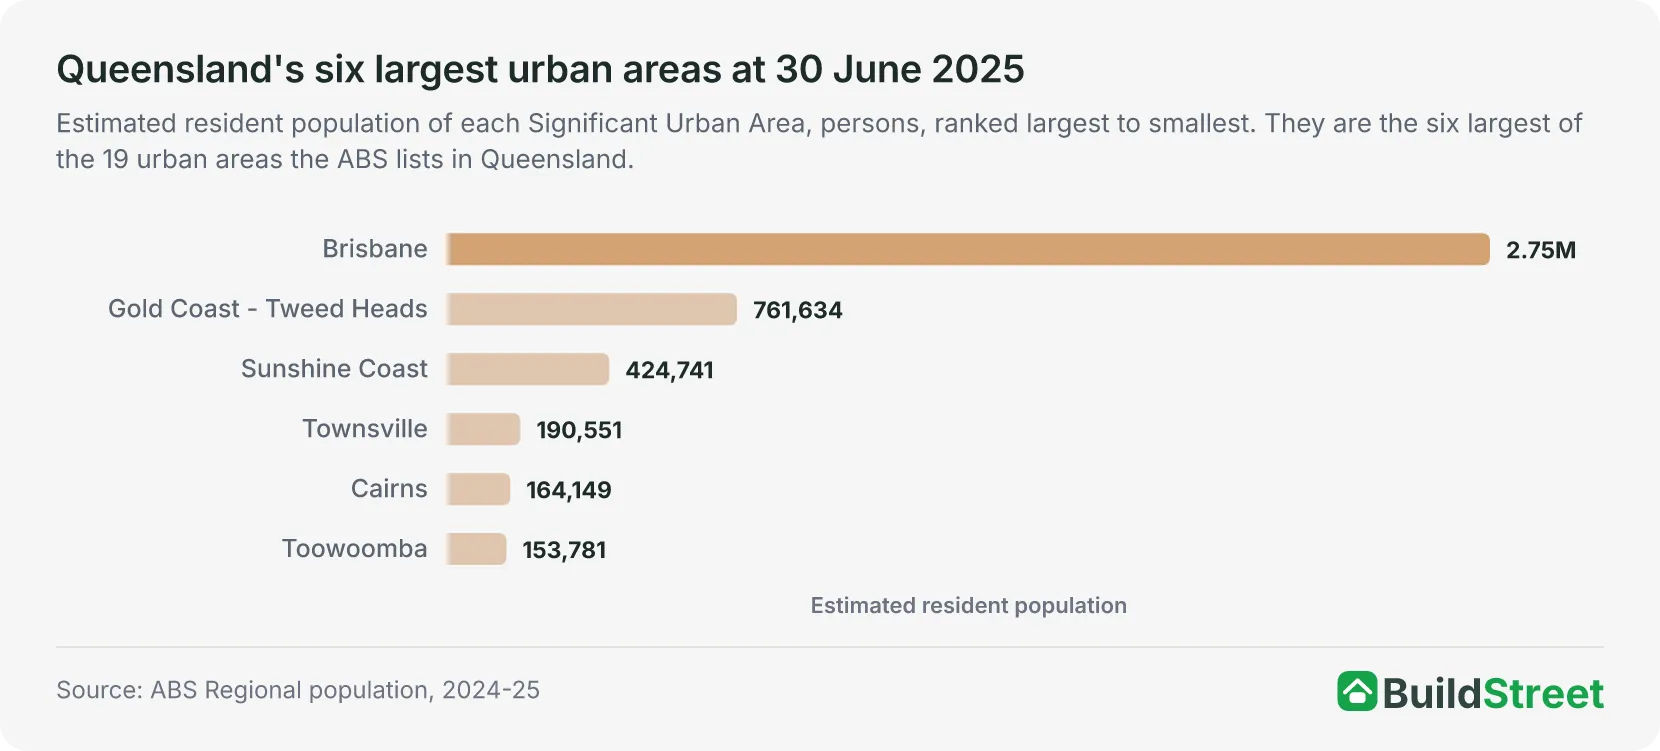
The Sunshine Coast has been the third largest of Queensland's 19 urban areas in every year from 2001 to 2025, behind Brisbane and Gold Coast - Tweed Heads. The next largest at 30 June 2025, Townsville, had 190,551 people, less than half the Sunshine Coast's 424,741, followed by Cairns at 164,149 and Toowoomba at 153,7811.
The Sunshine Coast grew faster than Gold Coast - Tweed Heads in 2024-25, at 1.92 per cent against 1.64 per cent, and its rate has exceeded the Gold Coast's in each of the nine financial years from 2016-17 to 2024-25. Among the state's six urban areas with 100,000 or more people, only Brisbane, at 2.08 per cent, grew faster than the Sunshine Coast over the year. Four smaller urban areas in the state also grew faster than the Sunshine Coast, and Gympie had the highest rate of the 19, at 2.56 per cent. The Gold Coast added more people over the year, at 12,279 against 8,0181.
Section 06 · The national rank
Where does the Sunshine Coast rank among Australia's largest cities?
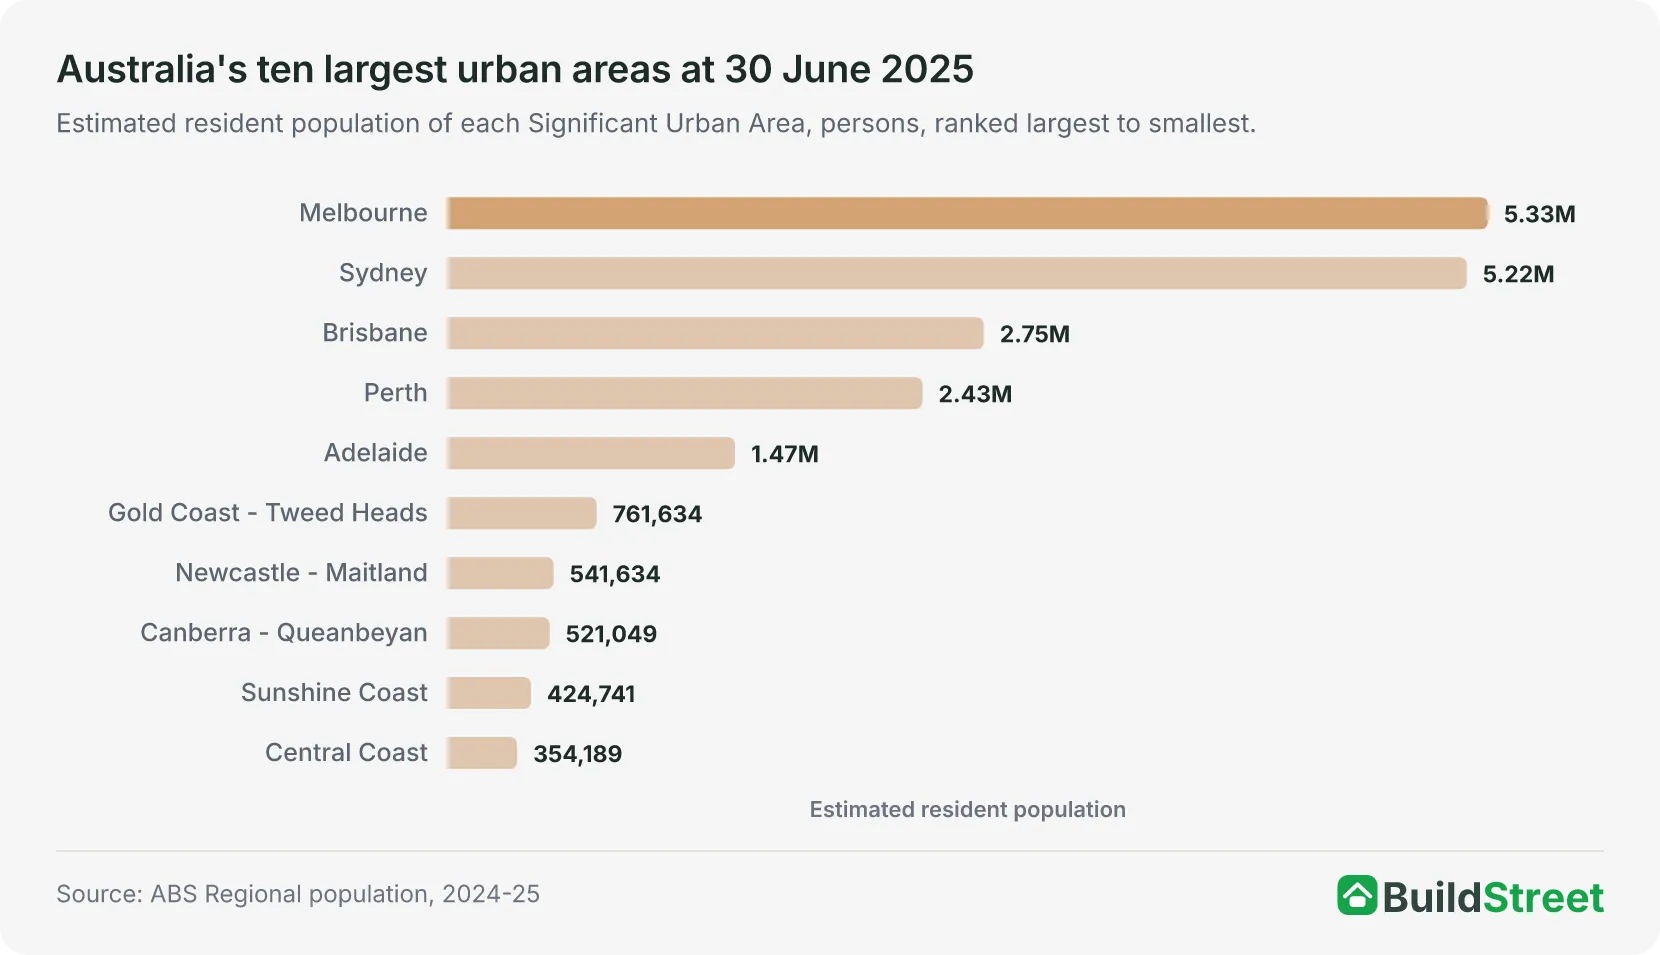
The Sunshine Coast was the ninth largest of Australia's 102 Significant Urban Areas at 30 June 2025. The eight larger areas ranged from Melbourne, at 5,328,274 people, to Canberra - Queanbeyan, at 521,049, and the Central Coast, at 354,189, was tenth. The capital city figures use different boundaries from the Significant Urban Areas. Greater Brisbane, for example, had 2,833,524 people at the same date1.
Among the urban areas that do not contain a capital city, the Sunshine Coast was the third largest, behind Gold Coast - Tweed Heads at 761,634 and Newcastle - Maitland at 541,634, and ahead of the Central Coast at 354,189. The Sunshine Coast's rank among all urban areas has risen over time. It was eleventh from 2001 to 2005, tenth from 30 June 2006, when it exceeded Wollongong, and ninth from 30 June 2015, when it exceeded the Central Coast1.
Growth in 2024-25 varied across the ten largest urban areas, from 0.68 per cent on the Central Coast to 2.40 per cent in Perth. The Sunshine Coast's 1.92 per cent ranked fourth of the ten, behind Perth, Brisbane at 2.08 per cent and Melbourne at 1.97 per cent, and ahead of Gold Coast - Tweed Heads at 1.64 per cent. Its increase of 8,018 people was the seventh largest of all 102 urban areas1. Newcastle's population data is covered in the Newcastle population article.
| Australia's ten largest urban areas, as at 30 June 2025 | |||
|---|---|---|---|
| Urban area (SUA) | Population | Change over 2024-25 | Growth rate % |
| Melbourne | 5,328,274 | +102,910 | 1.97 |
| Sydney | 5,219,674 | +70,670 | 1.37 |
| Brisbane | 2,745,086 | +56,017 | 2.08 |
| Perth | 2,430,757 | +56,991 | 2.40 |
| Adelaide | 1,470,938 | +18,417 | 1.27 |
| Gold Coast - Tweed Heads | 761,634 | +12,279 | 1.64 |
| Newcastle - Maitland | 541,634 | +6,953 | 1.30 |
| Canberra - Queanbeyan | 521,049 | +5,894 | 1.14 |
| Sunshine Coast | 424,741 | +8,018 | 1.92 |
| Central Coast | 354,189 | +2,401 | 0.68 |
Source · ABS Population estimates by LGA, Significant Urban Area, Remoteness Area and electoral division, 2001 to 2025, Table 2
Section 07 · The long run
How has the Sunshine Coast's population changed since 2001?
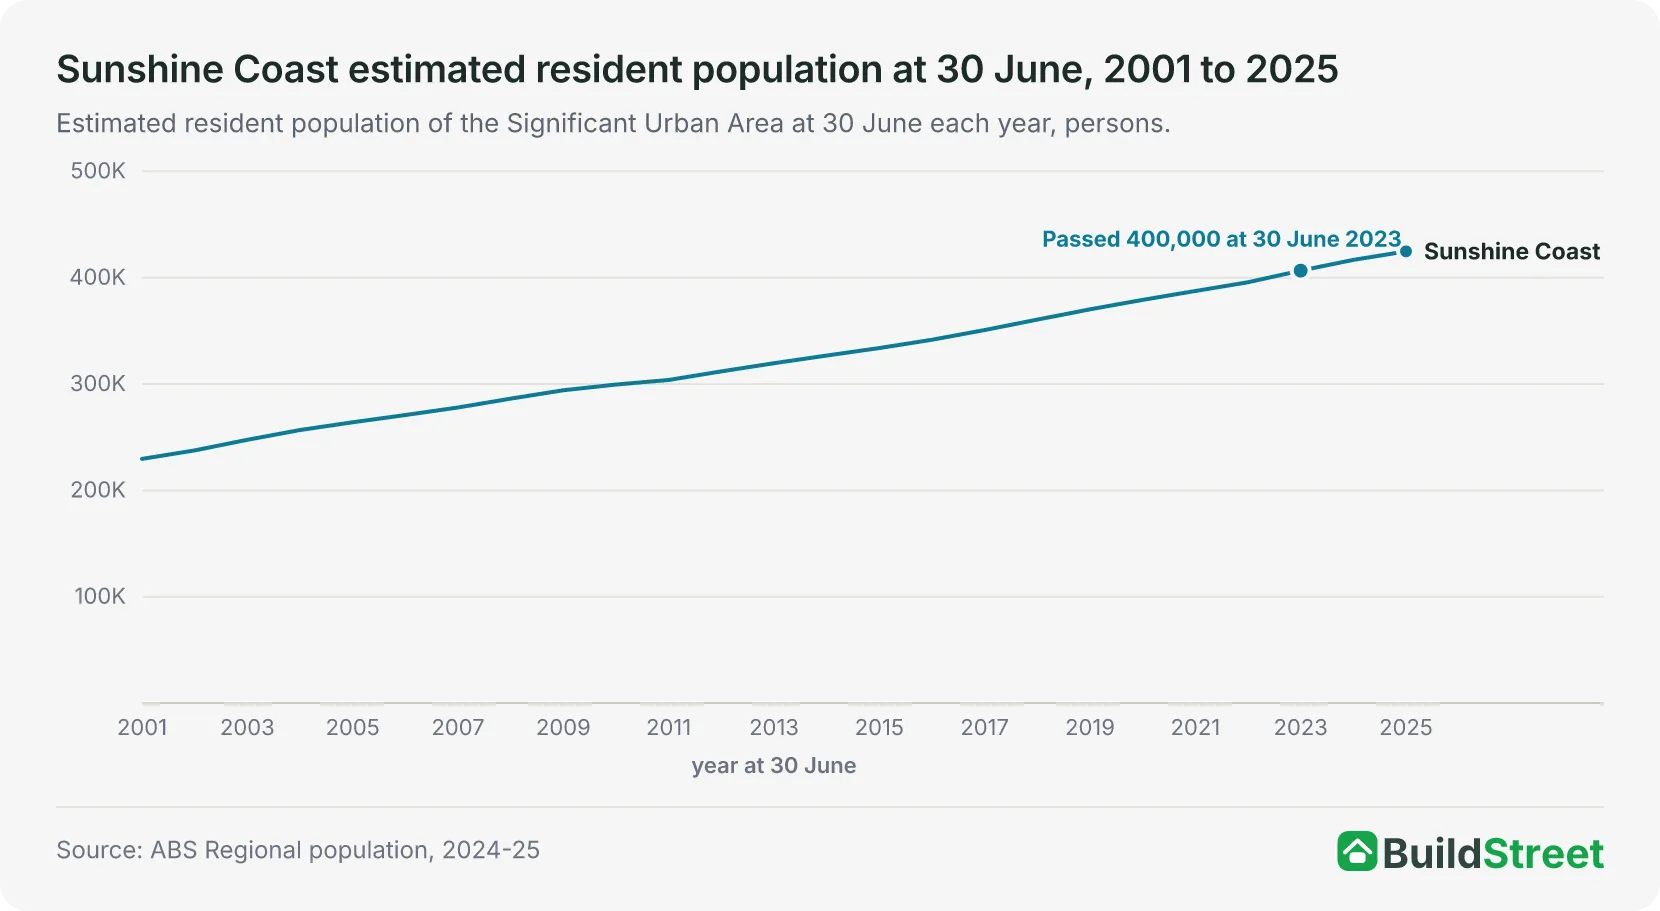
The urban area added 195,147 people between 30 June 2001 and 30 June 2025, growing from 229,594 to 424,741. That is an increase of 85.0 per cent, the highest of Australia's ten largest urban areas over 2001 to 2025. Gold Coast - Tweed Heads grew 76.8 per cent and Perth grew 68.4 per cent over the same years1.
The Sunshine Coast first exceeded 250,000 people at 30 June 2004, 300,000 at 30 June 2011, 350,000 at 30 June 2017 and 400,000 at 30 June 2023, with each milestone based on the first 30 June when the recorded population reached or exceeded the threshold1. The 300,000, 350,000 and 400,000 milestones came seven, six and six years apart. The urban area added 74,230 people between 30 June 2001 and 30 June 2011 and 83,648 between 30 June 2011 and 30 June 2021.6
Looking at the council areas, the Sunshine Coast council area grew from 198,931 at 30 June 2001 to 381,957 at 30 June 2025, an increase of 92.0 per cent, and passed 350,000 residents for the first time at 30 June 2022. Noosa Shire grew from 43,496 to 59,551 over the same years, an increase of 36.9 per cent, and passed 50,000 at 30 June 20091. At the local level, Caloundra West - Baringa grew from 1,986 people at 30 June 2001 to 23,872 at 30 June 2025, equal to twelve times its 2001 population.
| Sunshine Coast population milestones in the annual series | ||
|---|---|---|
| Milestone | First 30 June at or above | Population that year |
| 250,000 | 30 June 2004 | 256,753 |
| 300,000 | 30 June 2011 | 303,824 |
| 350,000 | 30 June 2017 | 350,751 |
| 400,000 | 30 June 2023 | 406,614 |
Source · ABS Population estimates by LGA, Significant Urban Area, Remoteness Area and electoral division, 2001 to 2025, Table 2
Section 08
Sunshine Coast population: quick answers
How many people live on the Sunshine Coast?
The Sunshine Coast Significant Urban Area had an estimated resident population of 424,741 at 30 June 2025. That was the third largest population of Queensland's 19 urban areas, behind Brisbane and Gold Coast - Tweed Heads, and the ninth largest in Australia. The 30 June 2025 estimates are preliminary. The next release, covering 30 June 2026, is due on 25 March 2027.
Is the Sunshine Coast the third largest city in Queensland?
The Sunshine Coast was the third largest of Queensland's 19 Significant Urban Areas with 424,741 residents, behind Brisbane's urban area at 2,745,086 and Gold Coast - Tweed Heads at 761,634. Townsville, at 190,551, and Cairns, at 164,149, were the next largest. The Sunshine Coast has been the state's third largest urban area in every year from 30 June 2001.
How fast is the Sunshine Coast's population growing?
The Sunshine Coast urban area added 8,018 people, or 1.92 per cent, over the 2024-25 financial year. That rate was the fourth highest of Australia's ten largest urban areas, behind Perth, Brisbane and Melbourne. The population increased in every year from 2001-02. The largest increase was 10,922 people, or 2.76 per cent, in 2022-23, and the highest rate was 4.20 per cent in 2002-03. The 2024-25 increase was the smallest since 2015-16.
What is the difference between the Sunshine Coast urban area and Sunshine Coast Council?
The Sunshine Coast Significant Urban Area is an ABS statistical boundary covering the connected coastal urban centres, and it had 424,741 people at 30 June 2025. Sunshine Coast Council is a local government area, a different boundary, which excludes Noosa and includes hinterland localities outside the urban area. It had 381,957 people on the same date. Noosa Shire, a separate council area, had 59,551. The two council areas together had 441,508 people, 16,767 more than the urban area. ABS figures for the different boundaries are not interchangeable.
When did the Sunshine Coast's population pass 400,000?
The Sunshine Coast urban area first exceeded 400,000 people at 30 June 2023, when the ABS data shows 406,614 residents. On the same basis, the urban area passed 300,000 at 30 June 2011 and 350,000 at 30 June 2017. The Sunshine Coast Council passed 350,000 residents at 30 June 2022 and Noosa passed 50,000 at 30 June 2009.
Section 09
Australia population statistics
References
- ABS Regional population, 2024-25 · Australian Bureau of Statistics ↑ b c d e f g h i j k l m n o p q r s t u v w
- ABS Regional population methodology, 2024-25 · Australian Bureau of Statistics ↑ b c
- ABS Regional population, 2024-25: population estimates and components by LGA, 2024 to 2025 (datacube 32180DS0002) · Australian Bureau of Statistics ↑
- ABS Regional population, 2024-25: population components by LGA, 2021-22 to 2024-25 (datacube 32180DS0006) · Australian Bureau of Statistics ↑
- ABS Regional population, 2024-25: population estimates and components by SA2, 2024 to 2025 (datacube 32180DS0001) · Australian Bureau of Statistics ↑
- ABS Regional population, 2024-25: population estimates by LGA and Significant Urban Area, 2001 to 2025 (datacube 32180DS0004) · Australian Bureau of Statistics ↑
