

Published 31 Aug 2026 · Updated 15 Sept 2026
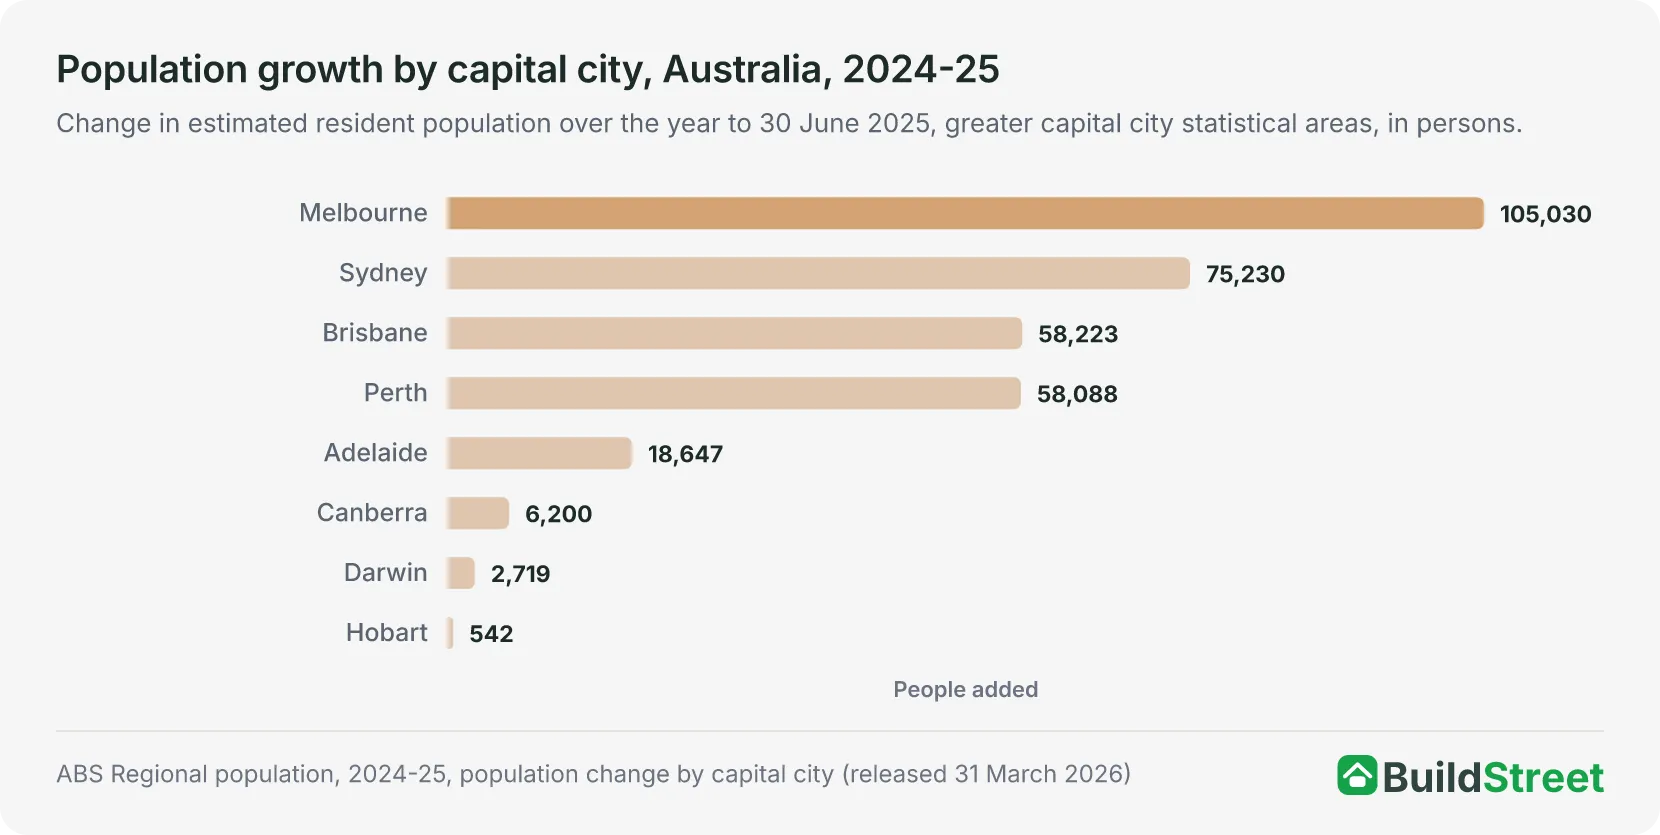 How other cities compareNewcastle - Maitland was Australia's seventh largest urban area at 30 June 2025, and the second largest without a capital city. The cities article ranks growth across the country's capitals and regional centres.
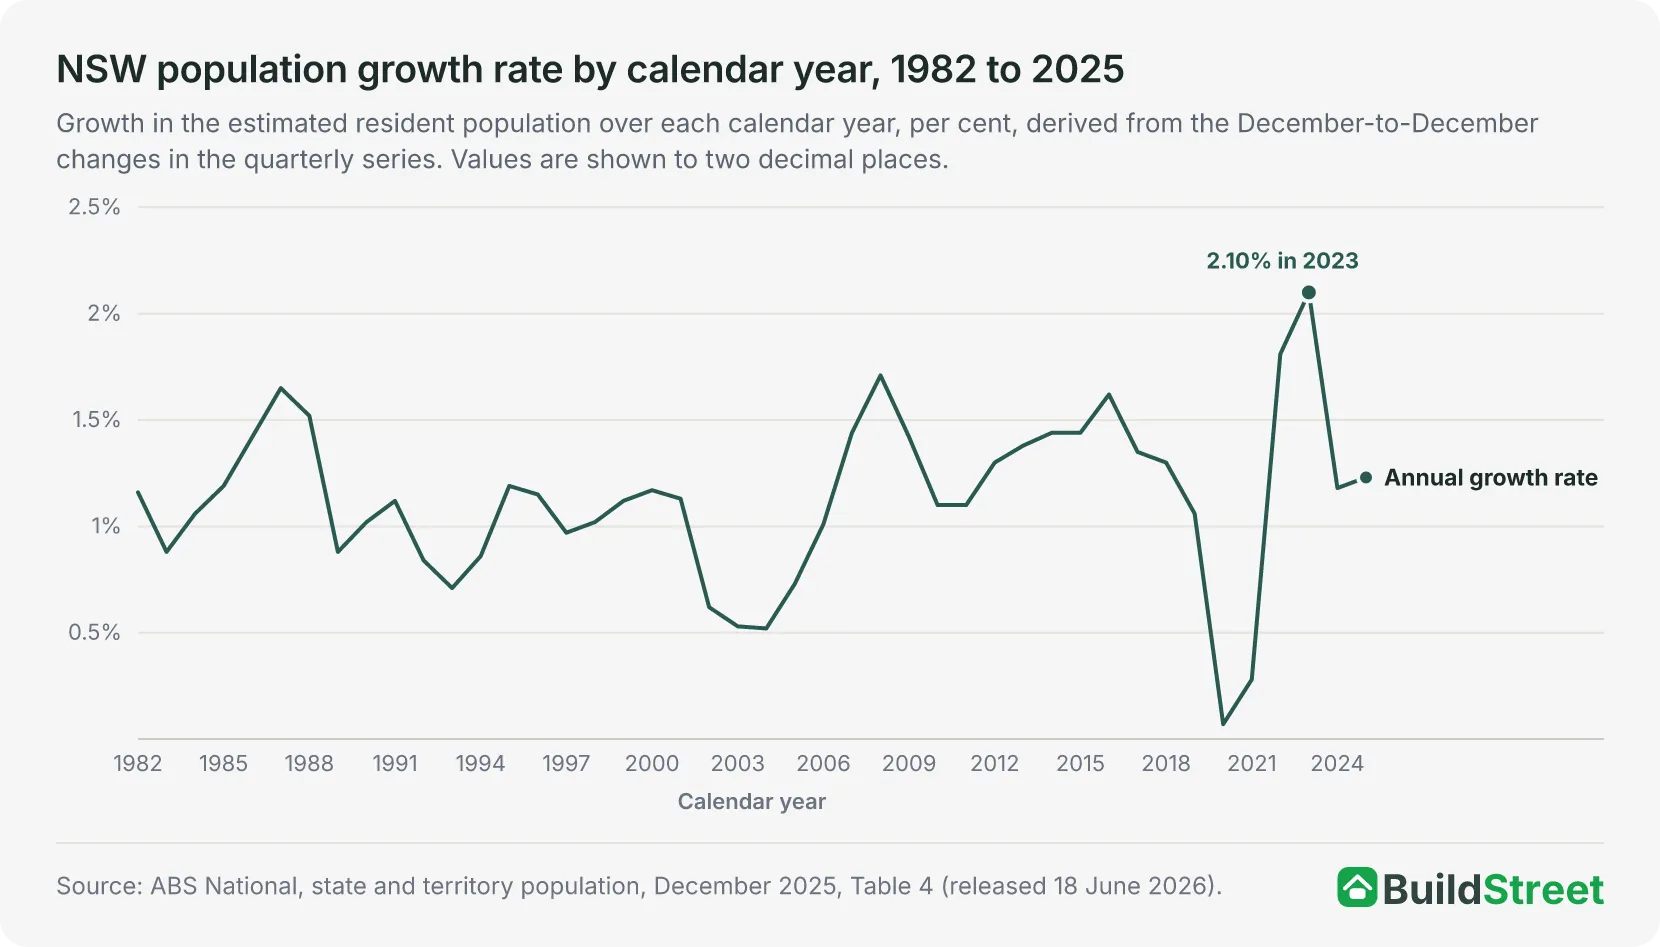 The state pictureNew South Wales had an estimated resident population of 8,592,524 at 30 June 2025 in the ABS annual series. The state article covers the total, its drivers and the split between Greater Sydney and the rest of the state.
Section 01 · The headline number
How many people live in Newcastle?
The Newcastle - Maitland Significant Urban Area had an estimated resident population of 541,634 at 30 June 2025. That made it the largest of the 36 urban areas in New South Wales apart from Sydney, which had 5,219,674 people on the same urban-area basis1. Newcastle - Maitland accounted for 6.3 per cent of New South Wales' estimated 8,592,524 people and 2.0 per cent of Australia's 27,613,654 people2.
The ABS updates the estimate once a year, at 30 June. In this release, the estimates are final for 2001 to 2021, revised for 2022 to 2024 and preliminary for 20253. The next release, covering 30 June 2026, is due on 25 March 20274.
Section 02 · The pace
How fast is Newcastle's population growing?
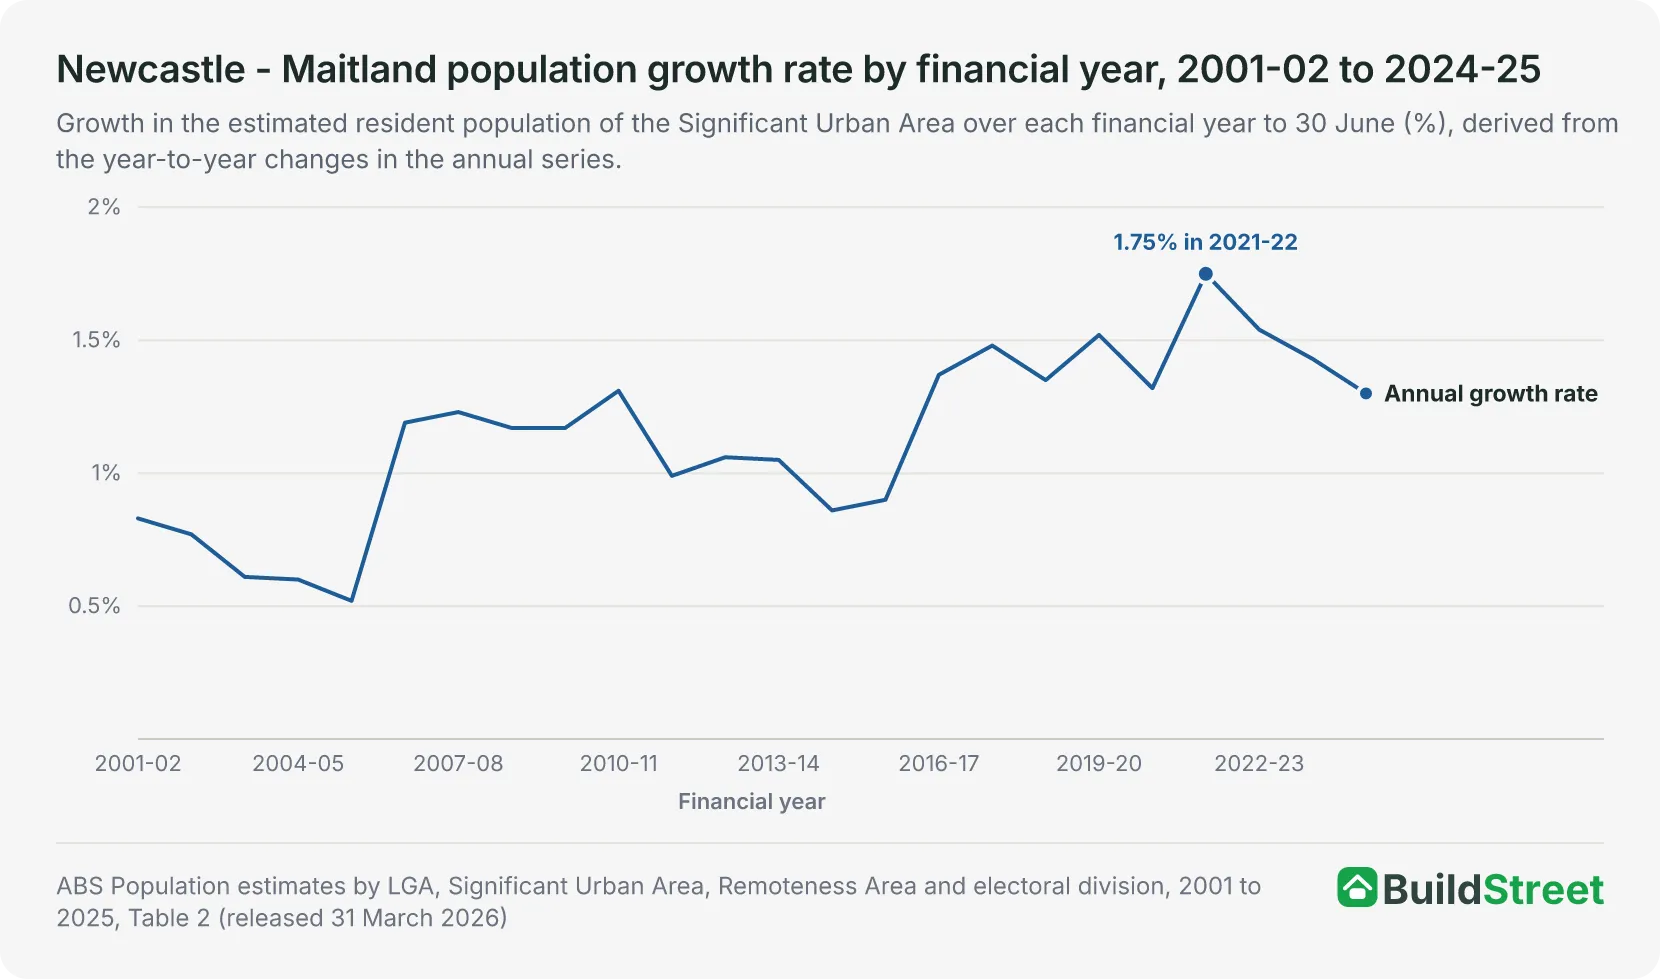
The Newcastle - Maitland urban area added 6,953 people, or 1.30 per cent, in the 2024-25 financial year. The increase was the smallest since 2020-21. Each of the previous three years recorded a larger increase: 8,937 in 2021-22, 8,012 in 2022-23 and 7,557 in 2023-241.
Across the 24 financial years from 2001-02 to 2024-25, growth ranged from 0.52 per cent to 1.75 per cent, and the population increased in every year. The fastest year was 2021-22, when the urban area added 8,937 people (1.75 per cent), the highest increase and growth rate over the period. The slowest was 2005-06, at 2,187 people (0.52 per cent)1.
Growth slowed in each of the three years after the 2021-22 peak, to 1.54 per cent in 2022-23, 1.43 per cent in 2023-24 and 1.30 per cent in 2024-25. The 2024-25 rate was the lowest since 2015-16, when the urban area grew 0.90 per cent1.
Section 03 · The drivers
What drives Newcastle's population growth?
In the City of Newcastle council area, net overseas migration was the largest component of population growth in 2024-25, adding 1,698 people. The ABS publishes the components of population change for council areas rather than for urban areas, so this section uses council-area boundaries. Natural increase (the excess of births over deaths) added 434 people, while net internal migration (moves to and from elsewhere in Australia) subtracted 185 people5. The three components added 1,947 people to the council area's population.
The pattern differed in the neighbouring council areas. Net internal migration was the largest component of population growth in the other four areas, adding 1,342 people in Maitland, 1,405 in Cessnock, 1,535 in Lake Macquarie and 716 in Port Stephens5. The City of Newcastle was the only one of the five council areas to record a net internal migration loss6.
Together, the five council areas added 9,583 people in 2024-25, compared with 6,953 in the urban area. The two totals cover different boundaries and are not directly comparable5.
| Components of population change by council area, 2024-25 | ||||
|---|---|---|---|---|
| Council area (LGA) | Natural increase | Net internal migration | Net overseas migration | Total change |
| Lake Macquarie | +246 | +1,535 | +615 | +2,396 |
| Maitland | +625 | +1,342 | +240 | +2,207 |
| Cessnock | +505 | +1,405 | +101 | +2,011 |
| Newcastle | +434 | -185 | +1,698 | +1,947 |
| Port Stephens | +48 | +716 | +258 | +1,022 |
Source · ABS Population estimates and components by LGA, 2024 to 2025, Table 1
Section 04 · The growth areas
Where in Newcastle is the population growing fastest?
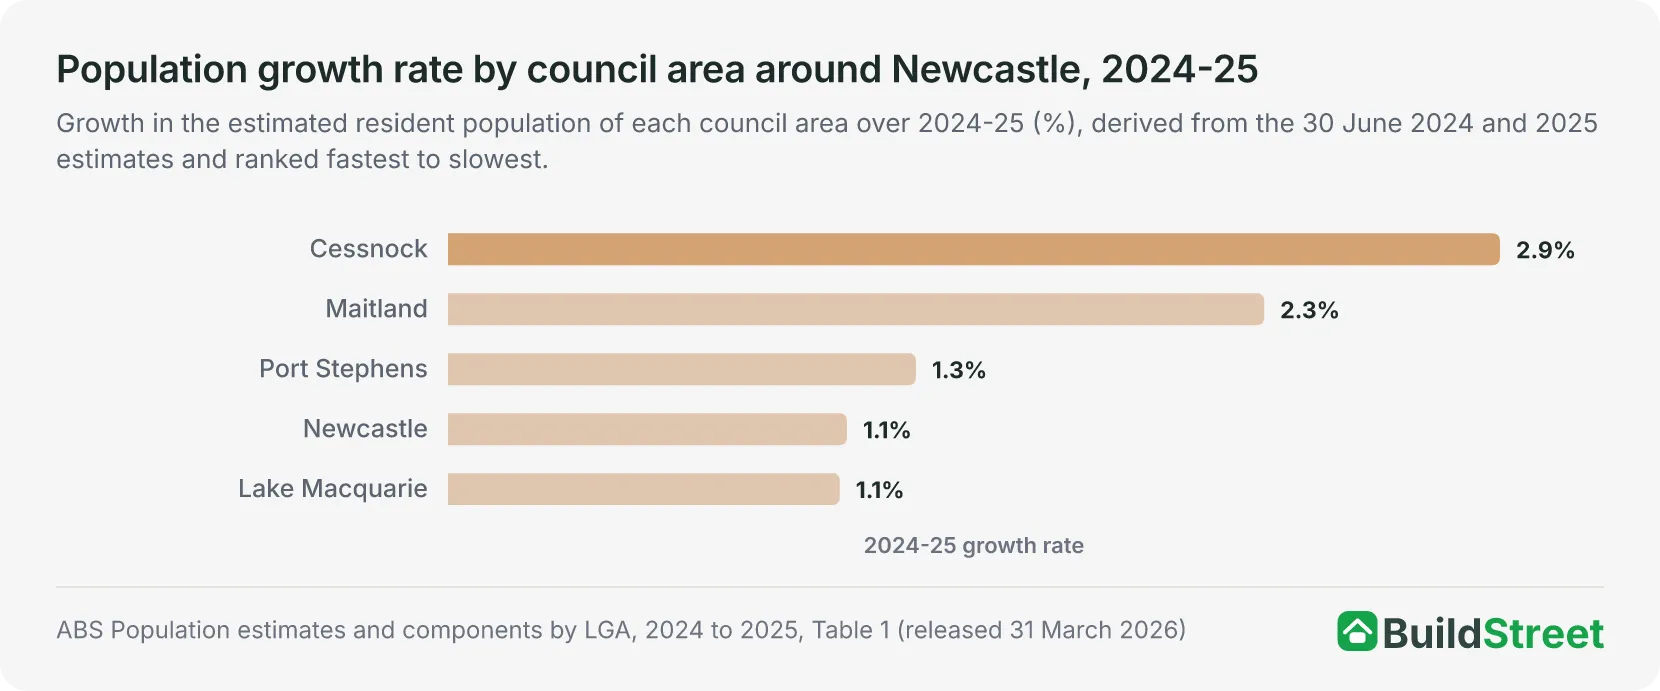
Cessnock's population grew fastest of the five council areas in 2024-25, increasing by 2.90 per cent. Maitland followed at 2.25 per cent, while Port Stephens grew by 1.29 per cent. The City of Newcastle grew by 1.10 per cent, and Lake Macquarie by 1.08 per cent5.
Among the 55 smaller areas across the Newcastle and Lake Macquarie and Hunter Valley excluding Newcastle regions, Branxton - Greta - Pokolbin recorded both the largest increase, at 1,044 people, and the highest growth rate, at 6.8 per cent, growing from 15,369 to 16,413 over the year. Thornton - Millers Forest, in the Maitland area, added 884 people (4.6 per cent), and Morisset - Cooranbong, in Lake Macquarie's west, added 717 (3.5 per cent)7.
The Newcastle and Lake Macquarie region grew from 407,854 to 412,359 people in 2024-25, an increase of 4,505 (1.10 per cent). The Hunter Valley excluding Newcastle, which includes the Maitland, Port Stephens and Lower Hunter areas, grew from 310,824 to 316,250, an increase of 5,426 (1.75 per cent)2.
| The fastest growing areas of Newcastle and the Hunter, 2024-25 | |||||
|---|---|---|---|---|---|
| Area (SA2) | Region (SA4) | 30 June 2024 | 30 June 2025 | Change | Growth rate % |
| Branxton - Greta - Pokolbin | Hunter Valley excluding Newcastle | 15,369 | 16,413 | +1,044 | 6.8 |
| Thornton - Millers Forest | Hunter Valley excluding Newcastle | 19,041 | 19,925 | +884 | 4.6 |
| Morisset - Cooranbong | Newcastle and Lake Macquarie | 20,350 | 21,067 | +717 | 3.5 |
Source · ABS Population estimates and components by SA2, 2024 to 2025, Table 1
Section 05 · The state picture
How does Newcastle compare with other cities in New South Wales?
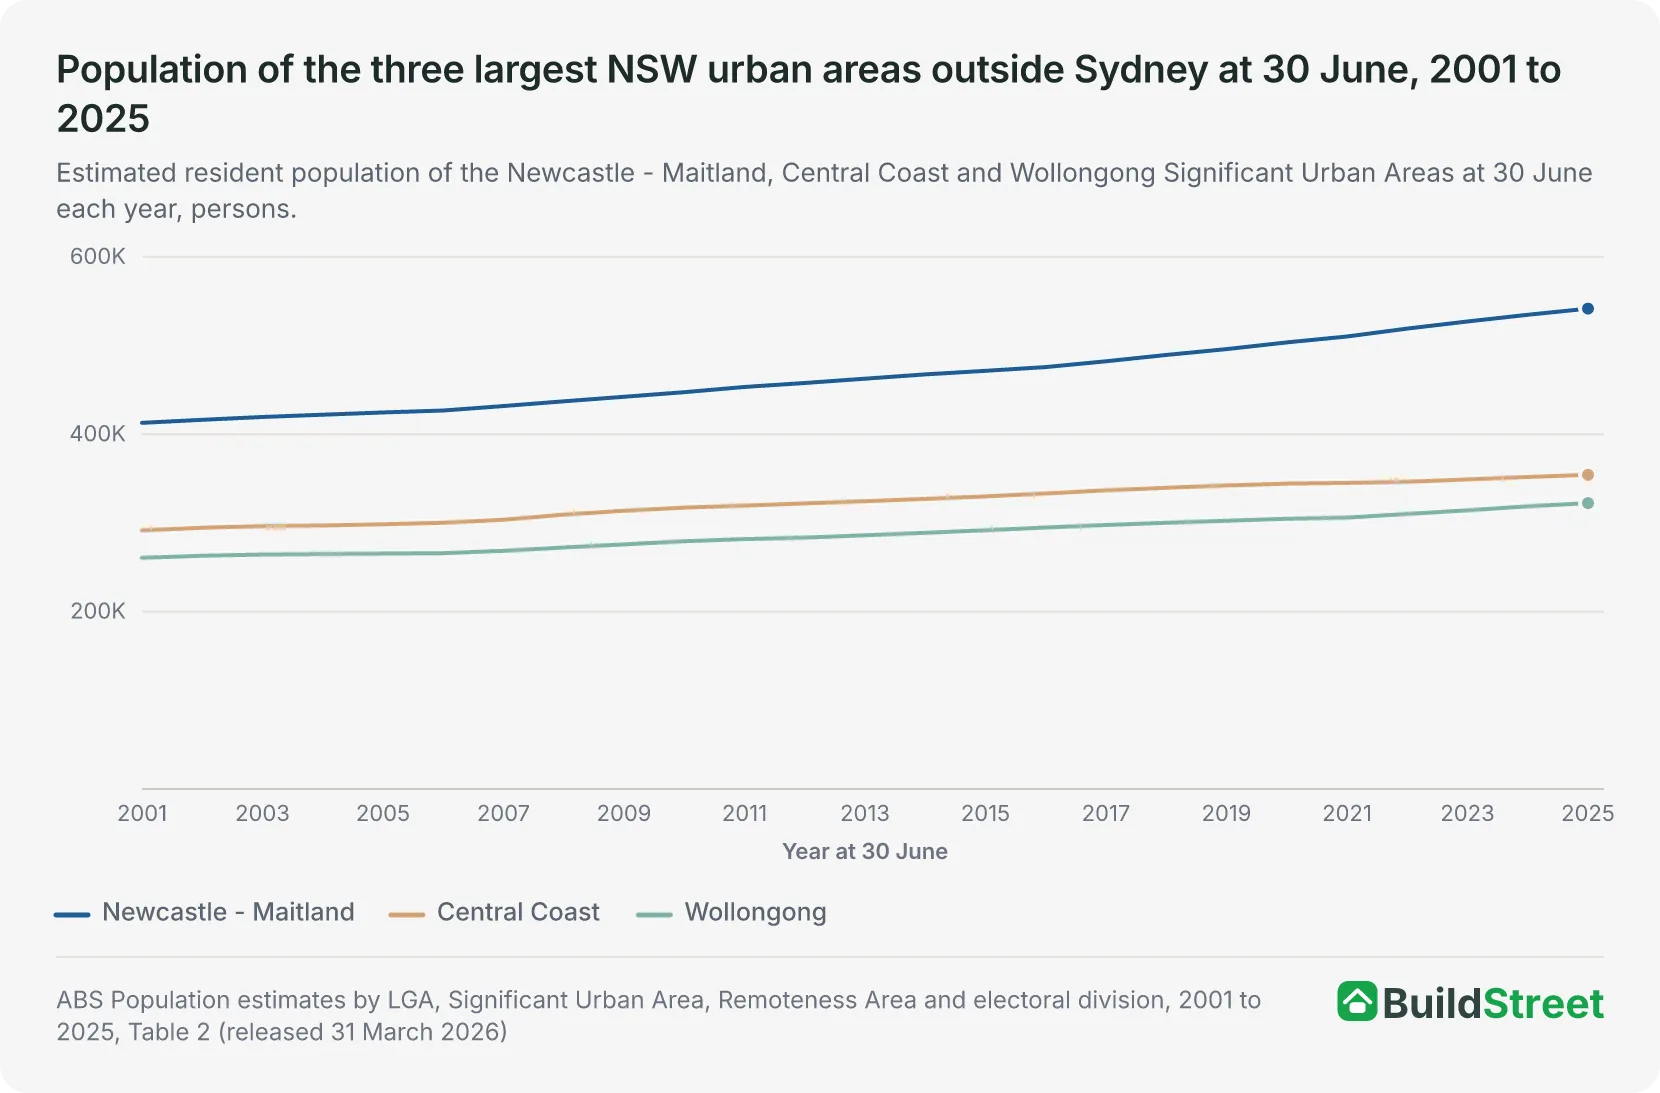
Newcastle - Maitland was the second largest of the 36 urban areas in New South Wales at 30 June 2025, behind Sydney. Sydney had 5,219,674 people, compared with 541,634 in Newcastle - Maitland, 354,189 on the Central Coast and 322,343 in Wollongong. The next largest urban area, Albury - Wodonga, had 102,435 people, less than a fifth of Newcastle - Maitland's total. Albury - Wodonga crosses the Victorian border and is listed in the ABS data under its New South Wales code1.
The gap between Newcastle - Maitland and the Central Coast increased from 121,225 people at 30 June 2001 to 187,445 at 30 June 2025. Wollongong grew from 260,655 to 322,343 over the same period, and was the fourth largest urban area in the state throughout this period1.
Newcastle - Maitland also grew faster than Wollongong and the Central Coast in 2024-25. Its population increased by 1.30 per cent, compared with 1.14 per cent for Wollongong and 0.68 per cent for the Central Coast1.
Across New South Wales, outside Greater Sydney, the population increased by 0.86 per cent over the year. The ABS publishes this as a rounded 25,200 people, or 0.9 per cent. This broader comparison uses Greater Sydney boundaries rather than urban-area boundaries4.
Sydney's population data is covered in the Sydney population article.
Section 06 · The national rank
Where does Newcastle rank among Australia's largest cities?
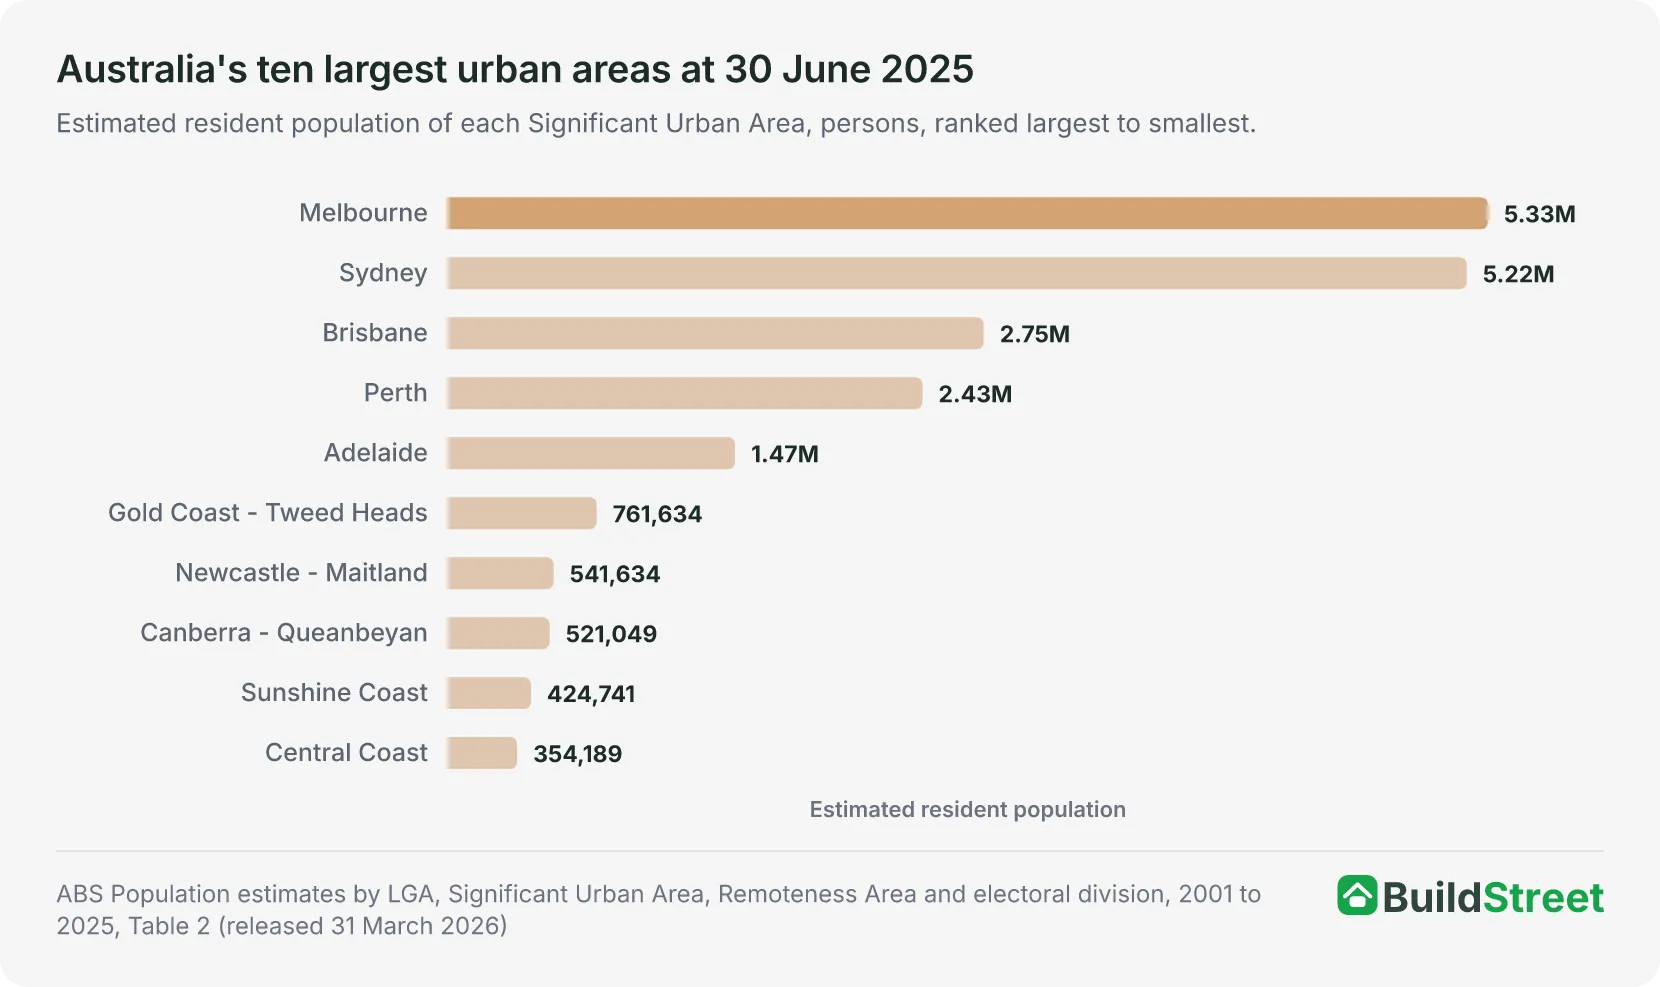
Newcastle - Maitland was the seventh largest urban area in Australia at 30 June 2025. The six larger areas were Melbourne at 5,328,274 people, Sydney at 5,219,674, Brisbane at 2,745,086, Perth at 2,430,757, Adelaide at 1,470,938 and Gold Coast - Tweed Heads at 761,6341.
The capital-city figures in this section use Significant Urban Area boundaries, so they differ from the Greater Capital City figures used elsewhere. Greater Sydney, for example, had 5,638,830 people at 30 June 20251.
Among the urban areas that do not contain a capital city, only Gold Coast - Tweed Heads, with 761,634 people, was larger. Newcastle - Maitland was the second largest of these urban areas, ahead of the Sunshine Coast at 424,741. The urban area also had more people than Canberra - Queanbeyan, at 521,049, which includes the national capital1.
Population growth across Australia's 10 largest urban areas ranged from 0.68 per cent on the Central Coast to 2.40 per cent in Perth in 2024-25. Newcastle - Maitland's population grew by 1.30 per cent, ranking seventh among the 10 areas, below Sydney's 1.37 per cent and ahead of Adelaide's 1.27 per cent1.
| Australia's ten largest urban areas, as at 30 June 2025 | |||
|---|---|---|---|
| Urban area (SUA) | Population | Change over 2024-25 | Growth rate % |
| Melbourne | 5,328,274 | +102,910 | 1.97 |
| Sydney | 5,219,674 | +70,670 | 1.37 |
| Brisbane | 2,745,086 | +56,017 | 2.08 |
| Perth | 2,430,757 | +56,991 | 2.40 |
| Adelaide | 1,470,938 | +18,417 | 1.27 |
| Gold Coast - Tweed Heads | 761,634 | +12,279 | 1.64 |
| Newcastle - Maitland | 541,634 | +6,953 | 1.30 |
| Canberra - Queanbeyan | 521,049 | +5,894 | 1.14 |
| Sunshine Coast | 424,741 | +8,018 | 1.92 |
| Central Coast | 354,189 | +2,401 | 0.68 |
Source · ABS Population estimates by LGA, Significant Urban Area, Remoteness Area and electoral division, 2001 to 2025, Table 2
Section 07 · The long run
How has Newcastle's population changed since 2001?
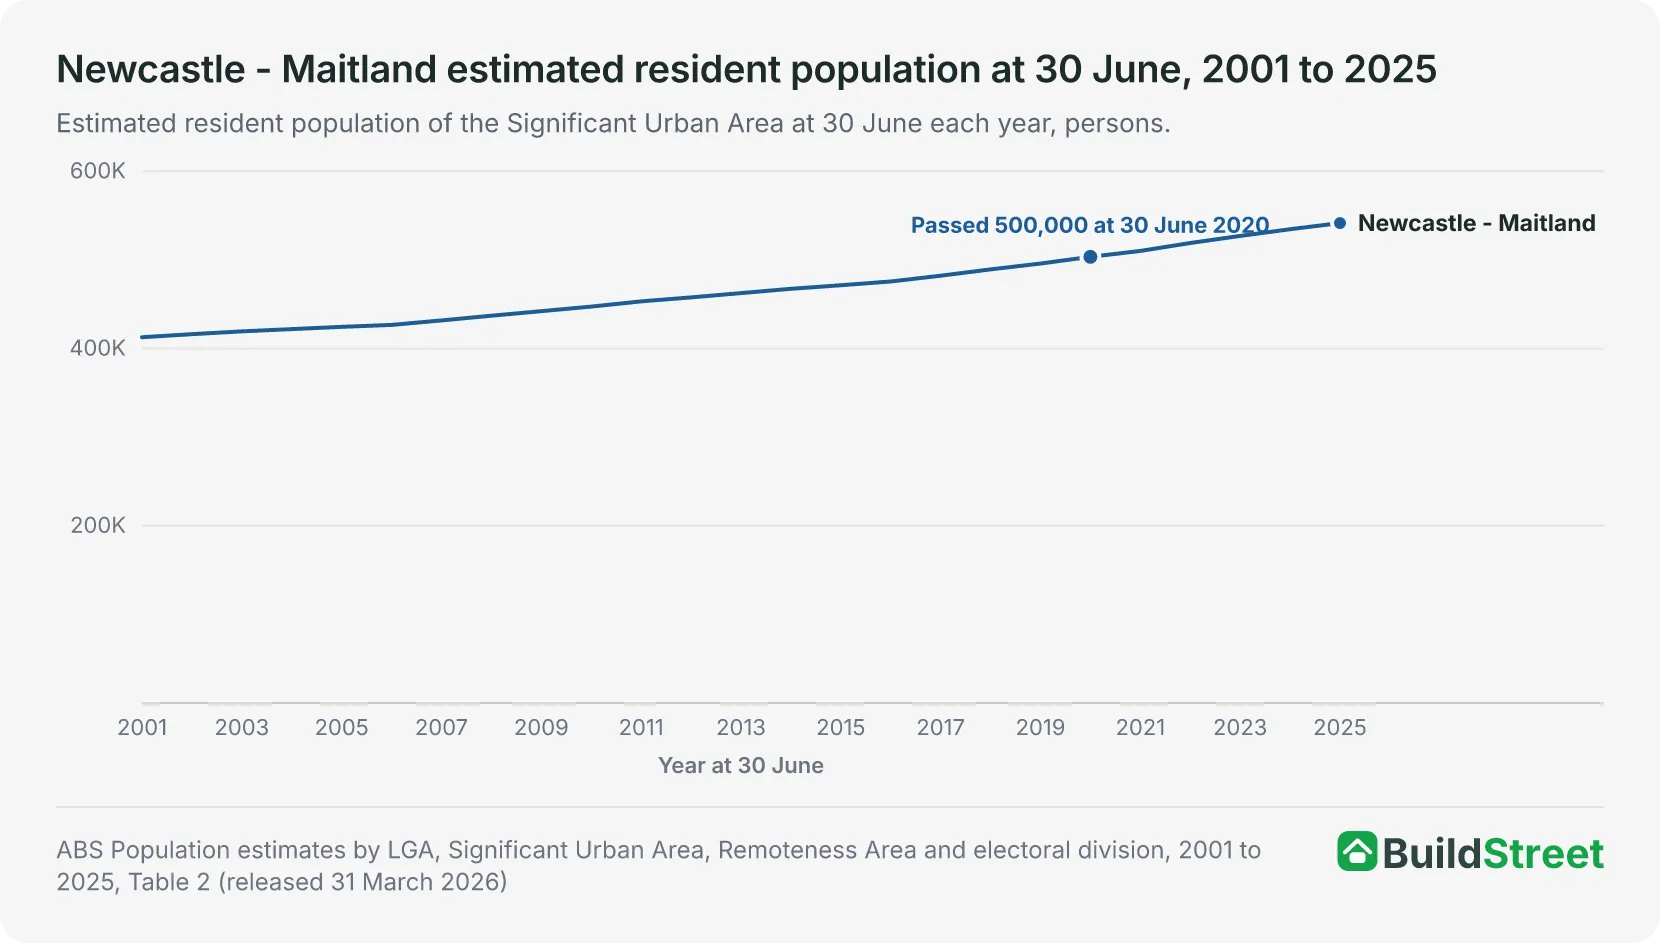
The Newcastle - Maitland urban area added 128,824 people between 30 June 2001 and 30 June 2025, growing from 412,810 to 541,634. The 2025 population was 1.31 times its 2001 population1.
Newcastle - Maitland passed several population milestones over this period. It first exceeded 425,000 at 30 June 2006, 450,000 at 30 June 2011, 475,000 at 30 June 2016, 500,000 at 30 June 2020 and 525,000 at 30 June 20231. The gaps between milestones shortened from five years to four, then three.
Maitland also passed a milestone in 2025. The council area's population passed 100,000 residents for the first time at 30 June 2025, reaching 100,439, up from 56,055 at 30 June 2001. Its 2024-25 increase of 2,207 people was the second largest of the five council areas, behind Lake Macquarie's 2,3961.
| Newcastle - Maitland population milestones in the annual series | ||
|---|---|---|
| Milestone | First 30 June at or above | Population that year |
| 425,000 | 30 June 2006 | 426,711 |
| 450,000 | 30 June 2011 | 453,265 |
| 475,000 | 30 June 2016 | 475,716 |
| 500,000 | 30 June 2020 | 503,518 |
| 525,000 | 30 June 2023 | 527,124 |
Source · ABS Population estimates by LGA, Significant Urban Area, Remoteness Area and electoral division, 2001 to 2025, Table 2
Section 08
Newcastle population: quick answers
How many people live in Newcastle?
The Newcastle - Maitland Significant Urban Area had an estimated resident population of 541,634 at 30 June 2025. That made it the largest urban area in New South Wales outside Sydney and the seventh largest in Australia. The 30 June 2025 estimates are preliminary. The next release, covering 30 June 2026, is due on 25 March 2027.
Is Newcastle the second largest city in New South Wales?
Newcastle - Maitland was the second largest of the 36 Significant Urban Areas the ABS lists in New South Wales at 30 June 2025, with 541,634 residents, behind Sydney's urban area at 5,219,674. The Central Coast, at 354,189, and Wollongong, at 322,343, were the next largest. Gold Coast - Tweed Heads and Canberra - Queanbeyan cross state or territory borders and are listed under Queensland and the Australian Capital Territory.
How fast is Newcastle's population growing?
The Newcastle - Maitland urban area added 6,953 people, or 1.30 per cent, over the 2024-25 financial year, based on the change between the 30 June 2024 and 30 June 2025 estimates. The population increased every year from 2001-02 to 2024-25, and growth peaked at 8,937 people (1.75 per cent) in 2021-22. The 2024-25 rate was the lowest since 2015-16.
What is the difference between Newcastle - Maitland and the City of Newcastle?
Newcastle - Maitland is a Significant Urban Area, an ABS statistical boundary covering connected urban centres, with 541,634 people at 30 June 2025. The City of Newcastle is a local government area with a different boundary, and it had 178,935 people at the same date. The two population figures cover different geographic areas and are not directly comparable.
When did Newcastle's population pass 500,000?
The Newcastle - Maitland urban area first exceeded 500,000 people at 30 June 2020, reaching 503,518. It had previously passed 450,000 at 30 June 2011 and later passed 525,000 at 30 June 2023. The Maitland council area also passed 100,000 people for the first time at 30 June 2025.
References
- ABS Regional population, 2024-25: population estimates by LGA and Significant Urban Area, 2001 to 2025 (datacube 32180DS0004) · Australian Bureau of Statistics ↑ b c d e f g h i j k l m n
- ABS Regional population, 2024-25: population estimates by SA2 and above, 2001 to 2025 (datacube 32180DS0003) · Australian Bureau of Statistics ↑ b
- ABS Regional population methodology, 2024-25 · Australian Bureau of Statistics ↑
- ABS Regional population, 2024-25 · Australian Bureau of Statistics ↑ b
- ABS Regional population, 2024-25: population estimates and components by LGA, 2024 to 2025 (datacube 32180DS0002) · Australian Bureau of Statistics ↑ b c d
- ABS Regional population, 2024-25: population components by LGA, 2021-22 to 2024-25 (datacube 32180DS0006) · Australian Bureau of Statistics ↑
- ABS Regional population, 2024-25: population estimates and components by SA2, 2024 to 2025 (datacube 32180DS0001) · Australian Bureau of Statistics ↑
