

Published 2 Sept 2026 · Updated 16 Sept 2026
The Byron Bay urban area had 11,482 residents at 30 June 2025 and the Byron Shire council area around it had 38,784, according to Australian Bureau of Statistics (ABS) Regional population data. Both figures count usual residents, not visitors. The town added 180 people, or 1.59 per cent, in 2024-25, and the shire added 697, or 1.83 per cent. Overseas migration added 184 people to the Byron Bay local area, while the town lost a net 20 people to the rest of Australia. The shire gained 219 people from internal moves and 340 from overseas migration.
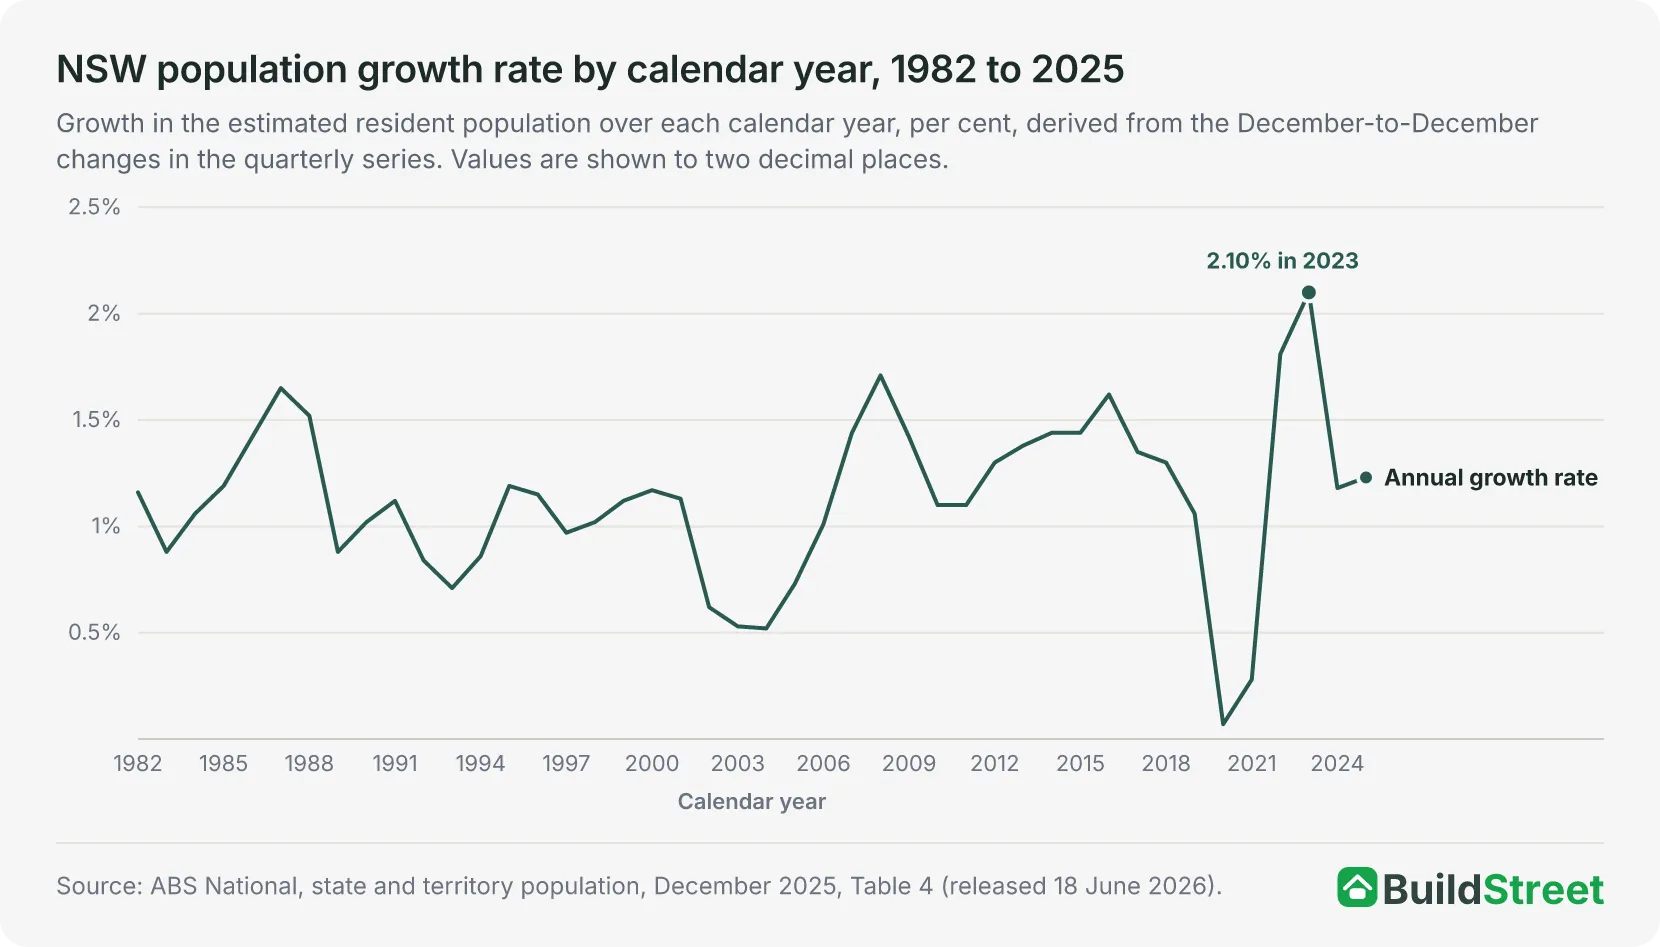 The state pictureNew South Wales had an estimated resident population of 8,592,524 at 30 June 2025 in the ABS annual series, an increase of 100,474 people, or 1.18 per cent, over 2024-25. The state article covers the total, its drivers and the split between Greater Sydney and the rest of the state.
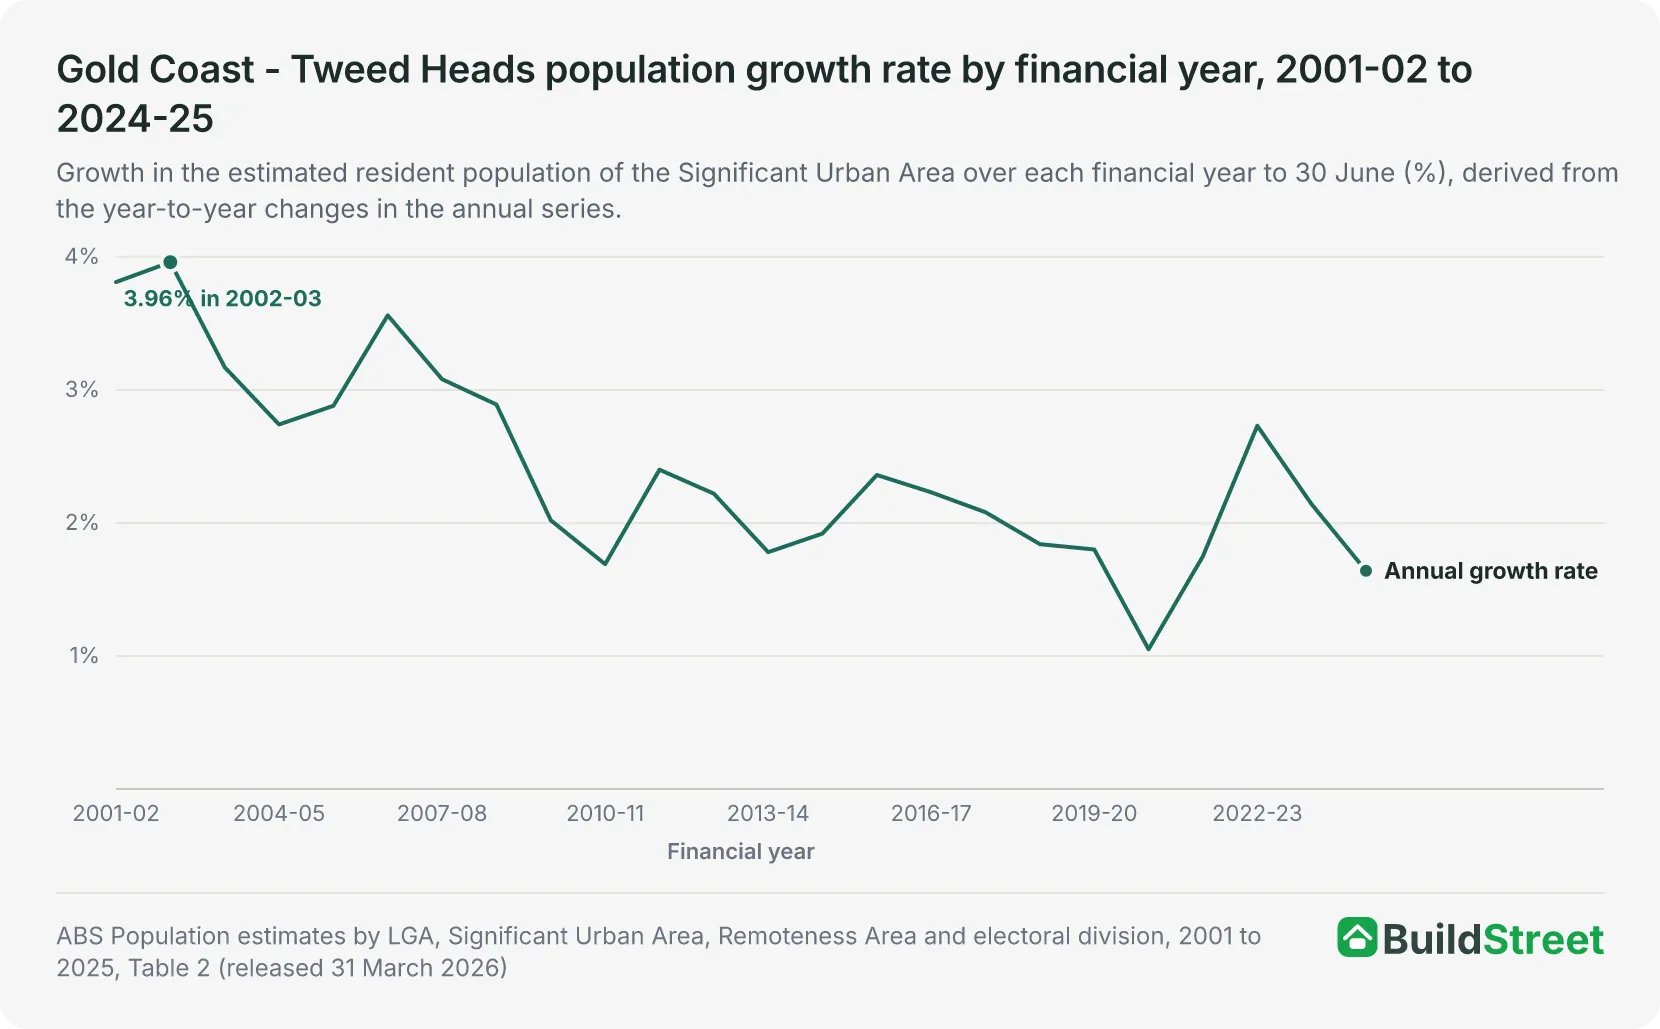 The neighbour across the borderTweed Heads, at the northern end of the Northern Rivers, is counted by the ABS within the cross-border Gold Coast - Tweed Heads urban area, which held 761,634 people at 30 June 2025. The Gold Coast article covers that urban area and the Tweed council area.
Section 01 · The headline number
How many people live in Byron Bay?
The Byron Bay Significant Urban Area had an estimated resident population of 11,482 at 30 June 2025. The Byron Shire council area, which surrounds the town and also covers Mullumbimby, Brunswick Heads, Ocean Shores and Bangalow, had 38,784 people on the same date, so the town accounted for about three in ten of the shire's residents. Byron Bay was the smallest of the 36 urban areas in New South Wales, below Lithgow at 12,124 and Muswellbrook at 12,595, and the 99th largest of the 102 Significant Urban Areas across Australia1.
The ABS publishes the estimates once a year, each dated 30 June. In the 2024-25 release, the estimates are final for 2001 to 2021, revised for 2022 to 2024 and preliminary for 20252. The next release, covering 30 June 2026, is due on 25 March 20273.
Section 02 · The pace
How fast is Byron Bay's population growing?
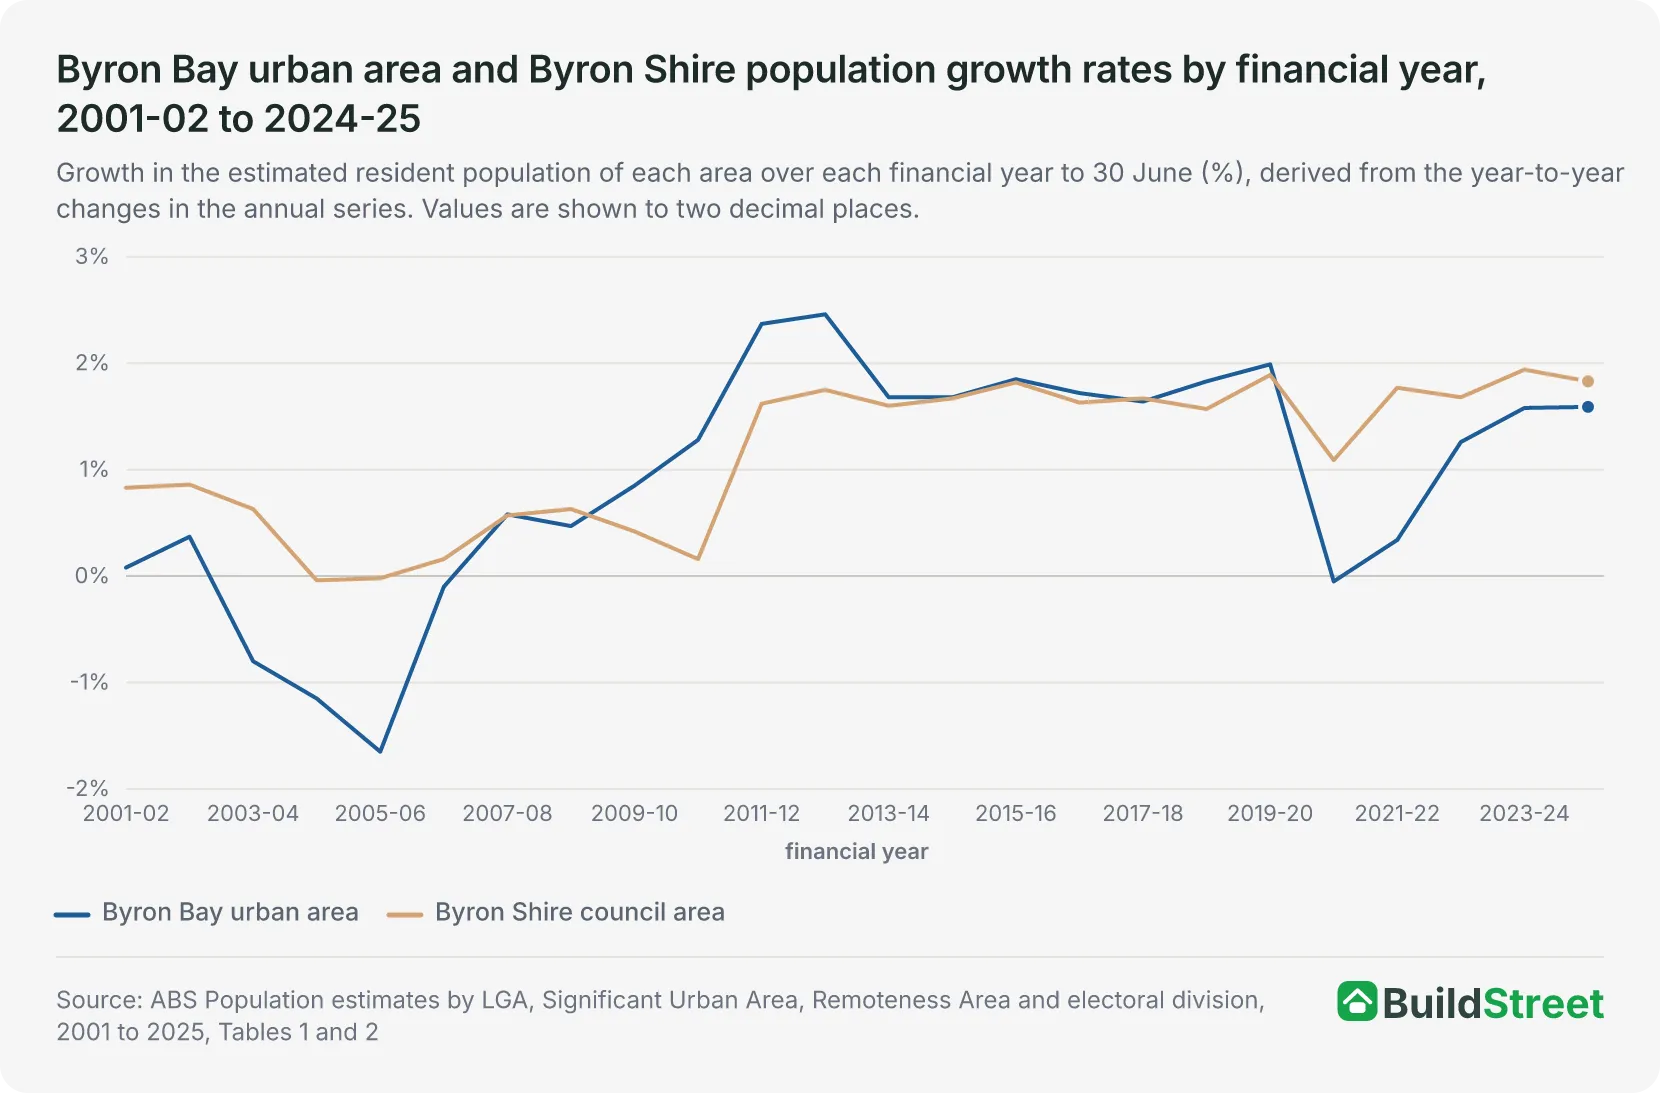
The Byron Bay urban area added 180 people, or 1.59 per cent, in 2024-25, from 11,302 at 30 June 2024 to 11,482 at 30 June 2025. The increase was the largest since 2019-20, when the town added 214 people. The increases in the two preceding years were smaller, at 138 in 2022-23 and 176 in 2023-241.
The town's population declined in five of the 24 years from 2001-02 to 2024-25. It fell in each of the four years from 2003-04 to 2006-07, from 9,288 at 30 June 2003 to 8,949 at 30 June 2007, and by five people in 2020-211.
Across the 24 financial years, growth ranged from a fall of 1.65 per cent in 2005-06 to an increase of 2.46 per cent in 2012-13, when the town added 233 people, the largest annual increase over the period1.
Byron Shire grew 1.83 per cent over 2024-25, adding 697 people to reach 38,784. The shire's growth rate was above the town's in 13 of the 24 years, and the shire's population fell in two of the 24 years, by 11 people in 2004-05 and by five in 2005-06. Its largest increase was 725 people, or 1.94 per cent, in 2023-241.
Section 03 · The drivers
What drives population growth in Byron Bay and Byron Shire?
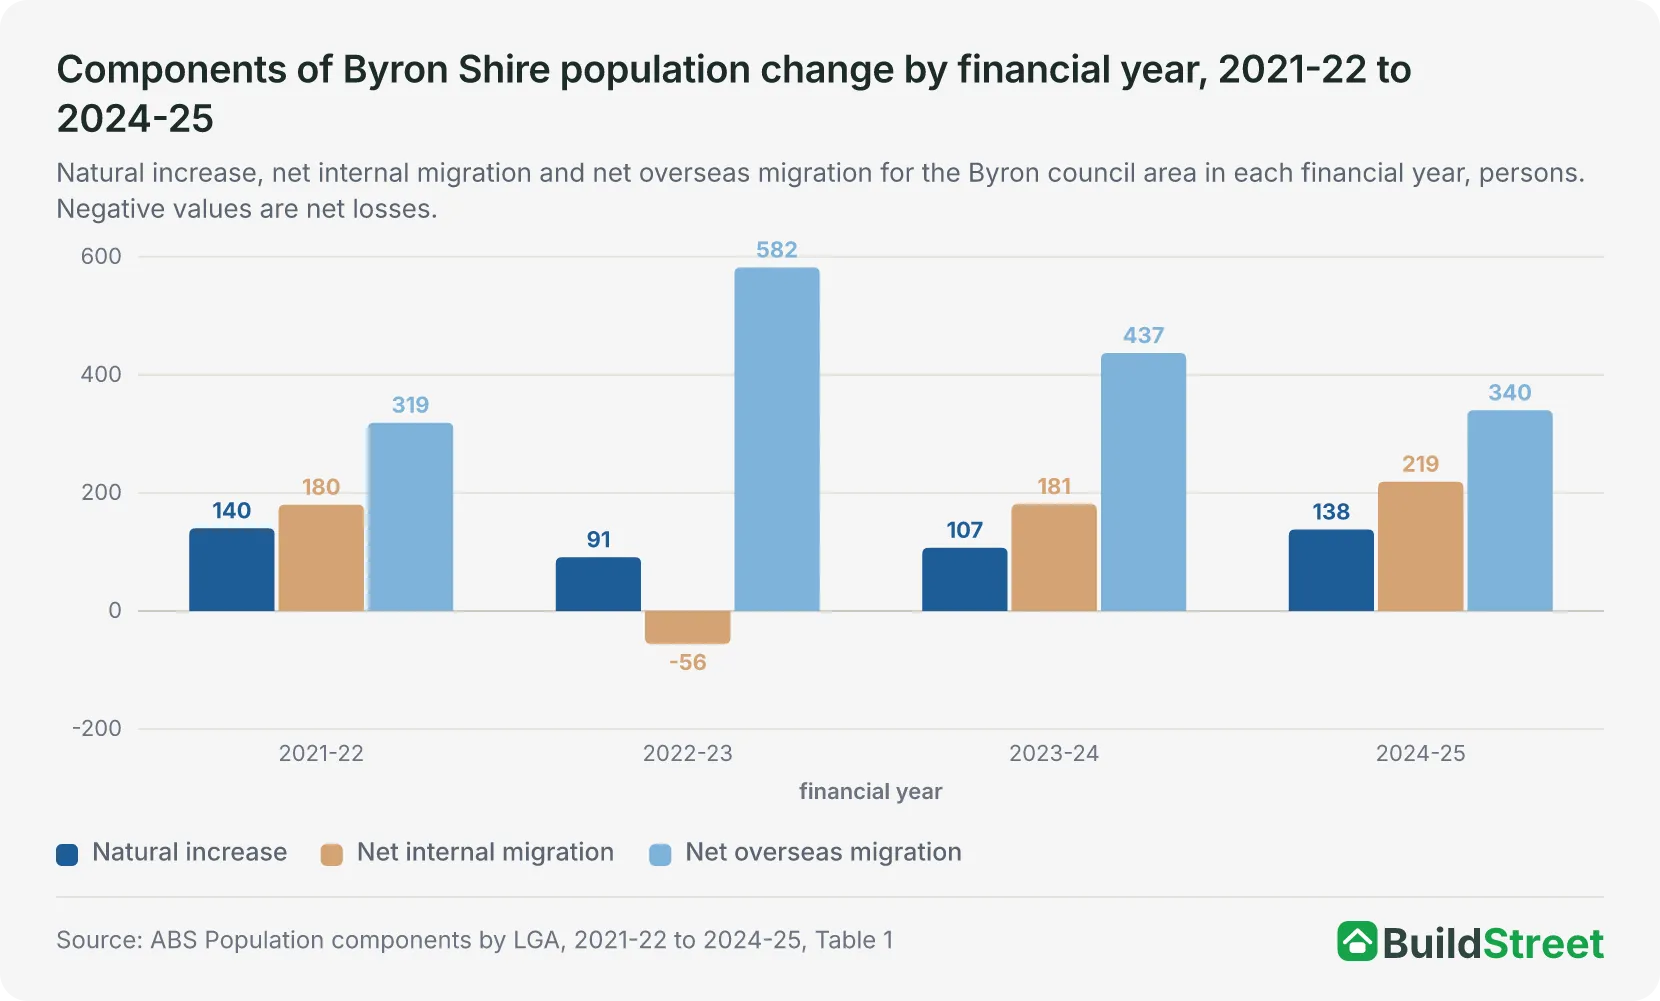
In 2024-25, net overseas migration added 340 people to Byron Shire, the largest of the three components of the council area's change. Net internal migration, which is moves to and from elsewhere in Australia, added 219 people. Natural increase, the excess of births over deaths, added 138. Together, these components accounted for the shire's increase of 6975.
The ABS publishes the components of population change for council areas and smaller local areas, rather than urban areas. The Byron Bay figures in this section therefore use the local area of the same name, which has the same population estimate as the urban area.
Net overseas migration was the largest component of Byron Shire's population growth in each of the four years from 2021-22 to 2024-25. It added 319 people in 2021-22, 582 in 2022-23, 437 in 2023-24 and 340 in 2024-25. Net internal migration added 180 people in 2021-22, recorded a net loss of 56 in 2022-23, then added 181 in 2023-24 and 219 in 2024-25. Natural increase ranged from 91 to 140 a year6.
The Byron Bay local area recorded a net loss of people to the rest of Australia in each of the four years. The losses were 147 in 2021-22, 162 in 2022-23, 62 in 2023-24 and 20 in 2024-25, a combined loss of 391 people. Over the same four years, net overseas migration added 845 people and natural increase added 777.
| Components of population change, Byron Shire and the Byron Bay area, 2024-25 | ||
|---|---|---|
| Component | Byron Shire (LGA) | Byron Bay area (SA2) |
| Births | 370 | 96 |
| Deaths | 232 | 80 |
| Natural increase | +138 | +16 |
| Internal arrivals | 2,663 | 924 |
| Internal departures | 2,444 | 944 |
| Net internal migration | +219 | -20 |
| Overseas arrivals | 632 | 320 |
| Overseas departures | 292 | 136 |
| Net overseas migration | +340 | +184 |
| Total change | +697 | +180 |
Source · ABS Population components by LGA, 2021-22 to 2024-25, Table 1, and ABS Population components by SA2, 2021-22 to 2024-25, Table 1
Section 04 · The growth areas
Where in Byron Shire is the population growing fastest?
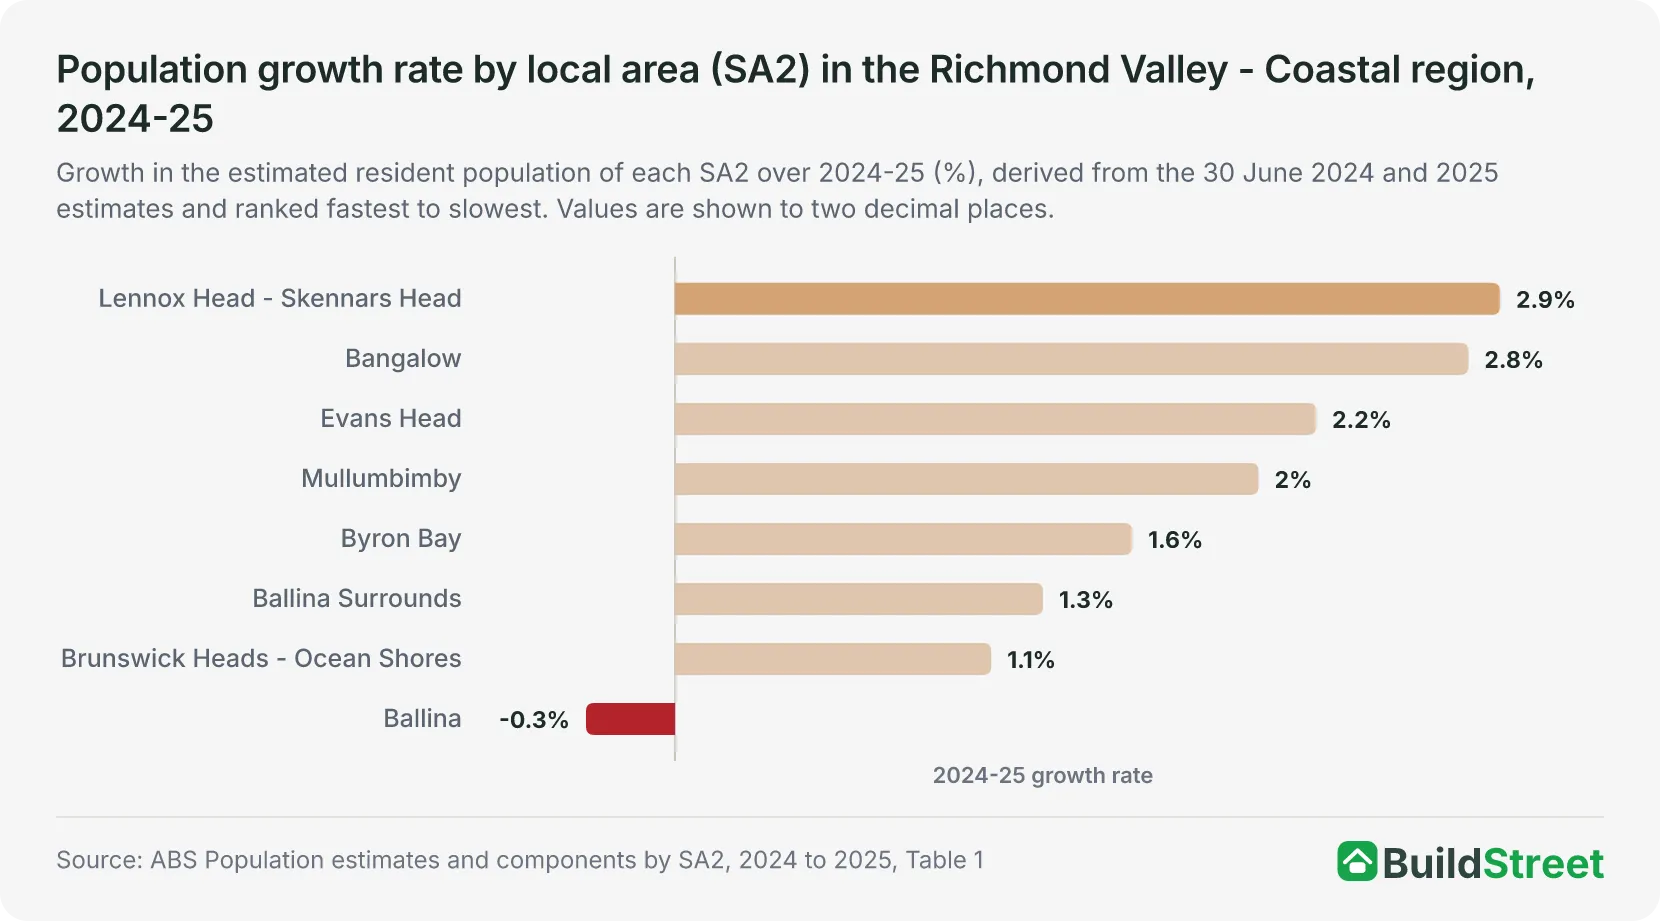
Among the four local areas covering Byron Shire's main centres, Bangalow grew fastest in 2024-25, at 2.76 per cent, adding 205 people to reach 7,627. Mullumbimby added 192 people, or 2.03 per cent, Byron Bay 180, or 1.59 per cent, and Brunswick Heads - Ocean Shores 106, or 1.10 per cent8. Together, the four areas had a population of 38,536 at 30 June 2025, compared with 38,784 in the council area. The ABS prepares the local-area and council-area estimates separately because their boundaries do not match exactly2.
Net internal migration added people to two of the four local areas in 2024-25. Bangalow gained 126 people from moves within Australia and Mullumbimby gained 105; Brunswick Heads - Ocean Shores recorded no net change and Byron Bay lost 20. Net overseas migration added 184 people to Byron Bay in 2024-25, more than the other three areas combined, compared with 42 in Bangalow, 58 in Brunswick Heads - Ocean Shores and 55 in Mullumbimby8.
The wider Richmond Valley - Coastal region takes in these four local areas and four more around Ballina and Evans Head. Of the eight, Lennox Head - Skennars Head had the highest growth rate, at 2.87 per cent, and the largest increase, at 287 people. The Ballina local area was the only one of the eight to decline, by 59 people. It was also the most densely populated at 30 June 2025, at 520.3 people per square kilometre, followed by Byron Bay at 288.7 and Lennox Head - Skennars Head at 271.78.
| Byron Shire's main centres by local area (SA2), 2024-25 | ||||||
|---|---|---|---|---|---|---|
| Area (SA2) | 30 June 2024 | 30 June 2025 | Change | Growth rate % | Net internal migration | Net overseas migration |
| Bangalow | 7,422 | 7,627 | +205 | 2.76 | +126 | +42 |
| Mullumbimby | 9,470 | 9,662 | +192 | 2.03 | +105 | +55 |
| Byron Bay | 11,302 | 11,482 | +180 | 1.59 | -20 | +184 |
| Brunswick Heads - Ocean Shores | 9,659 | 9,765 | +106 | 1.10 | 0 | +58 |
Source · ABS Population estimates and components by SA2, 2024 to 2025, Table 1
Section 05 · The neighbours
How does Byron Shire compare with the other Northern Rivers council areas?
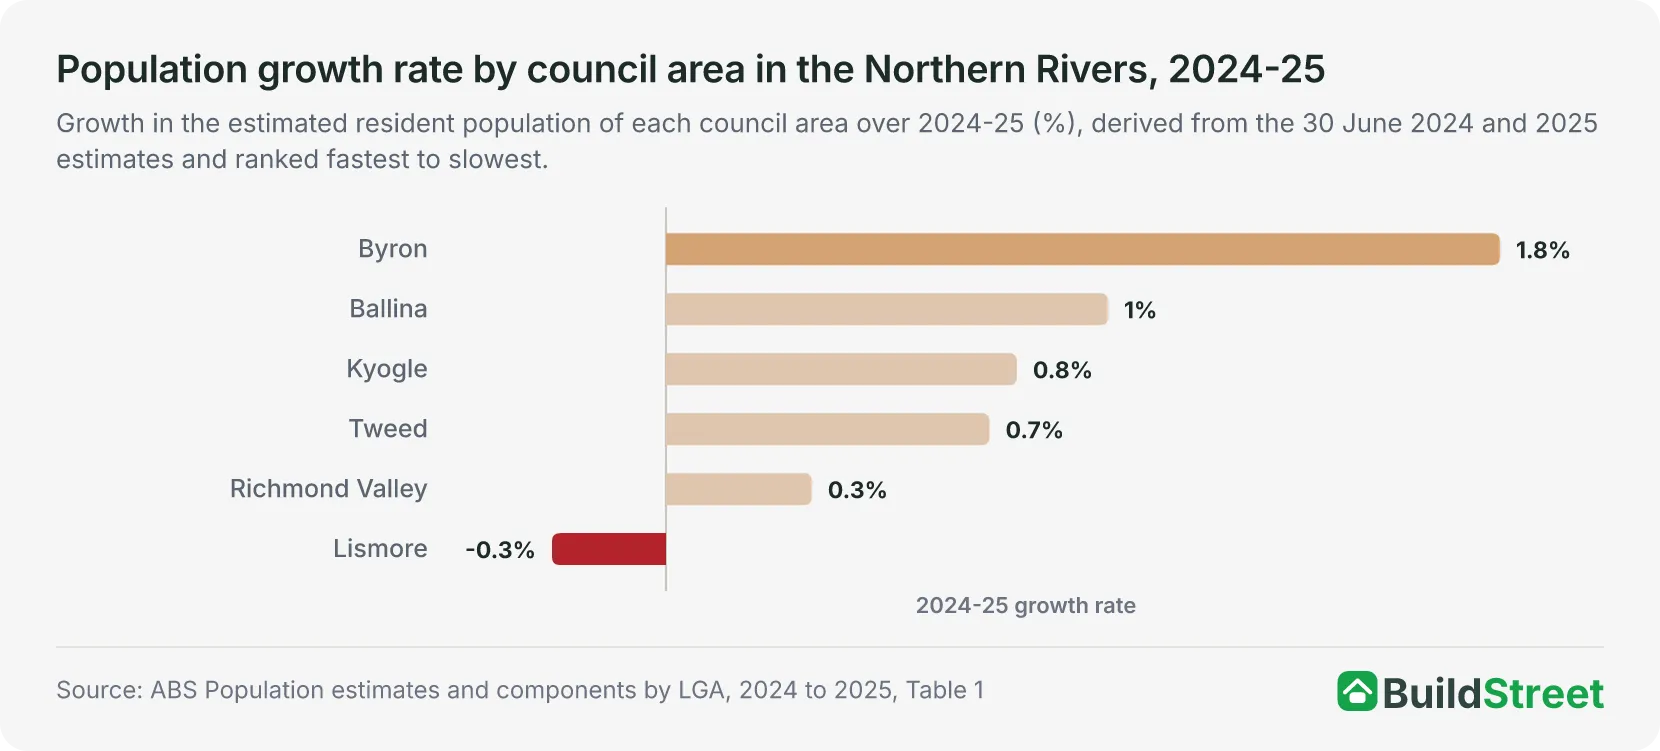
Byron Shire had the highest population growth rate of the six Northern Rivers council areas in 2024-25, at 1.83 per cent. The six are Ballina, Byron, Kyogle, Lismore, Richmond Valley and Tweed. Ballina grew by 0.97 per cent, Kyogle 0.77 per cent, Tweed 0.71 per cent and Richmond Valley 0.32 per cent. Lismore's population fell by 0.25 per cent, from 43,750 to 43,6425. Tweed, the largest of the six at 101,044 people, recorded the largest increase, adding 716 people compared with 697 in Byron Shire.
Net internal migration added people to four of the six council areas. Tweed gained 427 people from moves within Australia, Ballina 313, Byron 219 and Kyogle 57, while Richmond Valley lost 17 and Lismore 323. Net overseas migration added 420 people to Tweed, 340 to Byron, 202 to Ballina, 149 to Lismore, 52 to Richmond Valley and 18 to Kyogle5.
Byron Shire also had the largest natural increase of the six, at 138, from 370 births and 232 deaths. Deaths exceeded births by 47 in Ballina, 131 in Tweed and one in Kyogle6. Tweed and Byron recorded the two highest population growth rates over the 24 years from 30 June 2001 to 30 June 2025. Tweed grew by 36.6 per cent and Byron by 31.7 per cent. Kyogle's population was 0.3 per cent lower at 30 June 2025 than at 30 June 20011.
| Components of population change by Northern Rivers council area, 2024-25 | ||||||
|---|---|---|---|---|---|---|
| Council area (LGA) | 30 June 2025 | Change | Growth rate % | Natural increase | Net internal migration | Net overseas migration |
| Byron | 38,784 | +697 | 1.83 | +138 | +219 | +340 |
| Ballina | 48,603 | +468 | 0.97 | -47 | +313 | +202 |
| Kyogle | 9,707 | +74 | 0.77 | -1 | +57 | +18 |
| Tweed | 101,044 | +716 | 0.71 | -131 | +427 | +420 |
| Richmond Valley | 24,044 | +76 | 0.32 | +41 | -17 | +52 |
| Lismore | 43,642 | -108 | -0.25 | +66 | -323 | +149 |
Source · ABS Population estimates and components by LGA, 2024 to 2025, Table 1
Section 06 · The state picture
How does Byron Bay compare with other urban areas in New South Wales?
Byron Bay had the fourth-highest growth rate of the 36 urban areas in New South Wales in 2024-25, at 1.59 per cent. This placed it behind Medowie at 3.23 per cent, Morisset - Cooranbong at 2.71 per cent and Camden Haven at 2.43 per cent, and ahead of Sydney at 1.37 per cent. Eight of the 36 urban areas lost population over the year, including Lismore, down 0.56 per cent, and Lithgow, down 0.95 per cent, the largest fall1.
By size, Byron Bay was the smallest of the 36, at 11,482 people. The next smallest were Lithgow at 12,124, Muswellbrook at 12,595 and Mudgee at 12,965. Among the urban areas of the Northern Rivers, Ballina had 48,465 people and Lismore 27,856. Tweed Heads is not listed separately. It forms part of the cross-border Gold Coast - Tweed Heads urban area, listed under Queensland, which had a population of 761,6341.
Byron Shire's population growth rate of 1.83 per cent in 2024-25 ranked 12th among the 128 council areas in New South Wales. Wollondilly had the highest rate at 3.88 per cent. New South Wales grew by 1.18 per cent over the year, and the Rest of New South Wales region outside Greater Sydney grew by 0.86 per cent5.
The state figures are covered in the NSW population article.
| New South Wales urban areas with the ten highest growth rates, 2024-25 | |||
|---|---|---|---|
| Urban area (SUA) | 30 June 2025 | Change | Growth rate % |
| Medowie | 17,178 | +537 | 3.23 |
| Morisset - Cooranbong | 31,333 | +827 | 2.71 |
| Camden Haven | 19,995 | +475 | 2.43 |
| Byron Bay | 11,482 | +180 | 1.59 |
| Sydney | 5,219,674 | +70,670 | 1.37 |
| Newcastle - Maitland | 541,634 | +6,953 | 1.30 |
| Albury - Wodonga | 102,435 | +1,183 | 1.17 |
| Mudgee | 12,965 | +149 | 1.16 |
| Wollongong | 322,343 | +3,642 | 1.14 |
| Port Macquarie | 53,369 | +600 | 1.14 |
Source · ABS Population estimates by LGA, Significant Urban Area, Remoteness Area and electoral division, 2001 to 2025, Table 2
Section 07 · The long run
How have the Byron Bay and Byron Shire populations changed since 2001?
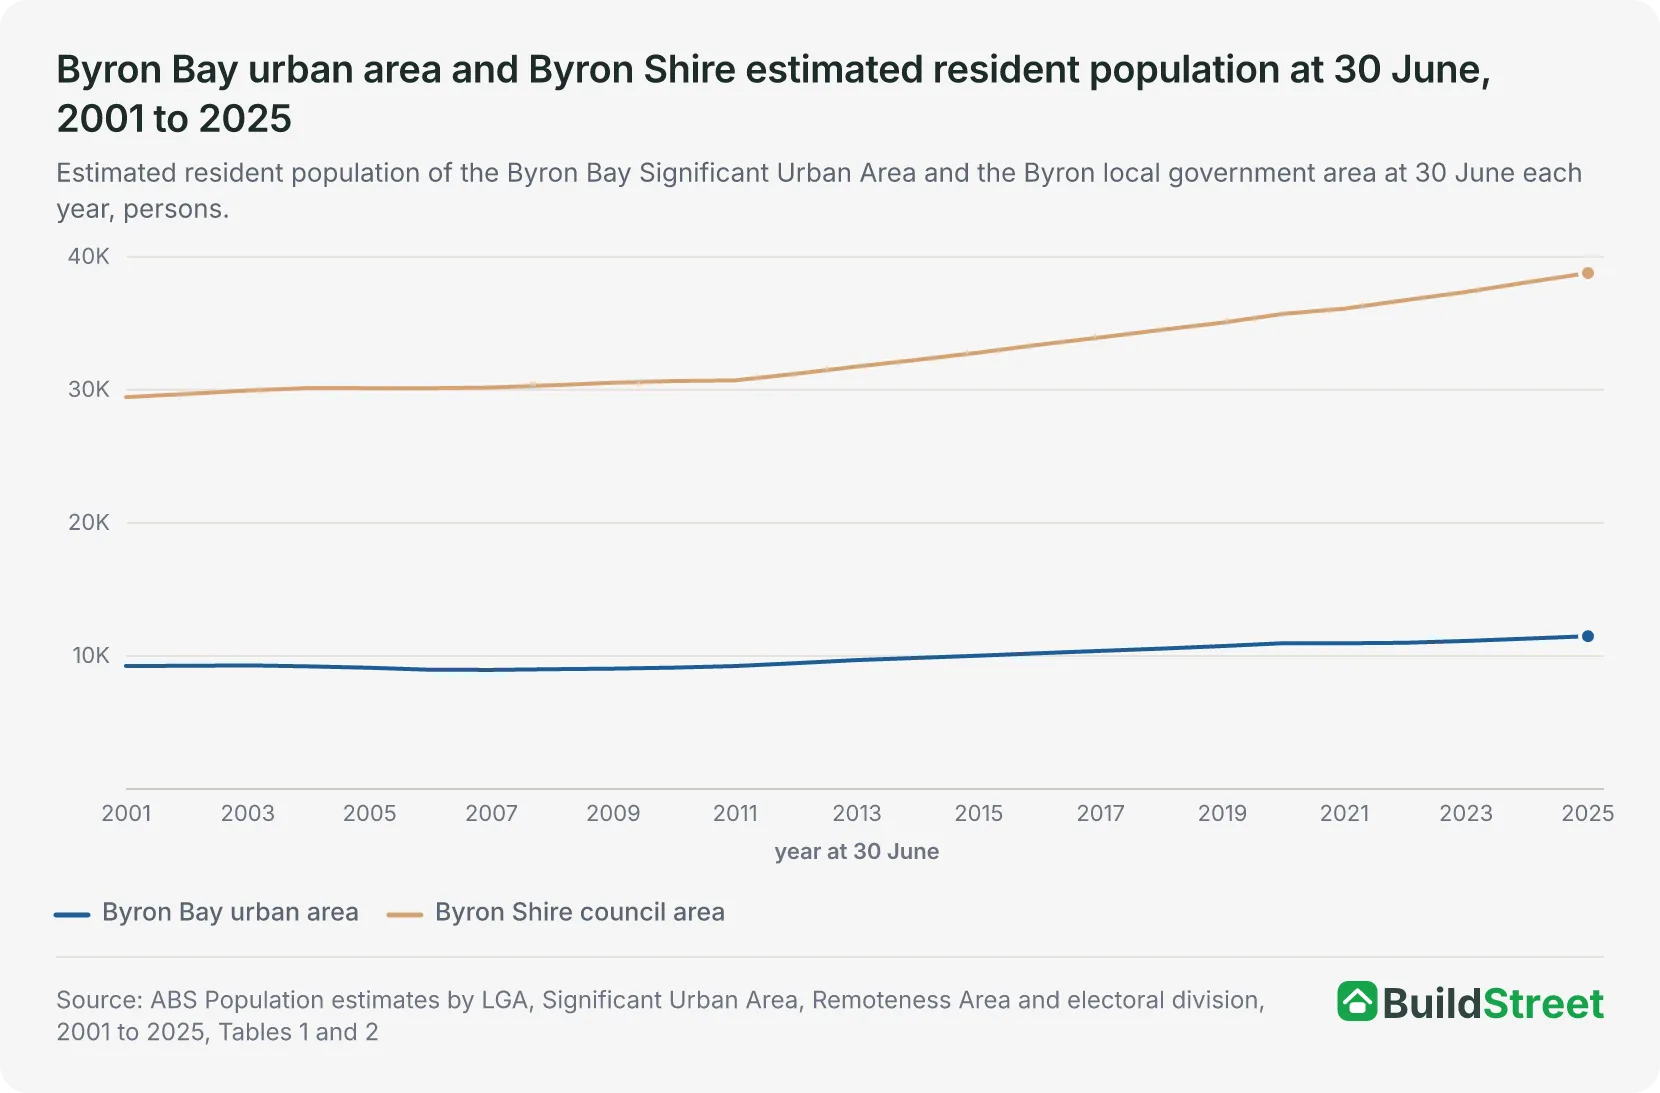
The Byron Bay urban area added 2,235 people between 30 June 2001 and 30 June 2025, growing from 9,247 to 11,482, an increase of 24.2 per cent. Byron Shire grew from 29,453 to 38,784 over the same 24 years, an increase of 9,331 people, or 31.7 per cent1.
The town's population fell from 9,288 at 30 June 2003 to 8,949 at 30 June 2007. It then increased in every year to 10,956 at 30 June 2020 before falling by five people in 2020-21. Over the next four years, it added 531 people to reach 11,482 at 30 June 20251.
The shire's population increased by 33 people between 30 June 2004 and 30 June 2007, from 30,141 to 30,174. It then increased in every year from 2007-08 to 2024-251.
Byron Bay's population first reached 10,000 at 30 June 2015, when it was 10,018, and 11,000 at 30 June 2023, when it was 11,126. The shire first passed 30,000 at 30 June 2004, when it was 30,141, and 35,000 at 30 June 2019, when it was 35,0541. Each milestone marks the first 30 June when the annual population estimate reached or exceeded the threshold.
| Byron Bay and Byron Shire population milestones in the annual series | |||
|---|---|---|---|
| Area | Milestone | First 30 June at or above | Population that year |
| Byron Bay urban area | 10,000 | 30 June 2015 | 10,018 |
| Byron Bay urban area | 11,000 | 30 June 2023 | 11,126 |
| Byron Shire council area | 30,000 | 30 June 2004 | 30,141 |
| Byron Shire council area | 35,000 | 30 June 2019 | 35,054 |
Source · ABS Population estimates by LGA, Significant Urban Area, Remoteness Area and electoral division, 2001 to 2025, Tables 1 and 2
Section 08
Byron Bay population: quick answers
How many people live in Byron Bay?
The Byron Bay Significant Urban Area had an estimated resident population of 11,482 at 30 June 2025. The surrounding Byron Shire council area had 38,784 people on the same date. Both figures count usual residents, not visitors. The 30 June 2025 estimates are preliminary, and the next release, covering 30 June 2026, is due on 25 March 2027.
What is the difference between Byron Bay and Byron Shire in the population figures?
The two names refer to different ABS boundaries. Byron Bay is a Significant Urban Area of 39.8 square kilometres covering the town, with 11,482 people at 30 June 2025. Byron Shire is the Byron local government area, a council boundary of 565.8 square kilometres that also covers Mullumbimby, Brunswick Heads, Ocean Shores and Bangalow, with 38,784 people on the same date. Figures for the two boundaries are not interchangeable.
Is Byron Bay's population growing?
Yes. The Byron Bay urban area added 180 people, or 1.59 per cent, over the 2024-25 financial year, and Byron Shire added 697, or 1.83 per cent. The town's population fell in each of the four years from 2003-04 to 2006-07 and by five people in 2020-21, and increased in every other year of the series from 2007-08.
Are people moving to Byron Bay from other parts of Australia?
Yes, but more people left the Byron Bay local area for elsewhere in Australia than arrived from elsewhere in the country in each of the four years from 2021-22 to 2024-25. In 2024-25, 924 people arrived and 944 departed, and the four-year net loss was 391 people. Net overseas migration added 845 people to the same area over the same years. Byron Shire as a whole gained 219 people from internal moves in 2024-25 and 340 from overseas migration.
Does the Byron Bay population figure include tourists?
No. The estimated resident population counts people at their usual address. It includes usual residents who are overseas for less than 12 months over a 16-month period and excludes overseas visitors who are in Australia for less than 12 months over the same period. People whose usual address is elsewhere in Australia are counted there. The ABS Regional population release does not report visitor numbers or short-stay accommodation.
How does Byron Shire compare with Ballina, Tweed and Lismore?
Byron Shire had the highest 2024-25 growth rate of the six Northern Rivers council areas, at 1.83 per cent. Ballina grew by 0.97 per cent and Tweed by 0.71 per cent, and Lismore's population fell by 0.25 per cent. Tweed, with 101,044 people at 30 June 2025, had the largest increase of the six, at 716 people, compared with Byron Shire's 697.
Section 09
Australia population statistics
References
- ABS Regional population, 2024-25: population estimates by LGA and Significant Urban Area, 2001 to 2025 (datacube 32180DS0004) · Australian Bureau of Statistics ↑ b c d e f g h i j k l m
- ABS Regional population methodology, 2024-25 · Australian Bureau of Statistics ↑ b c
- ABS Regional population, 2024-25 · Australian Bureau of Statistics ↑
- ABS Regional population, 2024-25: population estimates by SA2 and above, 2001 to 2025 (datacube 32180DS0003) · Australian Bureau of Statistics ↑
- ABS Regional population, 2024-25: population estimates and components by LGA, 2024 to 2025 (datacube 32180DS0002) · Australian Bureau of Statistics ↑ b c d e
- ABS Regional population, 2024-25: population components by LGA, 2021-22 to 2024-25 (datacube 32180DS0006) · Australian Bureau of Statistics ↑ b c
- ABS Regional population, 2024-25: population components by SA2 and above, 2021-22 to 2024-25 (datacube 32180DS0005) · Australian Bureau of Statistics ↑
- ABS Regional population, 2024-25: population estimates and components by SA2, 2024 to 2025 (datacube 32180DS0001) · Australian Bureau of Statistics ↑ b c
