

Published 31 Aug 2026 · Updated 18 Sept 2026
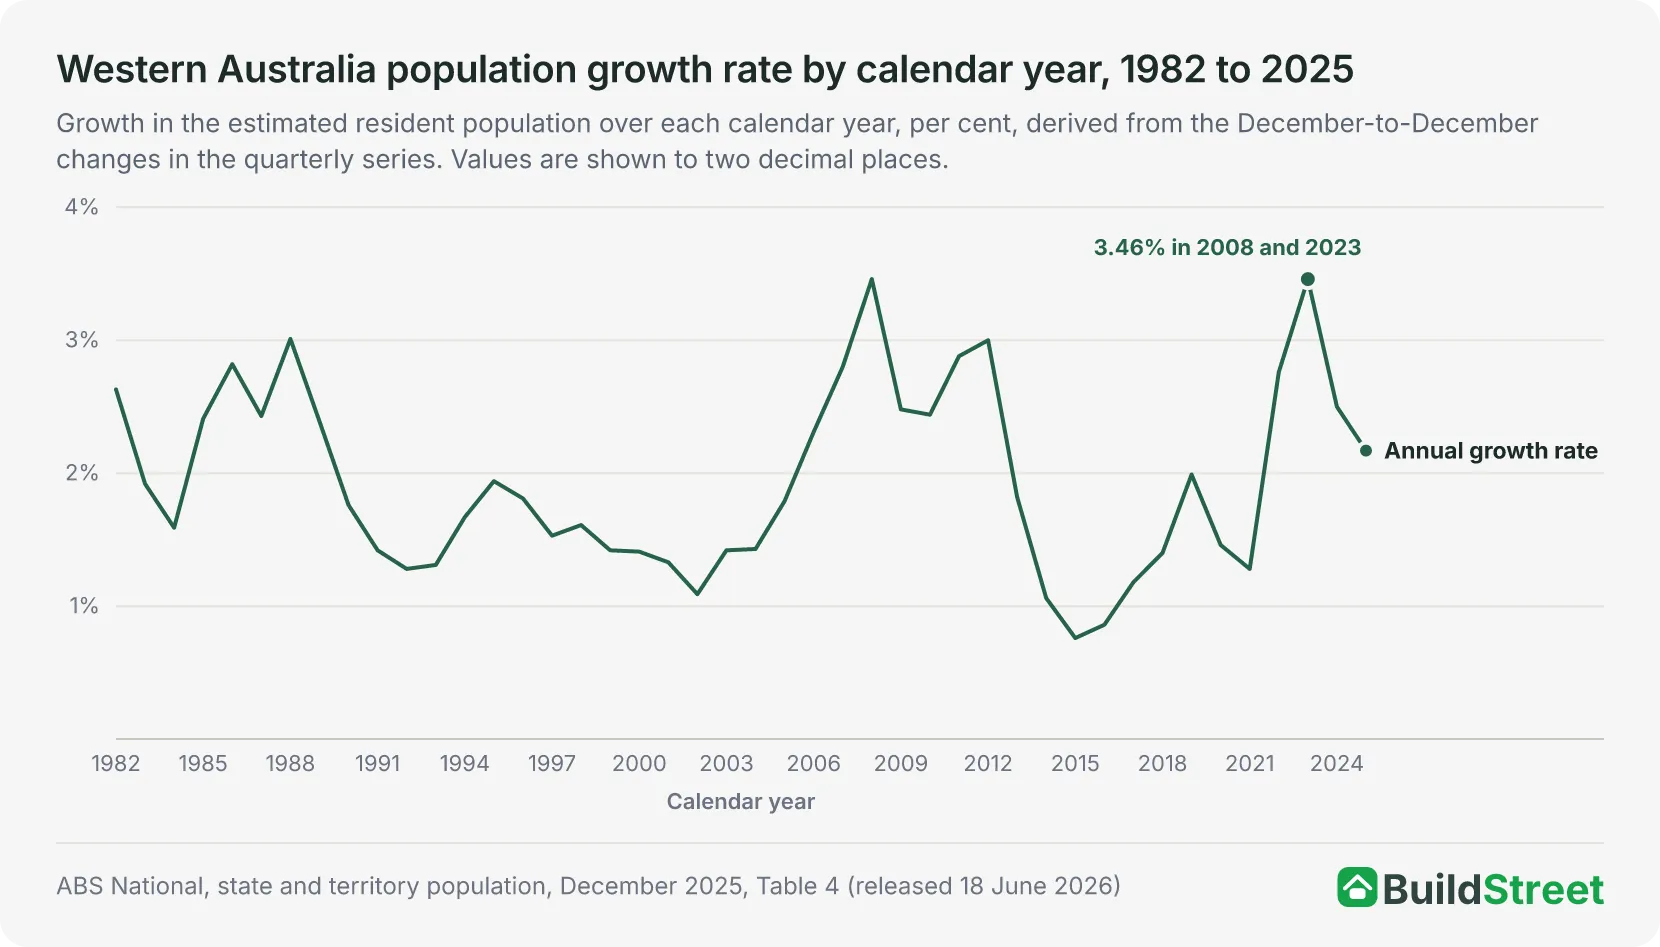 The state around the cityGreater Perth held just over four in five of the people in Western Australia's two broad regions at 30 June 2025, the highest capital share of the six states. The state page covers Western Australia's total, its growth and its components of change.
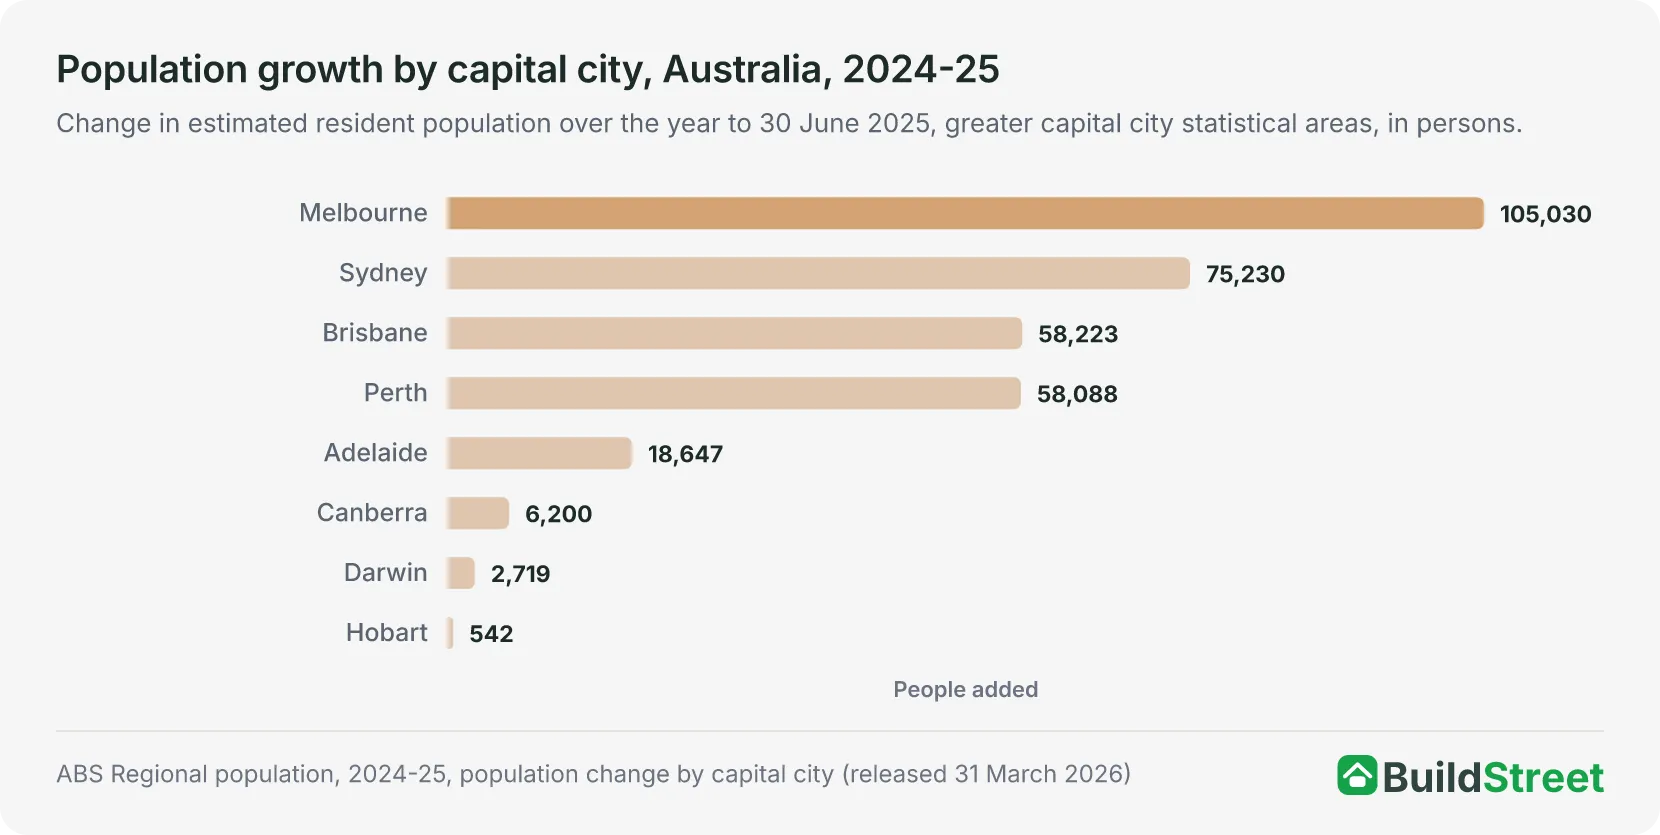 How other cities comparePerth had the fastest growth rate of the capitals in 2024-25, while Melbourne added the most people. The cities article ranks growth across Australia's capitals and regional centres.
Section 01 · The headline number
How many people live in Perth?
Greater Perth had an estimated resident population of 2,452,765 at 30 June 20251. That was the fourth-largest population of the eight capital cities, 380,759 fewer than Greater Brisbane's 2,833,524 and 961,750 more than Greater Adelaide's 1,491,015.
About one in eleven people in Australia lived in the city, equivalent to an 8.9 per cent share of the national population of 27,613,6542.
The ABS updates the city estimate once a year, at 30 June, and the 2025 figures are preliminary and subject to revision. The next release, covering 30 June 2026, is due on 25 March 20271.
Section 02 · The pace
How fast is Perth's population growing?
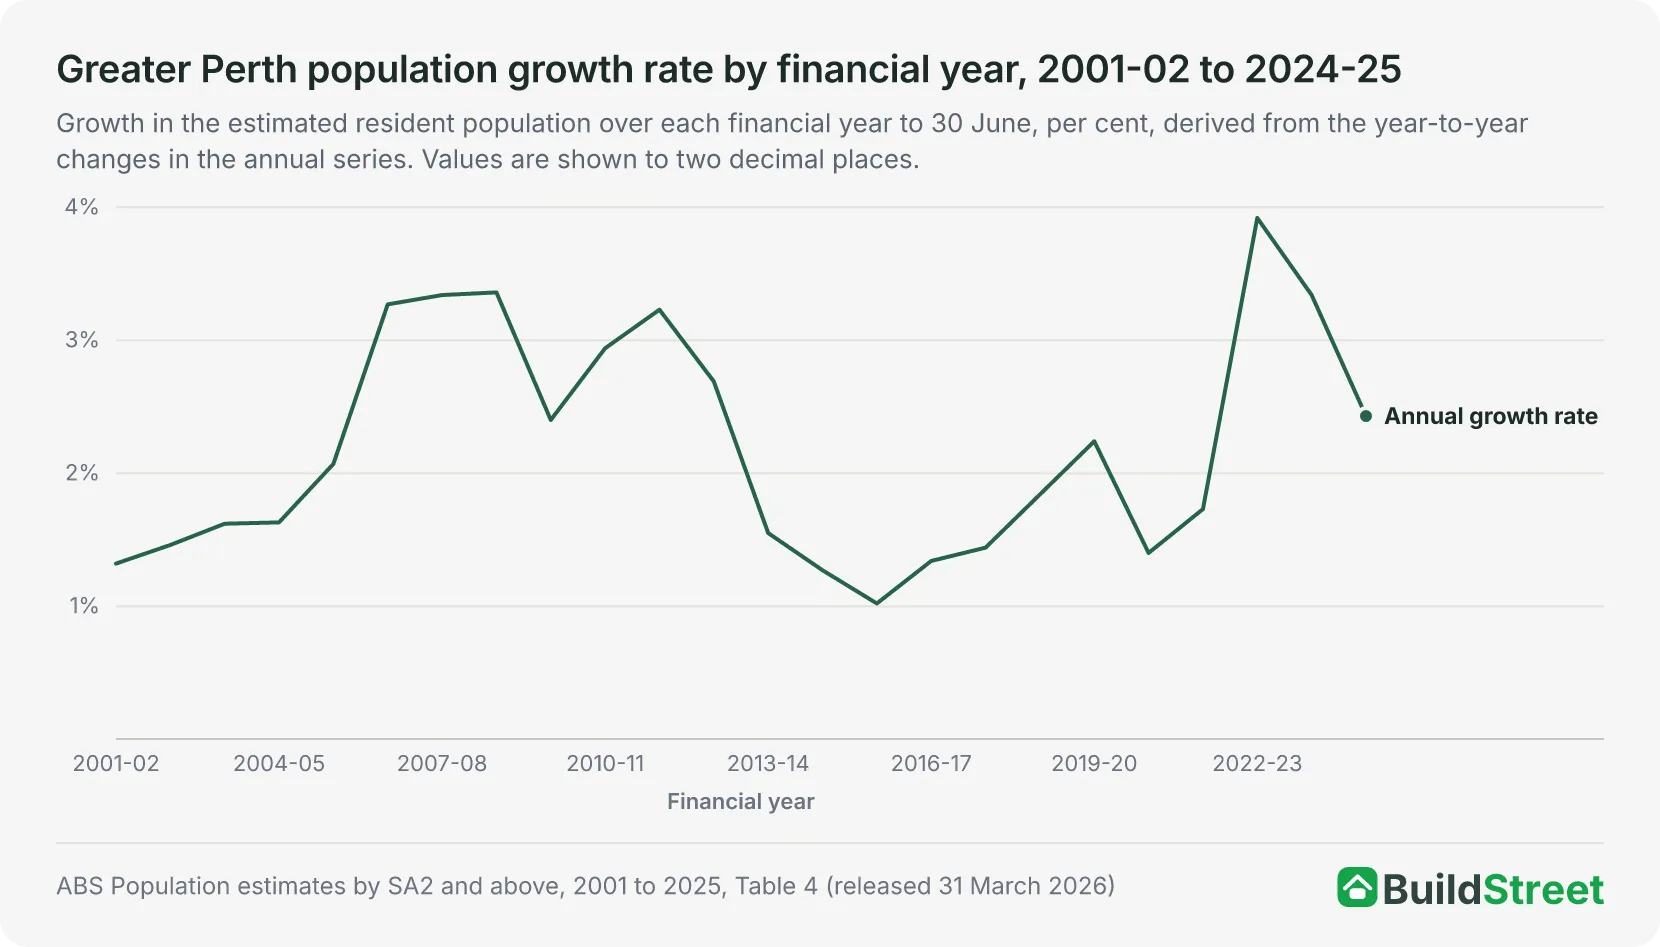
Greater Perth added 58,088 people, or 2.43 per cent, over the 2024-25 financial year. The ABS capital city data rounds the growth rate to 2.4 per cent, the highest of the eight capitals, ahead of Brisbane's 2.1 per cent. The increase was the fourth largest of the capitals, behind Melbourne's 105,030, Sydney's 75,230 and Brisbane's 58,2231. It was also the city's smallest increase in three years, after 87,475 (3.92 per cent) in 2022-23 and 77,409 (3.34 per cent) in 2023-242.
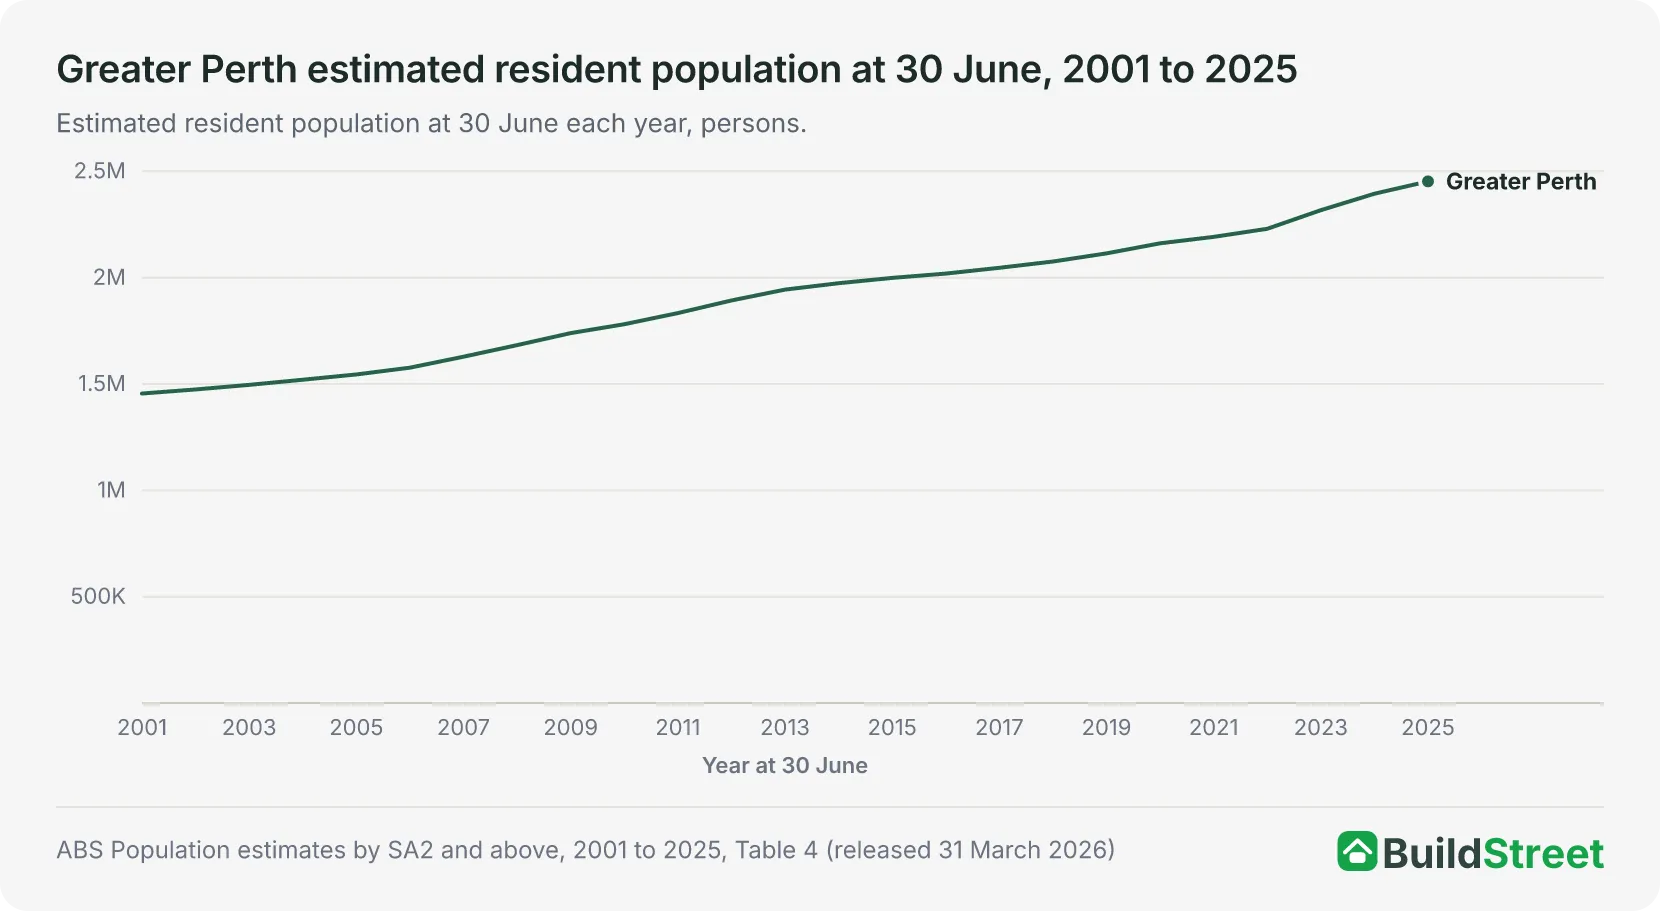
Growth across the 24 financial years from 2001-02 to 2024-25 ranged from 1.02 to 3.92 per cent, and every year's change was positive. The fastest year was 2022-23, when the city added 87,475 people (3.92 per cent), the largest increase and the highest rate over the period. The lowest rate came in 2015-16, when the city added 20,326 people (1.02 per cent), and the smallest increase came in 2001-02, at 19,175 people (1.32 per cent). In 2020-21, when Greater Sydney and Greater Melbourne lost 33,728 and 85,788 people respectively, Greater Perth added 30,277 people (1.40 per cent)2.
The annual growth rate exceeded 2.9 per cent in every year from 2006-07 to 2011-12 except 2009-10. The rate then fell in each year from 2012-13 to 2015-16, reaching its lowest point, and rose in each year from 2016-17 to 2019-20. Growth slowed in each of the two years after the 2022-23 peak.2
Section 03 · The drivers
What drives Perth's population growth?
Three components make up the city's population change, and all three added people in 2024-25. Net overseas migration added 37,289 people to Greater Perth, natural increase (births minus deaths) added 12,588, and net internal migration (moves to and from elsewhere in Australia) added 8,211. Together, they accounted for the full 58,088-person increase. Perth's net overseas migration gain was the third largest of the eight capitals, behind Melbourne's 81,168 and Sydney's 78,4031.
Perth and Brisbane were the only capitals with net internal migration gains in 2024-25. Perth's gain of 8,211 was the smaller of the two, behind Brisbane's 11,077; every other capital recorded a net loss, ranging from 33,282 in Sydney to 1,430 in Darwin1.
The city gained people from all three components in each financial year from 2021-22 to 2024-25. Net overseas migration rose from 13,818 in 2021-22 to a peak of 61,589 in 2022-23, then fell to 54,576 in 2023-24 and 37,289 in 2024-25. Net internal migration rose from 10,247 in 2021-22 to 14,402 in 2022-23, before falling to 11,517 in 2023-24 and 8,211 in 2024-25.3
In 2021-22, natural increase, at 13,890, was the largest of the three components, 72 more than net overseas migration's 13,818. It was the only year in this period in which overseas migration was not the largest component3.
State-to-state flows across all eight states and territories are covered in the interstate migration article.
| Components of Greater Perth population change, 2024-25 | ||
|---|---|---|
| Component | People | Derivation |
| Net overseas migration | +37,289 | 63,616 arrivals minus 26,327 departures |
| Natural increase | +12,588 | 26,465 births minus 13,877 deaths |
| Net internal migration | +8,211 | 42,711 arrivals minus 34,500 departures |
| Total growth | +58,088 | Derived sum; the release's commentary rounds it to 58,100 |
Source · ABS Population components by SA2 and above, 2021-22 to 2024-25, Table 4
Section 04 · The growth areas
Where in Perth is the population growing fastest?
Perth's fastest-growing areas in 2024-25 were on its outer edges. The ABS identified Alkimos - Eglinton (up 2,500 people) in Perth's outer north-west, Brabham - Henley Brook (1,800) in the outer north-east and Baldivis - North (1,700) in the outer south as the Western Australian areas with the largest growth. The same three areas also had the highest growth rates, at 13, 12 and 11 per cent respectively. Alkimos - Eglinton grew from 19,957 to 22,493 people over the year, Brabham - Henley Brook from 15,913 to 17,755 and Baldivis - North from 15,749 to 17,4604.
Alkimos - Eglinton's 2,536-person increase was the largest of any area in Western Australia, and its published growth rate of 12.7 per cent was also the state's highest. The area also recorded the state's largest net internal migration gain, at 1,902 people. Byford, in Perth's outer south-east, had the state's largest natural increase, at 403, and Bentley - Wilson - St James, south-east of the city centre, recorded the largest net overseas migration gain, at 1,0544.
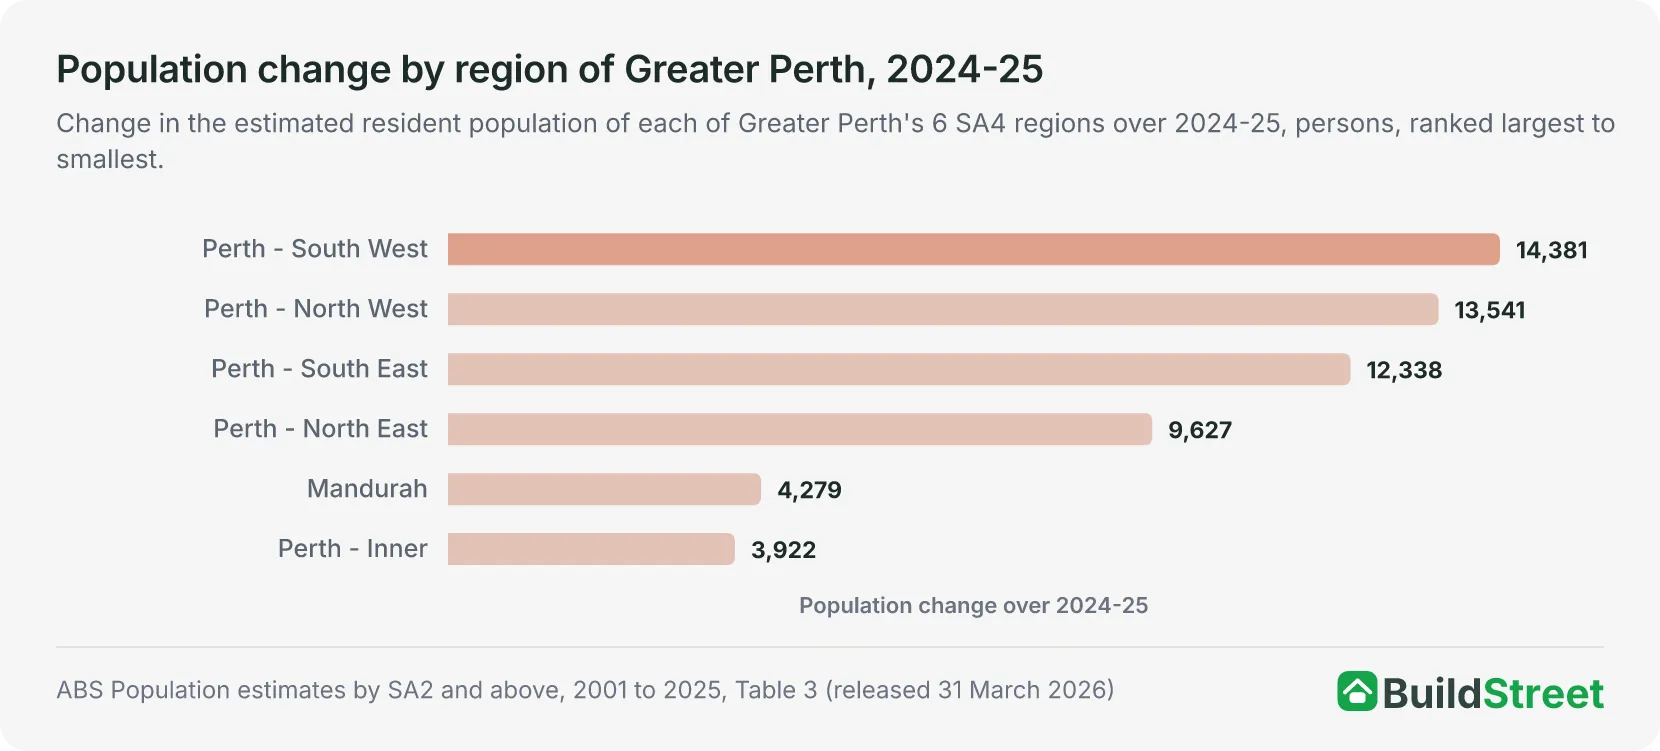
Every broad region of Greater Perth grew over 2024-25. Perth - South West added 14,381 people and Perth - North West added 13,541, the two largest increases among Greater Perth's six broad regions.
Perth - Inner recorded the smallest increase at 3,922, while Mandurah had the highest growth rate at 3.47 per cent2. The centre of population for Greater Perth was in the suburb of Como, near the banks of the Swan River, at June 2025 and moved marginally over the year, reflecting similar growth in Perth's north and south.1
| The fastest growing areas of Perth, 2024-25 | |||||
|---|---|---|---|---|---|
| Area (SA2) | Region (SA4) | 30 June 2024 | 30 June 2025 | Change | Growth rate % |
| Alkimos - Eglinton | Perth - North West | 19,957 | 22,493 | +2,536 | 12.7 |
| Brabham - Henley Brook | Perth - North East | 15,913 | 17,755 | +1,842 | 11.6 |
| Baldivis - North | Perth - South West | 15,749 | 17,460 | +1,711 | 10.9 |
Source · ABS Population estimates and components by SA2, 2024 to 2025, Table 5
Section 05 · The state share
How much of Western Australia's population lives in Perth?
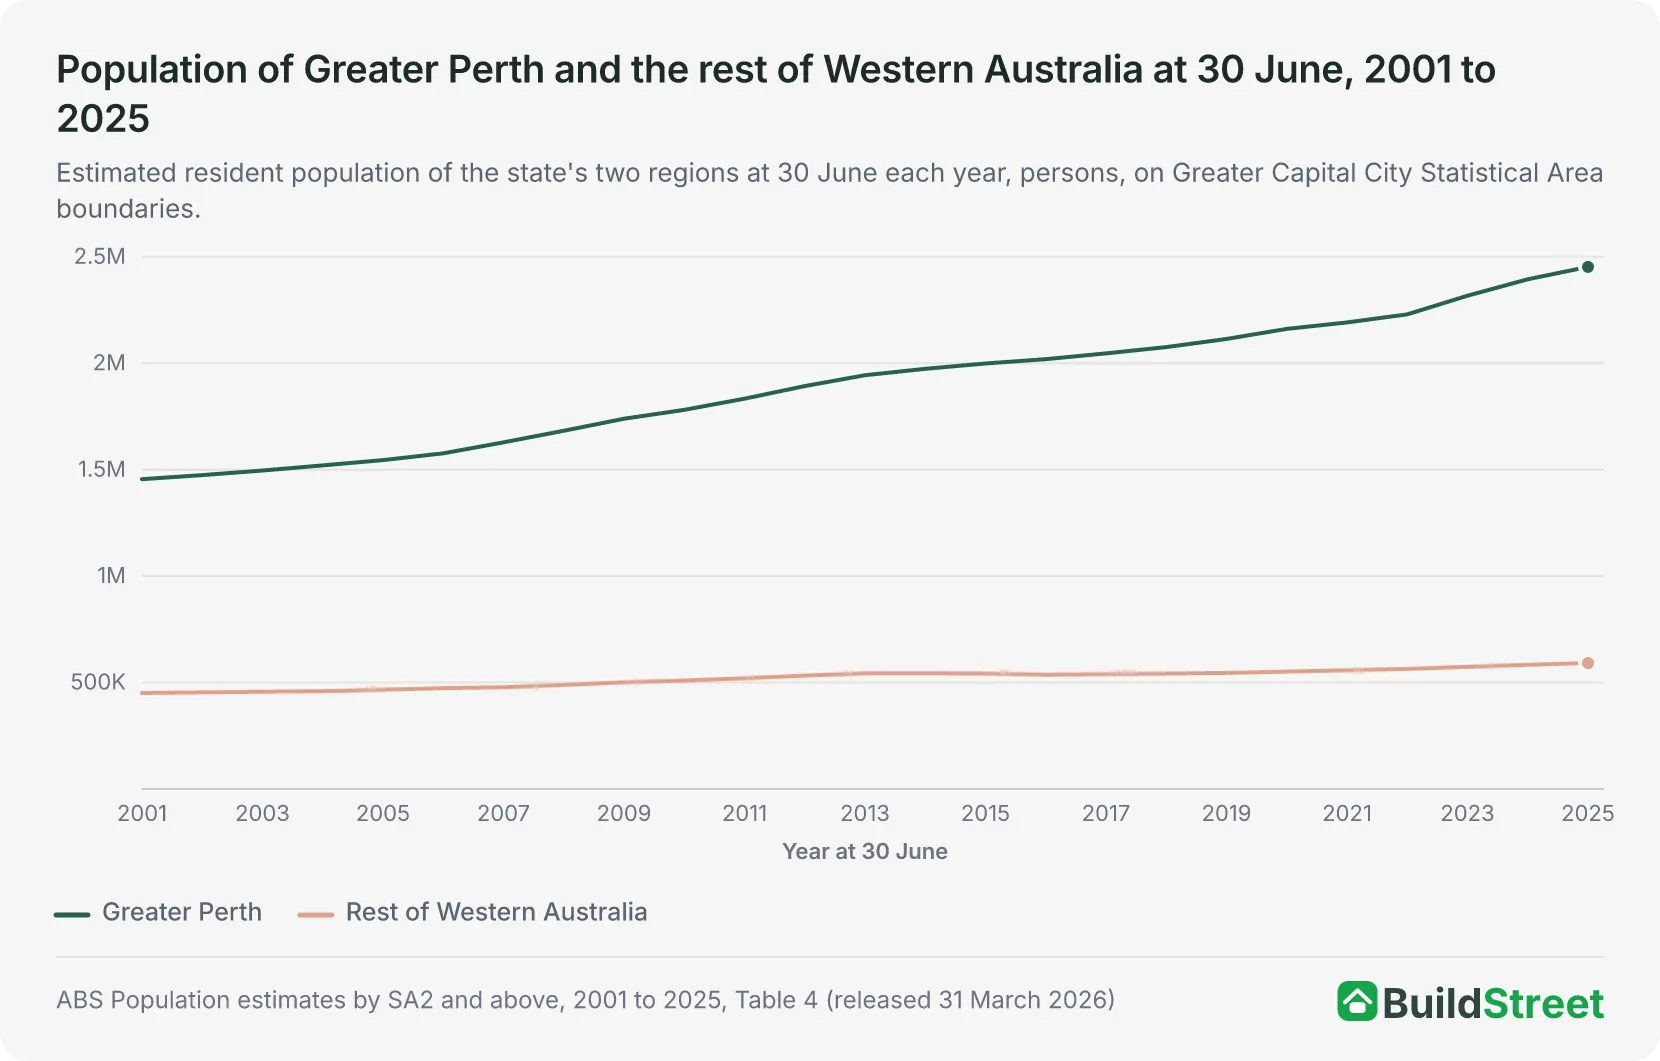
Just over four in five people in Western Australia's two broad regions lived in Greater Perth at 30 June 2025. Greater Perth had 2,452,765 residents while the rest of Western Australia had 591,617, giving the capital an 80.57 per cent share of the 3,044,382 total across the two regions2. That was the highest share among the six state capitals. Adelaide had 78.36 per cent of its state's two-region total, Melbourne 76.84, Sydney 65.62, Brisbane 49.98 and Hobart 44.29.
The capital's share rose from 76.35 per cent at 30 June 2001 to 80.57 per cent at 30 June 2025. The rest of Western Australia's population fell by 1,950 over 2014-15 and 5,020 over 2015-16, the only declines recorded across the state's two broad regions over the period. Greater Perth grew in every year. In 2024-25, the rest of the state added 8,147 people (1.40 per cent), which the ABS rounds to 8,100 people (1.4 per cent)1.
Section 06 · The other capitals
How does Perth compare with Australia's other capital cities?
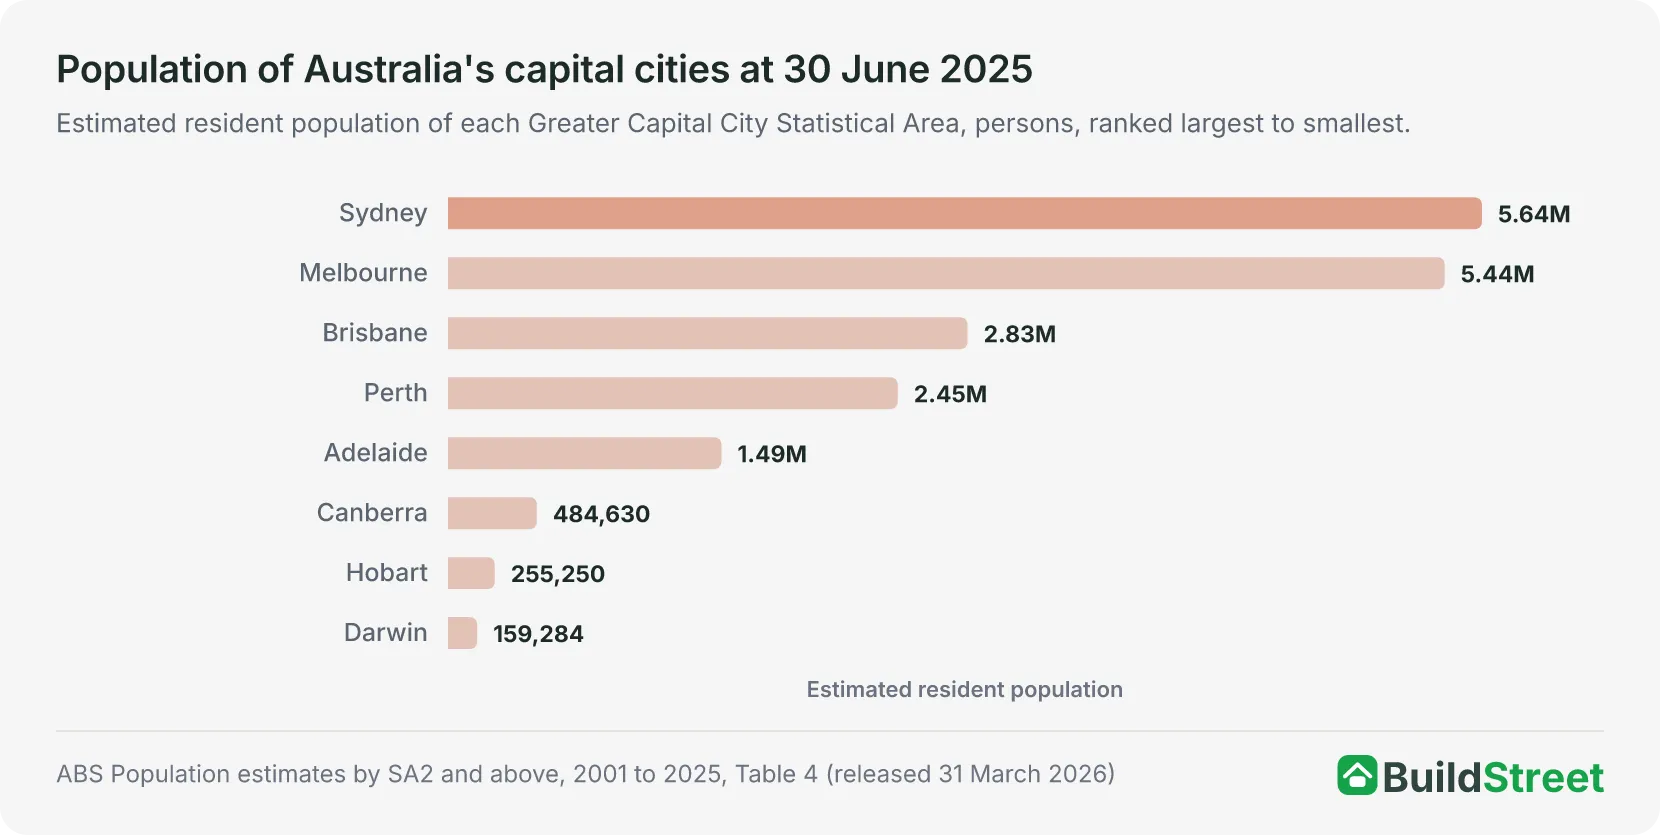
Greater Perth was the fourth largest of the eight capital cities by population at 30 June 2025, with 2,452,765 people, behind Sydney's 5,638,830, Melbourne's 5,435,590 and Brisbane's 2,833,524. Adelaide, the fifth largest at 1,491,015, was 961,750 behind Perth, and Sydney's population was 2.30 times Perth's1.
In 2024-25, Perth had the fastest population growth rate of the eight capitals, at 2.4 per cent, followed by Brisbane at 2.1 per cent and Melbourne at 2.0 per cent. By population increase, Melbourne ranked first with 105,030 people, followed by Sydney with 75,230, Brisbane with 58,223 and Perth with 58,0881.
Brisbane's increase exceeded Perth's by 135 people, and the growth rates were 2.10 per cent and 2.43 per cent respectively1.
The eight capitals together had 18,750,888 people at 30 June 2025, after growing by 324,679 (1.8 per cent) over the year. Perth accounted for 13.1 per cent of the combined capital population1.
Brisbane's population trends are covered in the Brisbane population article.
| Population of Australia's capital cities, as at 30 June 2025 | |||
|---|---|---|---|
| Capital city | Population | Change over 2024-25 | Growth rate % |
| Sydney | 5,638,830 | +75,230 | 1.35 |
| Melbourne | 5,435,590 | +105,030 | 1.97 |
| Brisbane | 2,833,524 | +58,223 | 2.10 |
| Perth | 2,452,765 | +58,088 | 2.43 |
| Adelaide | 1,491,015 | +18,647 | 1.27 |
| Canberra | 484,630 | +6,200 | 1.30 |
| Hobart | 255,250 | +542 | 0.21 |
| Darwin | 159,284 | +2,719 | 1.74 |
| All capital cities | 18,750,888 | +324,679 | 1.76 |
Source · ABS Population estimates by SA2 and above, 2001 to 2025, Table 4
Section 07 · The long run
How has Perth's population changed since 2001?
The city added 997,404 people between 30 June 2001 and 30 June 2025, growing from 1,455,361 to 2,452,765. Its 2025 population was 1.69 times its 2001 size, the highest ratio of the eight capitals, ahead of Brisbane's 1.67 and Melbourne's 1.55. By population increase, Perth ranked fourth, behind Melbourne's 1,935,341, Sydney's 1,536,250 and Brisbane's 1,139,9682.
Greater Perth first passed 1.5 million at 30 June 2004, 2 million at 30 June 2016 and 2.25 million at 30 June 20232. It took 12 years to grow from 1.5 million to 2 million, and seven years to reach 2.25 million.
Perth recorded no population decline from 2001 to 2025, while Sydney and Melbourne each recorded one decline, in 2020-21. Perth's smallest increase came in 2001-02, at 19,175 people, and its largest in 2022-23, at 87,475 (3.92 per cent). The annual increase then fell to 77,409 in 2023-24 and 58,088 in 2024-252.
| Greater Perth population milestones, 2001 to 2025 | ||
|---|---|---|
| Milestone | First 30 June at or above | Population that year |
| 1.5 million | 30 June 2004 | 1,520,232 |
| 1.75 million | 30 June 2010 | 1,781,132 |
| 2 million | 30 June 2016 | 2,019,263 |
| 2.25 million | 30 June 2023 | 2,317,268 |
Source · ABS Population estimates by SA2 and above, 2001 to 2025, Table 4
Section 08
Perth population: quick answers
How many people live in Perth?
Greater Perth had an estimated resident population of 2,452,765 at 30 June 2025, the latest estimate in the ABS Regional population release published on 31 March 2026. That was the fourth largest population of Australia's eight capital cities and 8.9 per cent of the national total of 27,613,654 in the same data. The 30 June 2025 estimates are preliminary; the next release, covering 30 June 2026, is due on 25 March 2027.
How fast is Perth's population growing?
Greater Perth added 58,088 people, or 2.43 per cent, over the 2024-25 financial year. The ABS release publishes the rate as 2.4 per cent, the fastest of the eight capital cities, ahead of Brisbane's 2.1 per cent. Growth peaked at 87,475 people (3.92 per cent) in 2022-23, and the population increased in every year from 2001-02 to 2024-25, including 2020-21, when the Sydney and Melbourne populations declined.
Is Perth bigger than Brisbane?
No. Greater Perth had a smaller population than Greater Brisbane at 30 June 2025 on the ABS Greater Capital City Statistical Area boundaries, with 2,452,765 residents to Brisbane's 2,833,524, a gap of 380,759 people. The two cities added almost the same number of people over 2024-25, 58,088 for Perth and 58,223 for Brisbane, while Perth's published growth rate of 2.4 per cent was higher.
Section 09
Australia population statistics
References
- ABS Regional population, 2024-25 · Australian Bureau of Statistics ↑ b c d e f g h i j k
- ABS Regional population, 2024-25: population estimates by SA2 and above, 2001 to 2025 (datacube 32180DS0003) · Australian Bureau of Statistics ↑ b c d e f g h i
- ABS Regional population, 2024-25: population components by SA2 and above, 2021-22 to 2024-25 (datacube 32180DS0005) · Australian Bureau of Statistics ↑ b
- ABS Regional population, 2024-25: population estimates and components by SA2, 2024 to 2025 (datacube 32180DS0001) · Australian Bureau of Statistics ↑ b
- ABS Regional population methodology, 2024-25 · Australian Bureau of Statistics
