

Published 2 Sept 2026 · Updated 15 Sept 2026
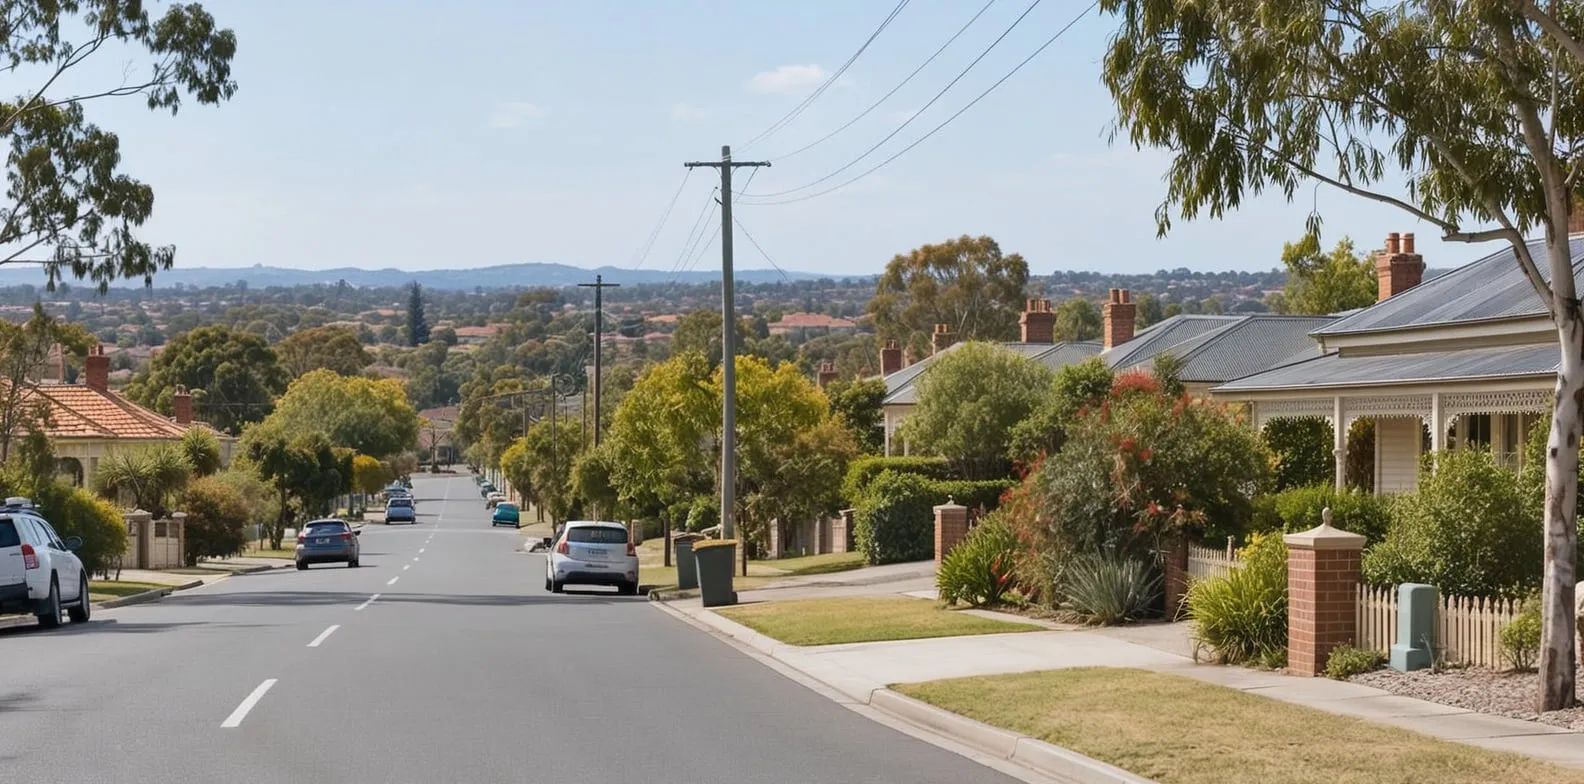 The state pictureVictoria had an estimated resident population of 7,073,859 at 30 June 2025 in the ABS annual series. The state article covers the total, its drivers and the split between Greater Melbourne and the rest of the state.
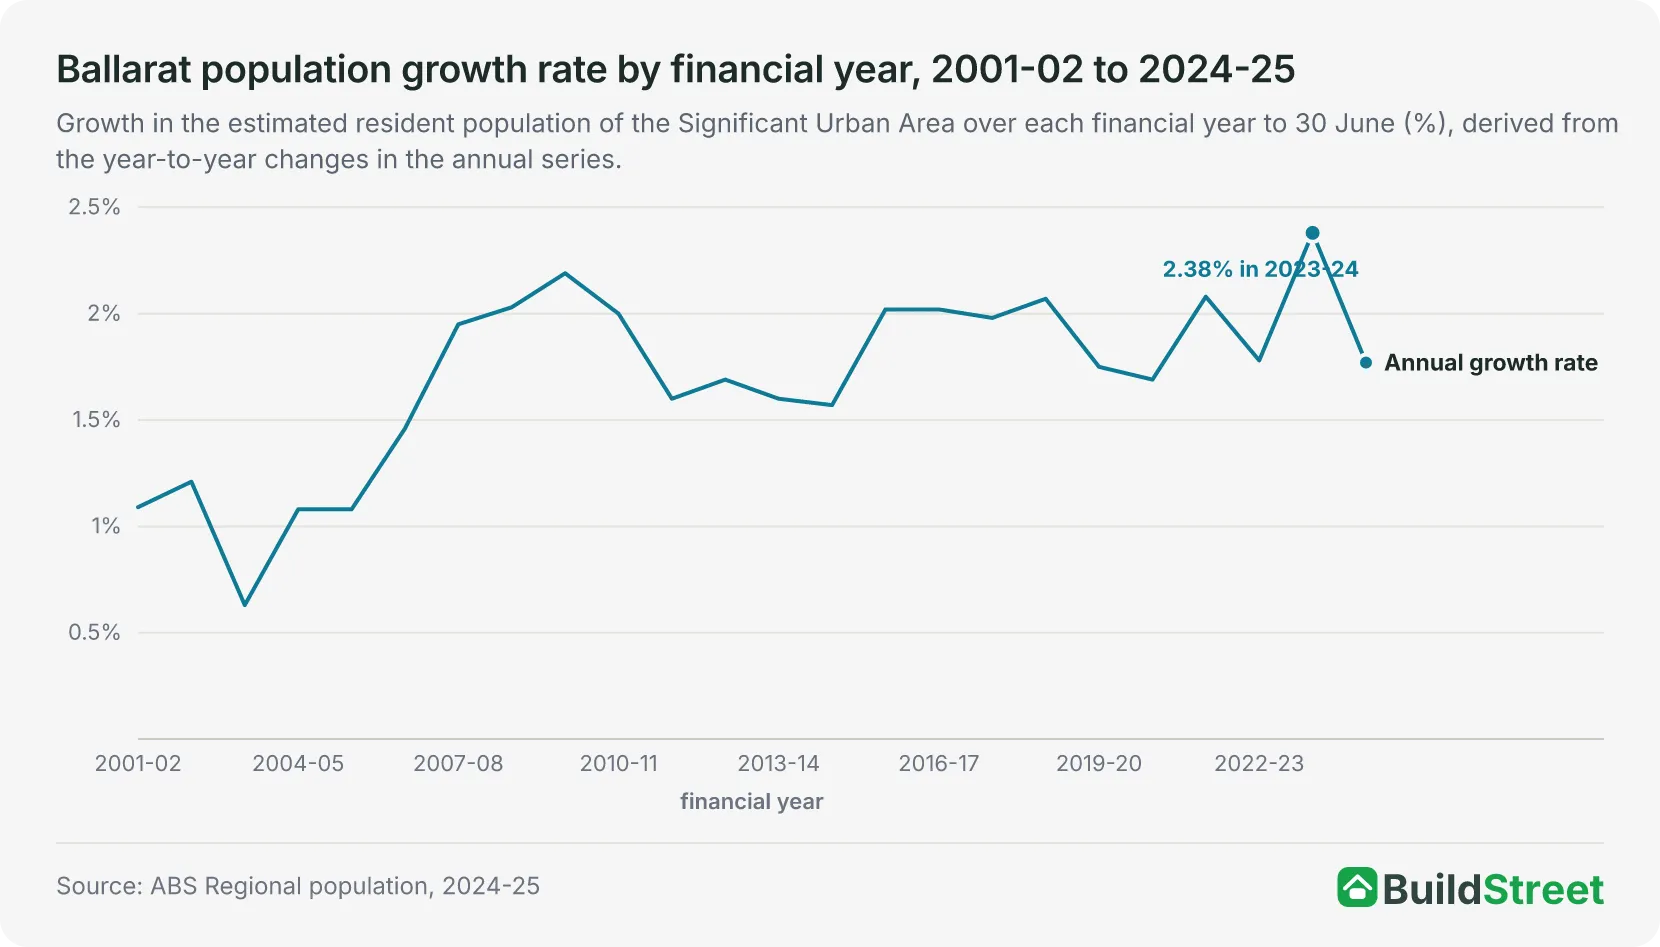 Bendigo and BallaratBallarat was Victoria's third largest urban area at 30 June 2025, with 120,939 people, and was larger than Bendigo in every year of the ABS series from 2001. The Ballarat article covers its population on the same ABS basis.
Section 01 · The headline number
How many people live in Bendigo?
The Bendigo Significant Urban Area had an estimated resident population of 106,493 at 30 June 2025. That was the fourth-largest population of the 21 urban areas in Victoria, behind Melbourne at 5,328,274, Geelong at 314,381 and Ballarat at 120,9391. Bendigo accounted for 1.5 per cent of Victoria's estimated 7,073,859 people, and 0.4 per cent of Australia's 27,613,654 people2.
The ABS publishes population estimates annually for 30 June. In the 2024-25 release, the estimates are final for 2001 to 2021, revised for 2022 to 2024 and preliminary for 20253. The next release, covering 30 June 2026, is due on 25 March 20274.
Section 02 · The pace
How fast is Bendigo's population growing?
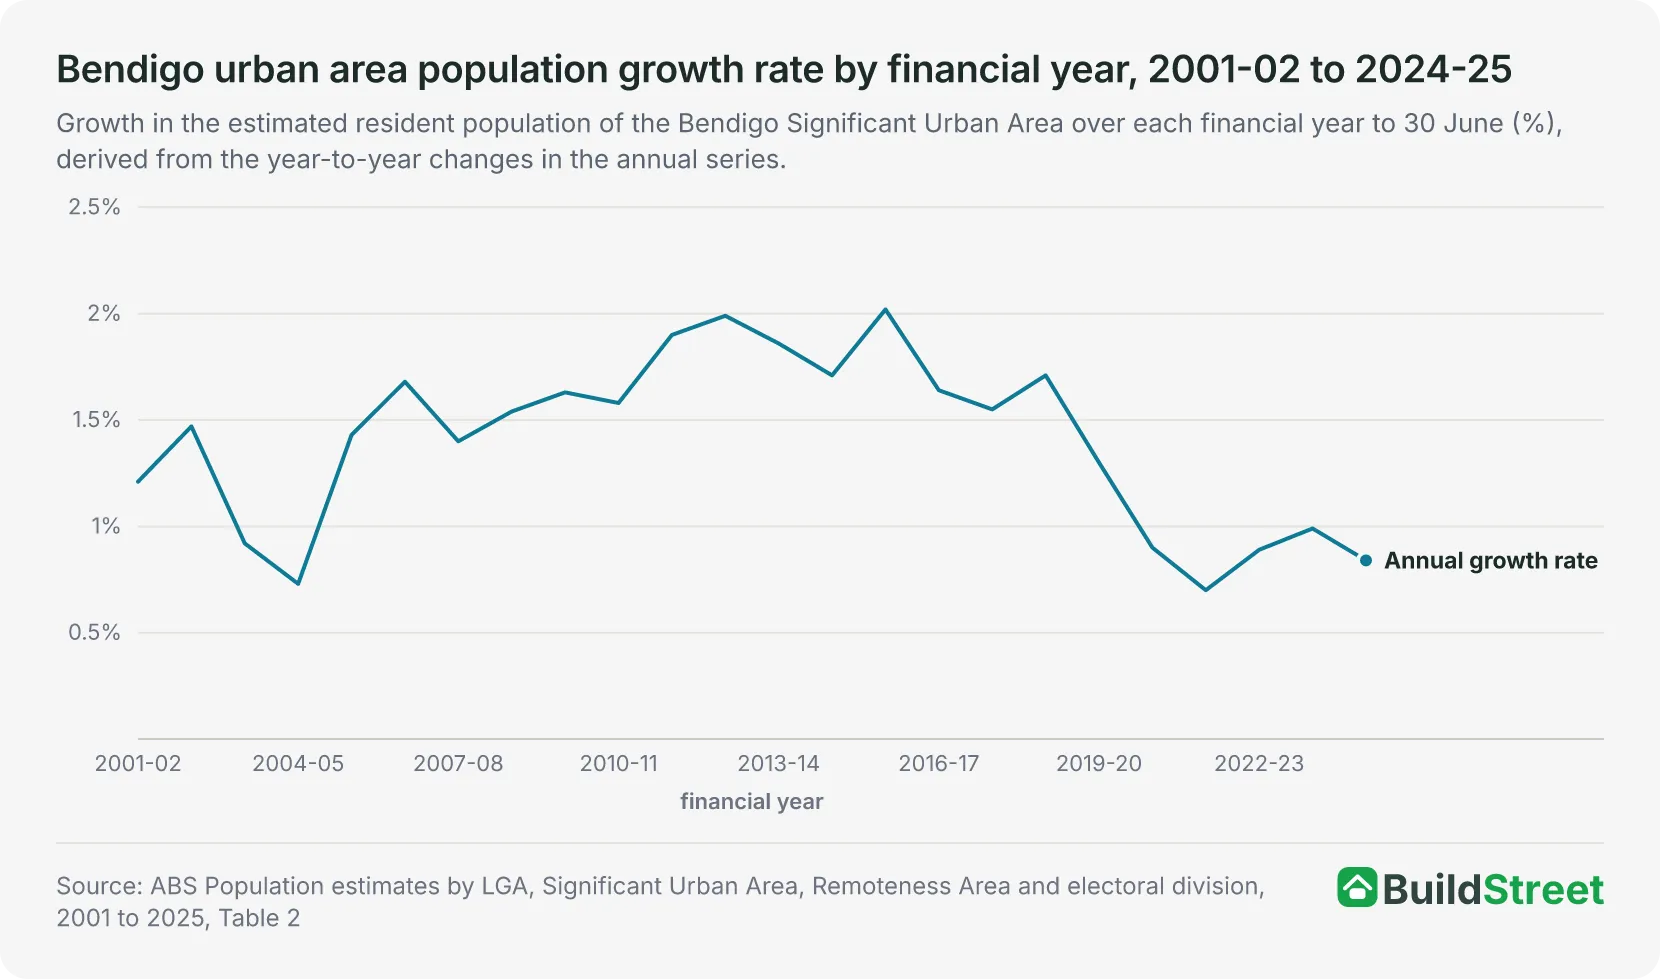
The Bendigo urban area added 883 people, or 0.84 per cent, in 2024-25, growing from 105,610 at 30 June 2024 to 106,493 at 30 June 2025. The increase was smaller than the 1,031 people (0.99 per cent) added in 2023-24. The three years before that recorded gains of 917 people in 2020-21, 719 in 2021-22 and 920 in 2022-231.
Across the 24 financial years from 2001-02 to 2024-25, growth ranged from 0.70 per cent to 2.02 per cent, and the population increased in every year. The fastest growth occurred in 2015-16, when the urban area added 1,899 people (2.02 per cent), both the largest annual increase and the highest growth rate during the period. The lowest growth rate was 0.70 per cent, in 2021-22. The smallest increase was 575 people (0.73 per cent), in 2004-05, and the next smallest was 719 people, in both 2003-04 and 2021-221.
The 2024-25 growth rate was the third lowest during the 24-year period. Growth was above 1.5 per cent in each of the 11 years from 2008-09 to 2018-19. The rate slowed to 1.30 per cent in 2019-20, and was below 1 per cent in each of the five years from 2020-21 to 2024-251.
Victoria's population grew by 1.77 per cent over 2024-25, from 6,950,961 to 7,073,859 people. Greater Melbourne grew by 1.97 per cent while the population outside Greater Melbourne grew by 1.10 per cent2. The Bendigo urban area grew more slowly than the population outside Greater Melbourne.
Section 03 · The drivers
What drives Bendigo's population growth?
Net overseas migration was the largest of the three components of the Bendigo urban area's growth in 2024-25, adding 380 people. Natural increase, births minus deaths, added 377, three fewer. Net internal migration, moves to and from elsewhere in Australia, added 126. Together, the three components accounted for the urban area's increase of 8836. The ABS does not publish population components for urban areas, so these figures were calculated by combining data for the eight smaller areas that make up the Bendigo urban area. Their combined population matches the urban-area estimate in every year from 2001 to 2025.
Net overseas migration was the largest component in each of the four years from 2021-22 to 2024-25. It added 410 people in 2021-22, 682 in 2022-23, 546 in 2023-24 and 380 in 2024-256. Natural increase rose from 266 in 2021-22 to 377 in 2024-25. Net internal migration was the smallest component in every year, and was negative in 2022-23, when 40 more people left the urban area for elsewhere in Australia than arrived.
| Components of population change, Bendigo urban area, 2021-22 to 2024-25 | ||||||
|---|---|---|---|---|---|---|
| Financial year | Births | Deaths | Natural increase | Net internal migration | Net overseas migration | Total change |
| 2021-22 | 1,251 | 985 | +266 | +43 | +410 | +719 |
| 2022-23 | 1,245 | 967 | +278 | -40 | +682 | +920 |
| 2023-24 | 1,258 | 924 | +334 | +151 | +546 | +1,031 |
| 2024-25 | 1,277 | 900 | +377 | +126 | +380 | +883 |
Source · ABS Population components by SA2, 2021-22 to 2024-25, Table 1
The Greater Bendigo council area, which had 126,568 people at 30 June 2025, added 1,275 people over 2024-25. Its three components were closer in size: natural increase added 450 people, net internal migration 423 and net overseas migration 4027. Its net internal migration gain of 423 was measured on the wider council boundary and is not directly comparable with the urban area's 126.
Over the four years from 2021-22 to 2024-25, the council area's annual increase ranged from 1,154 to 1,503 people. Net overseas migration was its largest component in each of the first three years, and natural increase was the largest in 2024-258.
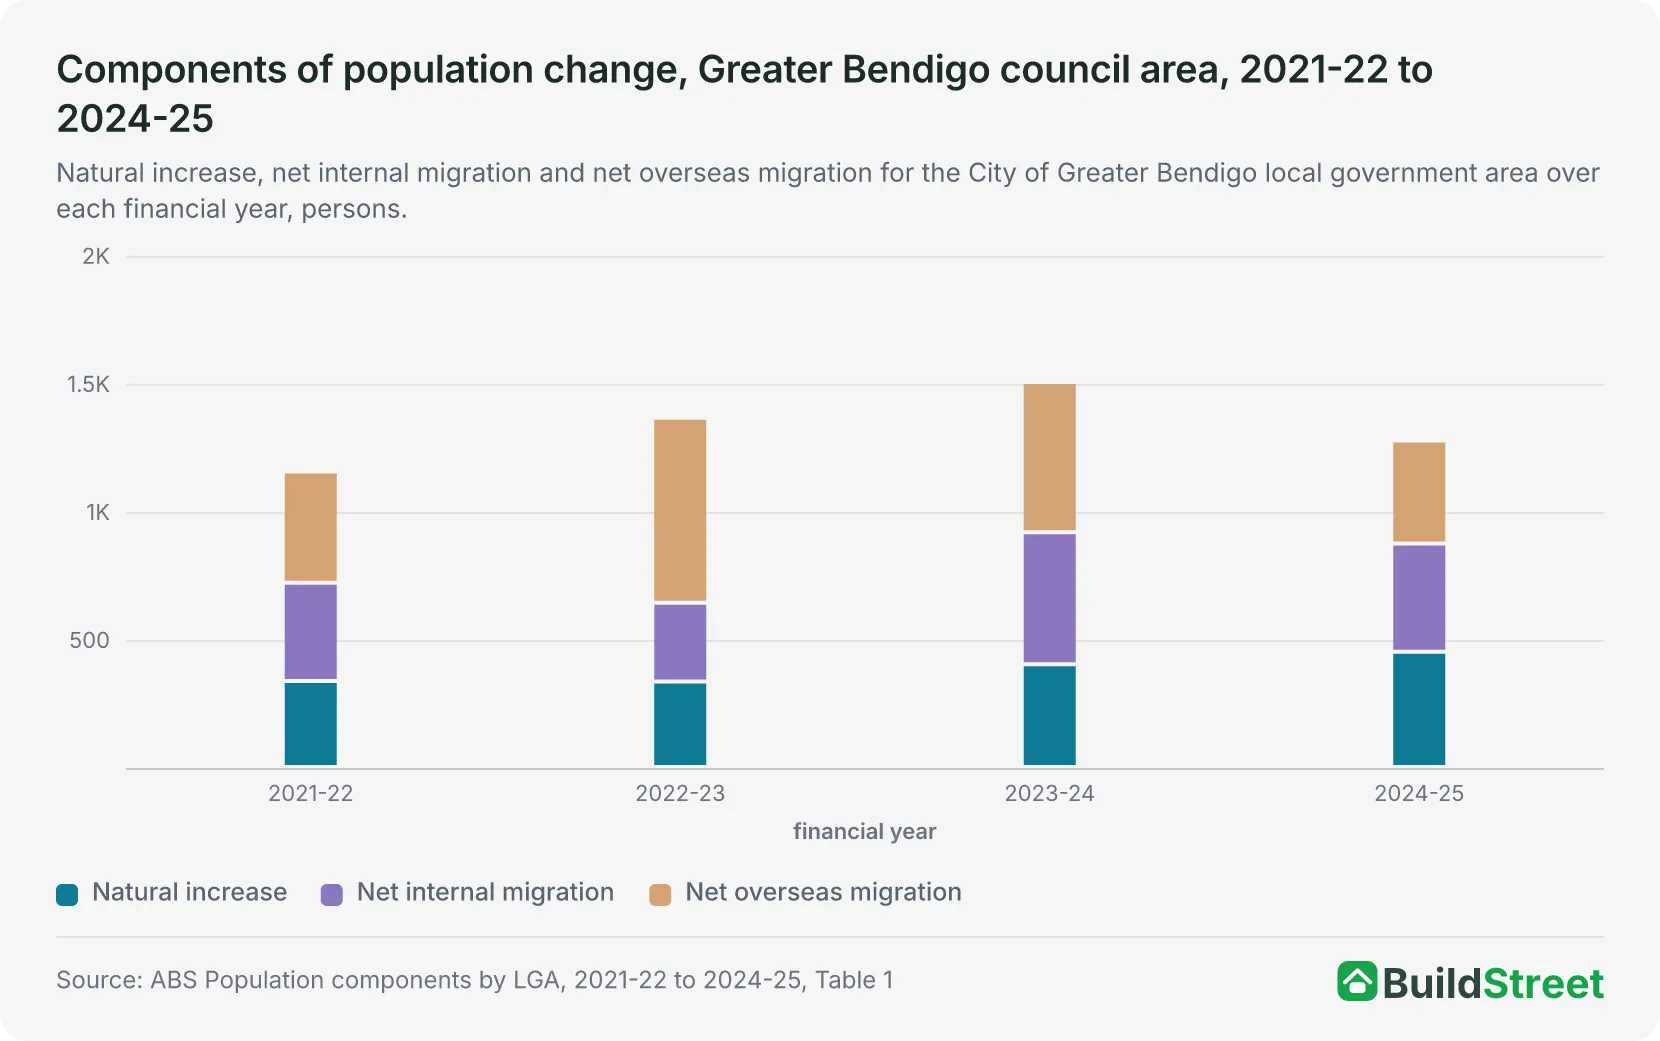
Among the council areas containing Victoria's three largest urban areas outside Melbourne, Greater Bendigo had the smallest increase and the lowest growth rate in 2024-25. Greater Geelong added 6,376 people (2.2 per cent) and Ballarat added 2,102 (1.7 per cent), against Greater Bendigo's 1,275 (1.0 per cent). Net internal migration was the largest component in both Greater Geelong, at 3,281 people, and Ballarat, at 1,0477.
| Components of population change by council area, Victoria's three largest regional cities, 2024-25 | ||||||
|---|---|---|---|---|---|---|
| Council area (LGA) | 30 June 2025 | Natural increase | Net internal migration | Net overseas migration | Total change | Growth rate % |
| Greater Geelong | 295,052 | +1,571 | +3,281 | +1,524 | +6,376 | 2.2 |
| Ballarat | 122,661 | +568 | +1,047 | +487 | +2,102 | 1.7 |
| Greater Bendigo | 126,568 | +450 | +423 | +402 | +1,275 | 1.0 |
Source · ABS Population estimates and components by LGA, 2024 to 2025, Table 2
Section 04 · The growth areas
Where in Bendigo is the population growing fastest?
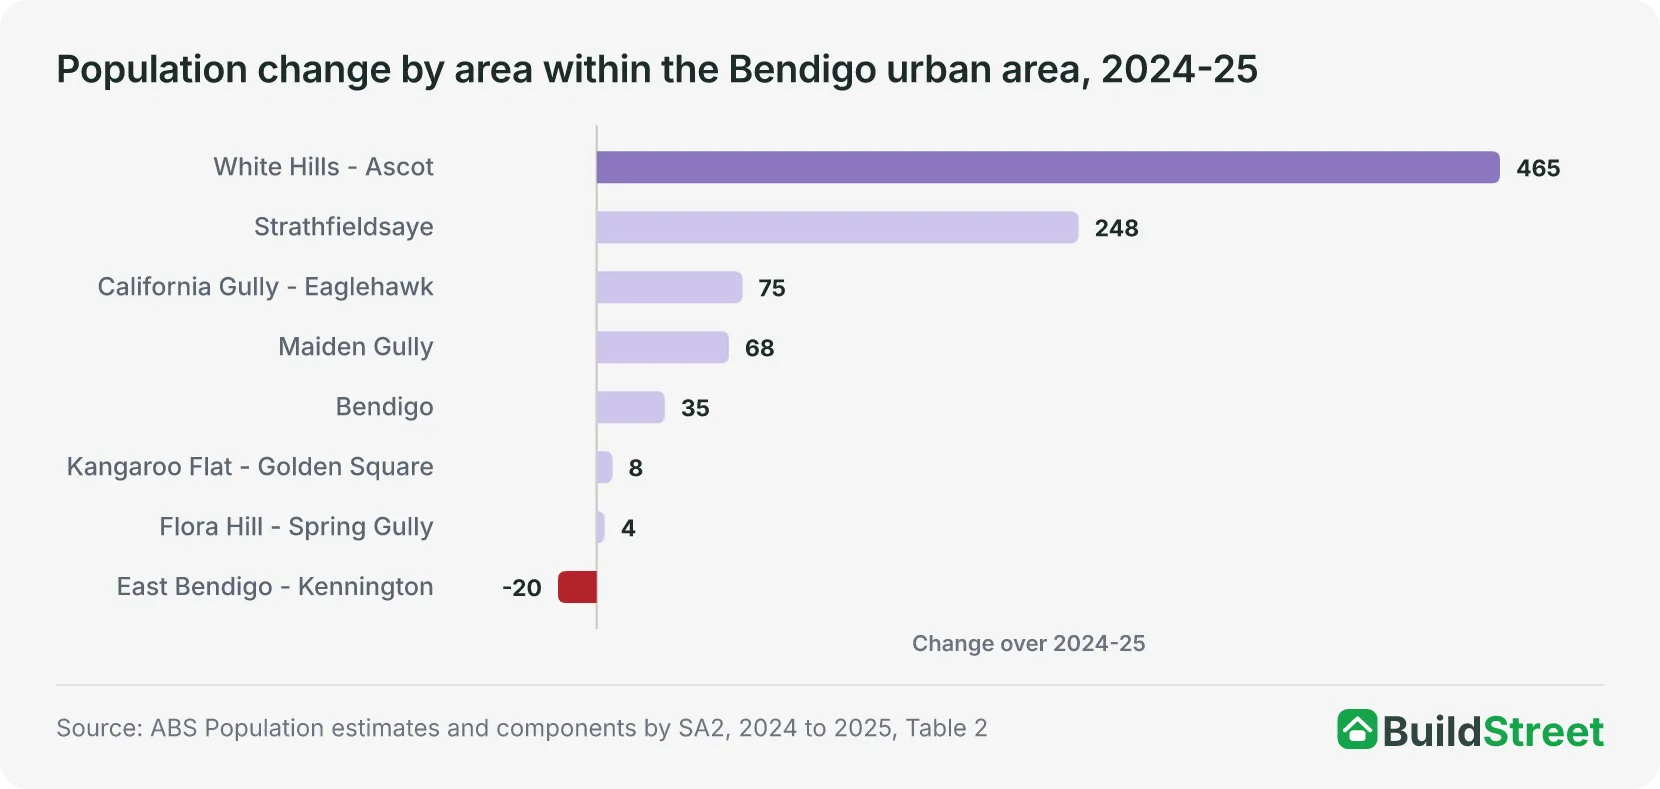
White Hills - Ascot recorded the largest increase among the 16 local areas in the wider Bendigo region in 2024-25, and the highest growth rate. It added 465 people (3.0 per cent), growing from 15,630 to 16,095 over the year. Strathfieldsaye added 248 people (2.2 per cent). Bendigo Surrounds - South, at 153 people (1.7 per cent), Bendigo Surrounds - North, at 144 (2.7 per cent), and Castlemaine, at 133 (1.2 per cent), had the next largest increases5.
Within the eight areas that make up the urban area, growth was concentrated in two. White Hills - Ascot and Strathfieldsaye together added 713 people, about 81 per cent of the urban area's 883, and the other six areas added 170 between them. Kangaroo Flat - Golden Square, the largest of the eight at 21,369 people, added eight people. The central Bendigo area added 35 people, with net overseas migration of 85 people against a natural decrease of 59. East Bendigo - Kennington was the only one of the 16 areas in the region to decline, by 20 people5.
Across the wider region, the Heathcote - Castlemaine - Kyneton statistical area grew from 53,918 to 54,540 people over 2024-25, an increase of 622 (1.15 per cent). Loddon - Elmore grew from 12,585 to 12,736, an increase of 151 (1.20 per cent). Both grew faster than the urban area's 0.84 per cent. The wider Bendigo region grew from 172,113 to 173,769, an increase of 1,656 (0.96 per cent)2.
| The largest population increases by area in the Bendigo region, 2024-25 | |||||
|---|---|---|---|---|---|
| Area (SA2) | Statistical area (SA3) | 30 June 2024 | 30 June 2025 | Change | Growth rate % |
| White Hills - Ascot | Bendigo | 15,630 | 16,095 | +465 | 3.0 |
| Strathfieldsaye | Bendigo | 11,457 | 11,705 | +248 | 2.2 |
| Bendigo Surrounds - South | Heathcote - Castlemaine - Kyneton | 8,941 | 9,094 | +153 | 1.7 |
| Bendigo Surrounds - North | Loddon - Elmore | 5,361 | 5,505 | +144 | 2.7 |
| Castlemaine | Heathcote - Castlemaine - Kyneton | 11,507 | 11,640 | +133 | 1.2 |
Source · ABS Population estimates and components by SA2, 2024 to 2025, Table 2
Section 05 · The state picture
How does Bendigo compare with other cities in Victoria?
Bendigo was the fourth-largest of Victoria's 21 urban areas at 30 June 2025. The Melbourne urban area had 5,328,274 people, Geelong 314,381, Ballarat 120,939 and Bendigo 106,493. The next largest, Shepparton - Mooroopna, had 55,332 people, about half of Bendigo's total1.
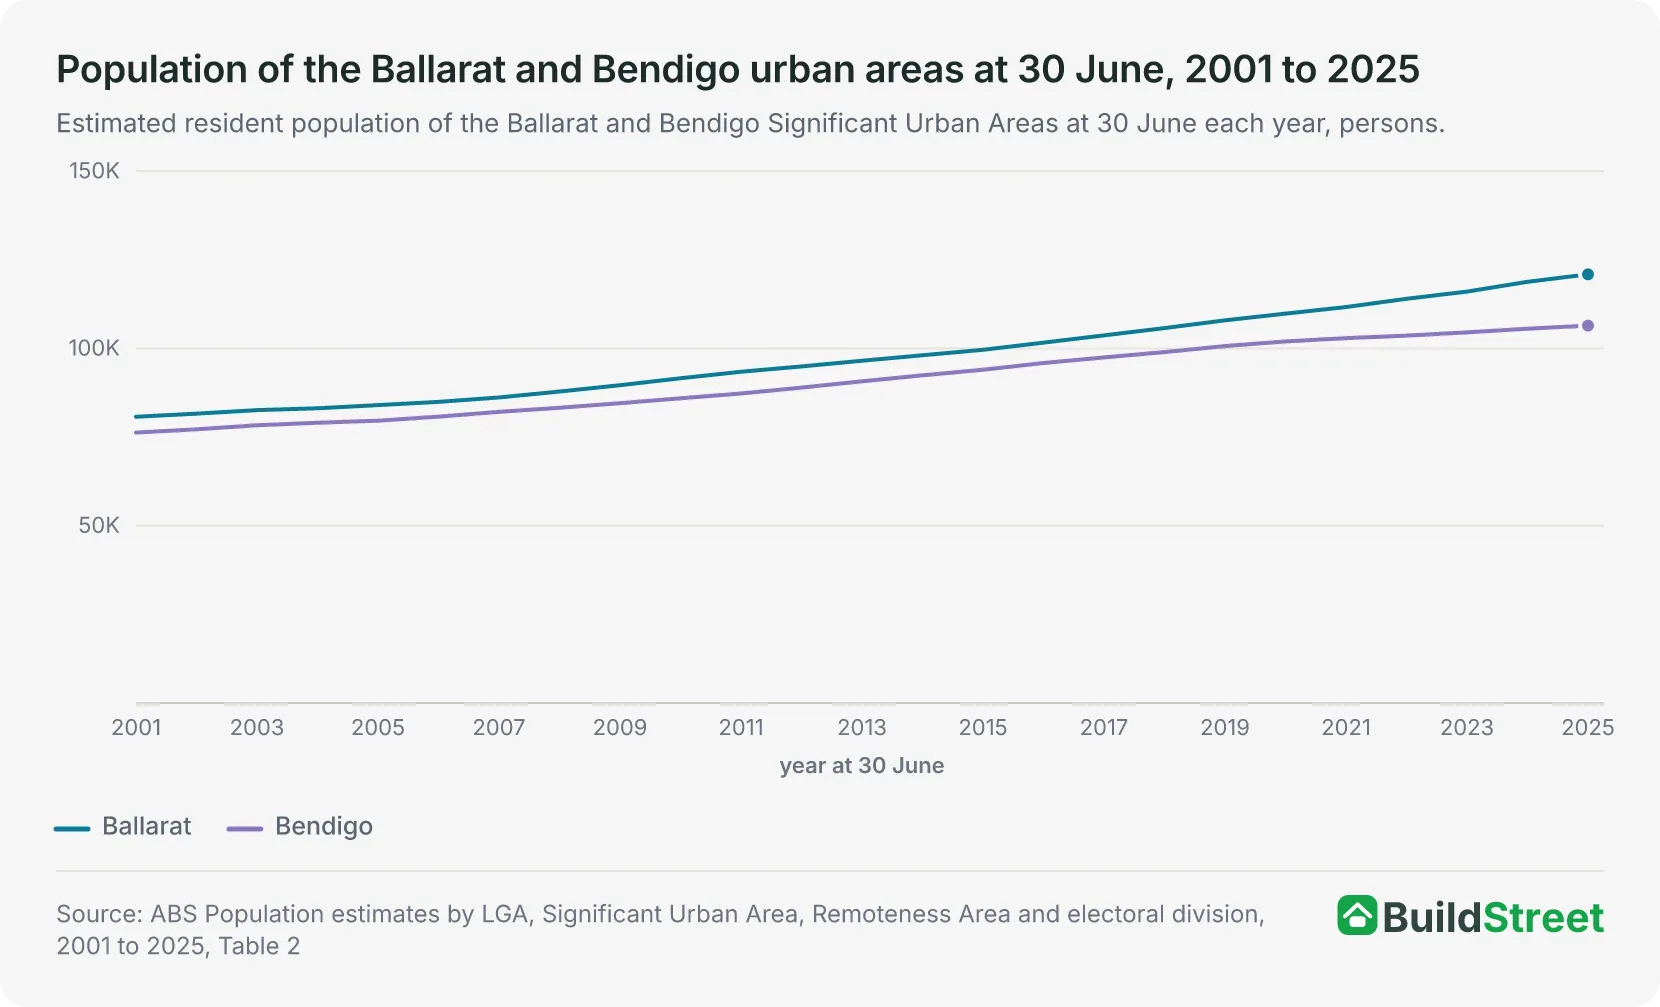
Ballarat was larger than Bendigo in every year from 2001 to 2025, and the gap widened overall. Ballarat had 4,462 more people than Bendigo at 30 June 2001 and 14,446 more at 30 June 2025. Ballarat grew from 80,774 to 120,939 people over the 24 years, an increase of 40,165 (49.7 per cent), against Bendigo's increase of 30,181 (39.5 per cent)1.
Bendigo also grew more slowly in 2024-25 than the three Victorian urban areas larger than it. Geelong grew by 2.06 per cent, Melbourne by 1.97 per cent and Ballarat by 1.77 per cent, against Bendigo's 0.84 per cent. Bendigo's growth rate ranked 12th of the 21 Victorian urban areas. Nine of the 21 grew more slowly than Bendigo, including three that recorded population declines: Sale, Swan Hill and Colac1.
Melbourne's population data is covered in the Melbourne population article.
| Victoria's five largest urban areas, 30 June 2001 and 30 June 2025 | ||||
|---|---|---|---|---|
| Urban area (SUA) | 30 June 2001 | 30 June 2025 | Change over 2024-25 | Growth rate 2024-25 % |
| Melbourne | 3,428,284 | 5,328,274 | +102,910 | 1.97 |
| Geelong | 199,732 | 314,381 | +6,360 | 2.06 |
| Ballarat | 80,774 | 120,939 | +2,098 | 1.77 |
| Bendigo | 76,312 | 106,493 | +883 | 0.84 |
| Shepparton - Mooroopna | 42,835 | 55,332 | +393 | 0.72 |
Source · ABS Population estimates by LGA, Significant Urban Area, Remoteness Area and electoral division, 2001 to 2025, Table 2
Section 06 · The national rank
Where does Bendigo rank among Australia's largest cities?
Bendigo was the 19th-largest of Australia's 102 urban areas at 30 June 2025, and one of 20 urban areas with 100,000 or more people. Ballarat, at 120,939 people, ranked 18th and Albury - Wodonga, at 102,435, ranked 20th. Launceston, at 92,993 people, was the largest urban area with fewer than 100,000 people1.
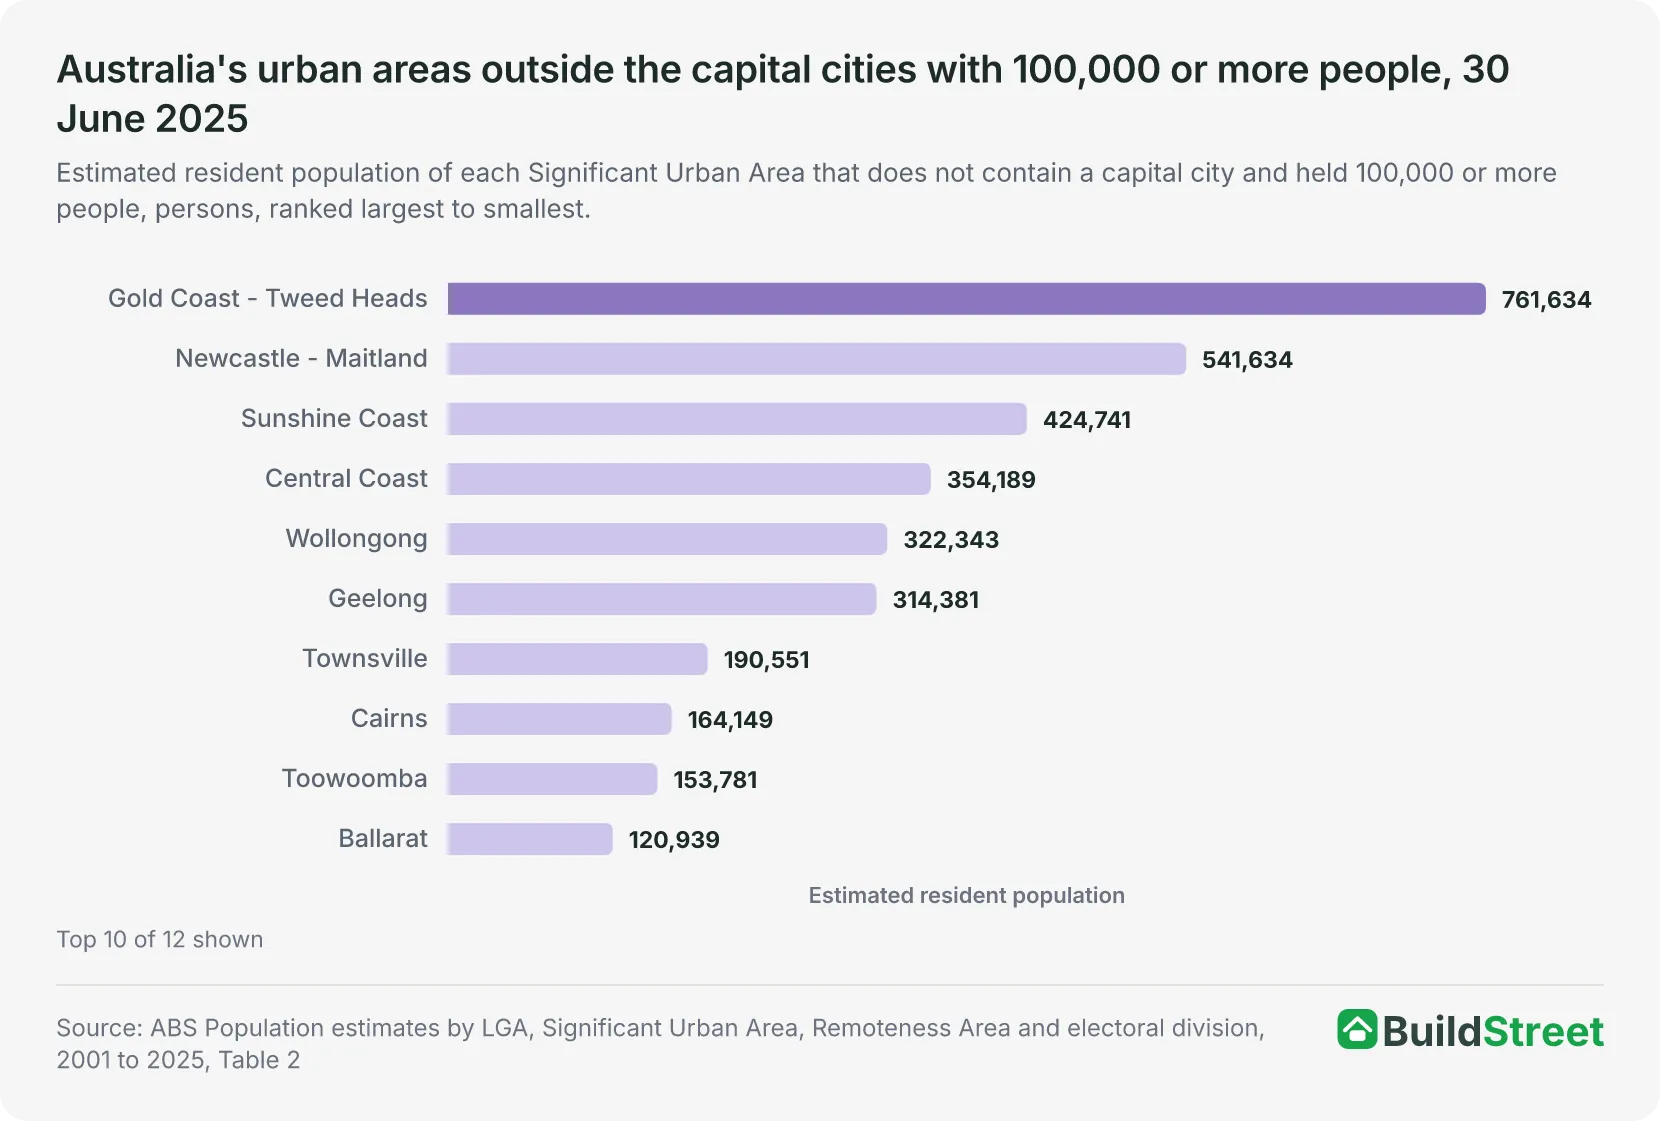
After excluding the eight urban areas that contain a capital city, Bendigo ranked 11th among the remaining 94. It was one of 12 non-capital urban areas with at least 100,000 people. These ranged from Gold Coast - Tweed Heads at 761,634 people to Albury - Wodonga at 102,4351.
Among the 20 urban areas with at least 100,000 people, annual growth in 2024-25 ranged from 0.15 per cent in Hobart to 2.40 per cent in Perth. Bendigo's growth rate of 0.84 per cent ranked 18th among the 20. Only the Central Coast, at 0.68 per cent, and Hobart had lower growth rates. Cairns, at 0.86 per cent, ranked one place above Bendigo1.
| Australia's urban areas with 100,000 or more people, as at 30 June 2025 | ||||
|---|---|---|---|---|
| Rank | Urban area (SUA) | Population | Change over 2024-25 | Growth rate % |
| 1 | Melbourne | 5,328,274 | +102,910 | 1.97 |
| 2 | Sydney | 5,219,674 | +70,670 | 1.37 |
| 3 | Brisbane | 2,745,086 | +56,017 | 2.08 |
| 4 | Perth | 2,430,757 | +56,991 | 2.40 |
| 5 | Adelaide | 1,470,938 | +18,417 | 1.27 |
| 6 | Gold Coast - Tweed Heads | 761,634 | +12,279 | 1.64 |
| 7 | Newcastle - Maitland | 541,634 | +6,953 | 1.30 |
| 8 | Canberra - Queanbeyan | 521,049 | +5,894 | 1.14 |
| 9 | Sunshine Coast | 424,741 | +8,018 | 1.92 |
| 10 | Central Coast | 354,189 | +2,401 | 0.68 |
| 11 | Wollongong | 322,343 | +3,642 | 1.14 |
| 12 | Geelong | 314,381 | +6,360 | 2.06 |
| 13 | Hobart | 233,736 | +346 | 0.15 |
| 14 | Townsville | 190,551 | +1,752 | 0.93 |
| 15 | Cairns | 164,149 | +1,404 | 0.86 |
| 16 | Toowoomba | 153,781 | +1,943 | 1.28 |
| 17 | Darwin | 145,019 | +2,520 | 1.77 |
| 18 | Ballarat | 120,939 | +2,098 | 1.77 |
| 19 | Bendigo | 106,493 | +883 | 0.84 |
| 20 | Albury - Wodonga | 102,435 | +1,183 | 1.17 |
Source · ABS Population estimates by LGA, Significant Urban Area, Remoteness Area and electoral division, 2001 to 2025, Table 2
Section 07 · The long run
How has Bendigo's population changed since 2001?
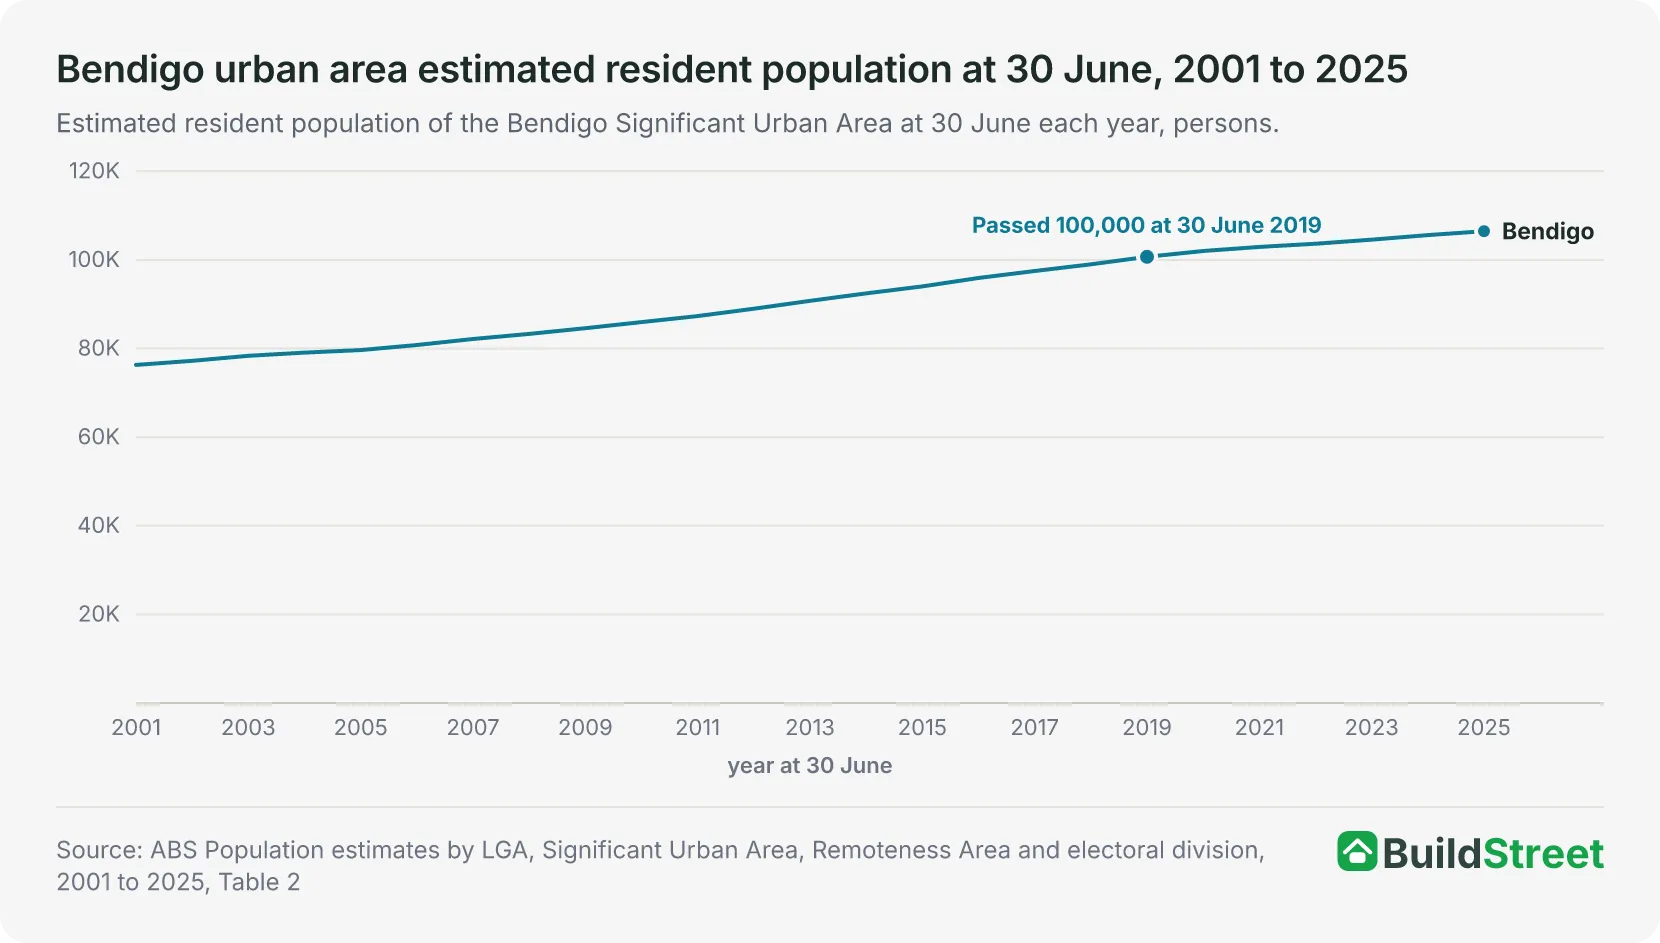
The urban area added 30,181 people between 30 June 2001 and 30 June 2025, growing from 76,312 to 106,493. That was an increase of 39.5 per cent1.
Bendigo first exceeded 80,000 people at 30 June 2006, 85,000 at 30 June 2010, 90,000 at 30 June 2013, 95,000 at 30 June 2016, 100,000 at 30 June 2019 and 105,000 at 30 June 20241. Each milestone year is the first 30 June at which the estimated resident population was at or above the threshold. It took four years to go from 80,000 to 85,000, three years for each of the next three steps, and five years to go from 100,000 in 2019 to 105,000 in 2024.
The Greater Bendigo council area first exceeded 100,000 residents at 30 June 2010, when it reached 100,506. Its population grew from 89,071 at 30 June 2001 to 126,568 at 30 June 2025, an increase of 37,497 (42.1 per cent)1.
Three of the eight areas that make up the urban area more than doubled their populations between 2001 and 2025. White Hills - Ascot grew from 6,171 people at 30 June 2001 to 16,095 at 30 June 2025, Strathfieldsaye from 4,134 to 11,705 and Maiden Gully from 2,708 to 5,869. The central Bendigo area fell from 15,549 to 14,457 over the same period, a decline of 1,0922.
| Bendigo urban area population milestones in the annual series | ||
|---|---|---|
| Milestone | First 30 June at or above | Population that year |
| 80,000 | 30 June 2006 | 80,804 |
| 85,000 | 30 June 2010 | 85,978 |
| 90,000 | 30 June 2013 | 90,772 |
| 95,000 | 30 June 2016 | 95,934 |
| 100,000 | 30 June 2019 | 100,711 |
| 105,000 | 30 June 2024 | 105,610 |
Source · ABS Population estimates by LGA, Significant Urban Area, Remoteness Area and electoral division, 2001 to 2025, Table 2
Section 08
Bendigo population: quick answers
How many people live in Bendigo?
The Bendigo Significant Urban Area had an estimated resident population of 106,493 at 30 June 2025. That was the fourth-largest population of the 21 urban areas the ABS lists in Victoria, and the 19th largest in Australia. The 30 June 2025 estimates are preliminary. The next release, covering 30 June 2026, is due on 25 March 2027.
Is Bendigo bigger than Ballarat?
No. The Ballarat urban area had 120,939 people at 30 June 2025 and the Bendigo urban area 106,493, a gap of 14,446 people in the ABS annual data. Ballarat was the larger of the two in every year from 2001 to 2025, and the gap widened from 4,462 to 14,446 over those years. Ballarat also grew faster in 2024-25, at 1.77 per cent against Bendigo's 0.84 per cent.
How fast is Bendigo's population growing?
The Bendigo urban area added 883 people, or 0.84 per cent, over the 2024-25 financial year. The population increased in every year from 2001-02, and growth peaked at 1,899 people (2.02 per cent) in 2015-16. The rate was below 1 per cent in each of the five years from 2020-21 to 2024-25.
What is the difference between the Bendigo urban area and the City of Greater Bendigo?
The Bendigo urban area is a Significant Urban Area, an ABS statistical boundary built from eight small statistical areas covering 287.4 square kilometres, and it had 106,493 people at 30 June 2025. The City of Greater Bendigo is a local government area, a larger boundary covering 3,000 square kilometres, and it had 126,568 people on the same date. ABS figures for the two boundaries are not interchangeable.
When did Bendigo pass 100,000 people?
The Bendigo urban area first exceeded 100,000 people at 30 June 2019, when the estimated resident population was 100,711. On the same basis, the urban area passed 90,000 at 30 June 2013 and 105,000 at 30 June 2024. In the council-area data, Greater Bendigo passed 100,000 residents at 30 June 2010.
Section 09
Australia population statistics
References
- ABS Regional population, 2024-25: population estimates by LGA and Significant Urban Area, 2001 to 2025 (datacube 32180DS0004) · Australian Bureau of Statistics ↑ b c d e f g h i j k l m n o
- ABS Regional population, 2024-25: population estimates by SA2 and above, 2001 to 2025 (datacube 32180DS0003) · Australian Bureau of Statistics ↑ b c d e f
- ABS Regional population methodology, 2024-25 · Australian Bureau of Statistics ↑ b
- ABS Regional population, 2024-25 · Australian Bureau of Statistics ↑
- ABS Regional population, 2024-25: population estimates and components by SA2, 2024 to 2025 (datacube 32180DS0001) · Australian Bureau of Statistics ↑ b c
- ABS Regional population, 2024-25: population components by SA2 and above, 2021-22 to 2024-25 (datacube 32180DS0005) · Australian Bureau of Statistics ↑ b c
- ABS Regional population, 2024-25: population estimates and components by LGA, 2024 to 2025 (datacube 32180DS0002) · Australian Bureau of Statistics ↑ b
- ABS Regional population, 2024-25: population components by LGA, 2021-22 to 2024-25 (datacube 32180DS0006) · Australian Bureau of Statistics ↑
