

Published 31 Aug 2026
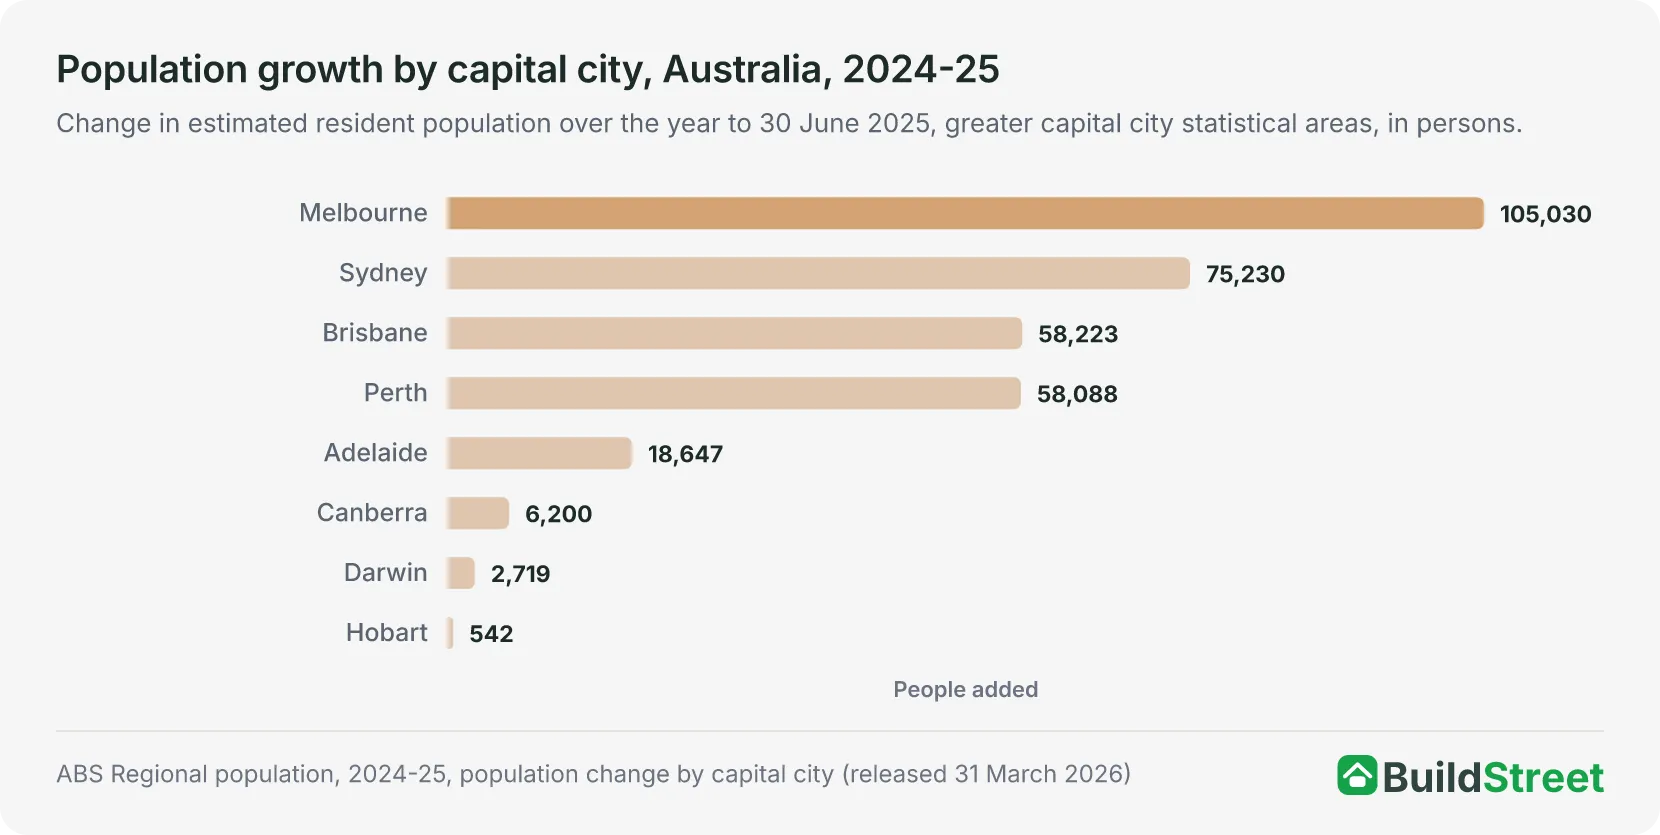 How other cities compareMelbourne added the most people of any capital in 2024-25 and Perth grew at the fastest rate, while Darwin grew fourth fastest from the smallest base. The cities article ranks growth across Australia's capitals and regional centres.
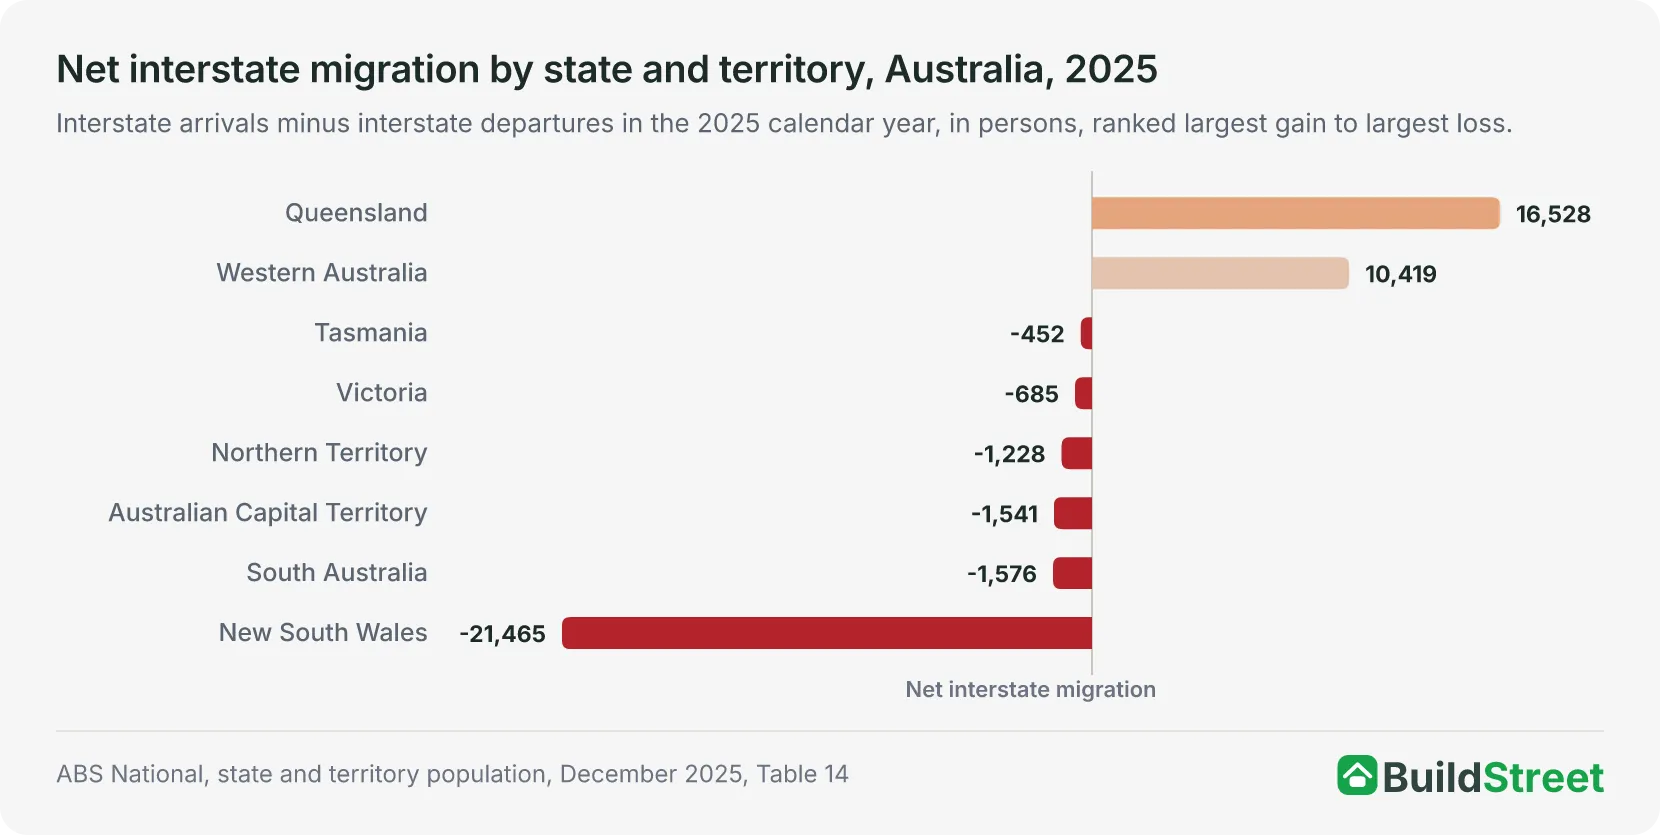 Moves between the statesNet internal migration subtracted 1,430 people from Greater Darwin in 2024-25. The interstate migration article covers the annual state-to-state flows for all eight states and territories.
Section 01 · The headline number
How many people live in Darwin?
Greater Darwin had an estimated resident population of 159,284 at 30 June 20251. That was the smallest population of the eight capital cities. Hobart, the next smallest, had 255,250 people, equal to 1.6 times Darwin's count, while Canberra, the third smallest, had 484,630. Greater Darwin accounted for 0.6 per cent of the 27,613,654 people counted nationally on the same date2.
The ABS updates the city estimate once a year, at 30 June, and the 30 June 2025 figures are preliminary and subject to revision. The next release, covering 30 June 2026, is due on 25 March 20271.
Section 02 · The pace
How fast is Darwin's population growing?
Greater Darwin added 2,719 people, or 1.74 per cent, over the 2024-25 financial year. The ABS capital city data rounds the growth rate to 1.7 per cent, while the Northern Territory summary rounds the increase to 2,700 people. The growth rate was the fourth fastest of the eight capital cities, behind Perth's 2.43 per cent, Brisbane's 2.10 per cent and Melbourne's 1.97 per cent, and ahead of Sydney's 1.35 per cent2.
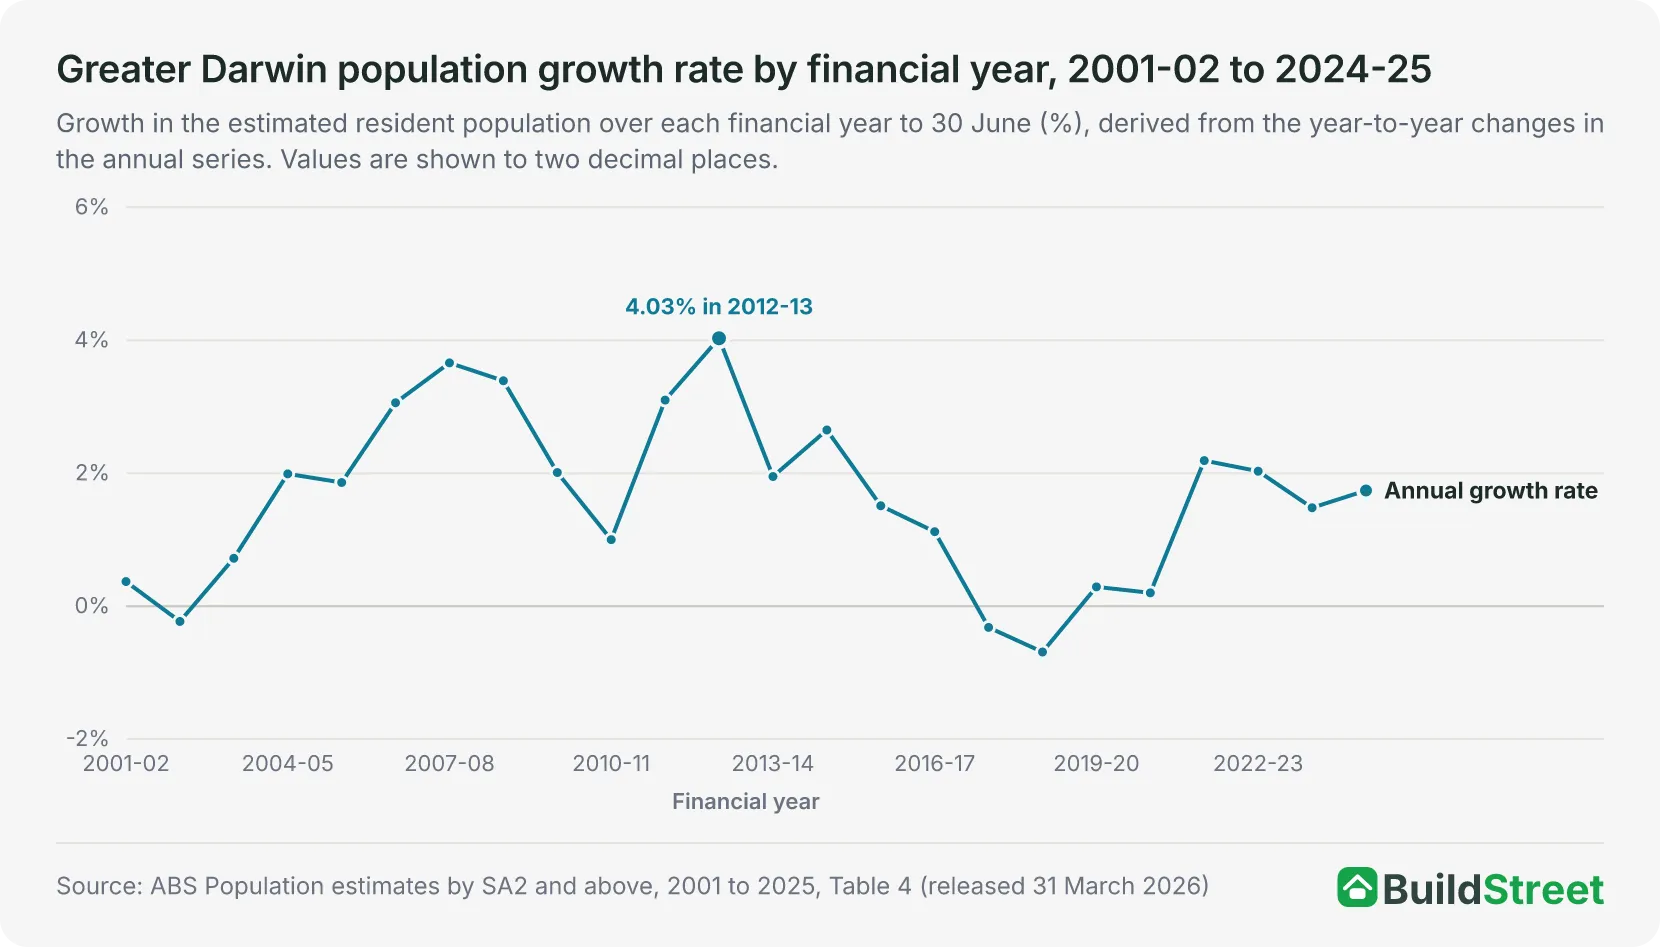
Annual population growth over the 24 financial years from 2001-02 to 2024-25 ranged from a 0.69 per cent fall in 2018-19 to a 4.03 per cent increase in 2012-13. The population fell in three of those years, by 246 people in 2002-03, 479 in 2017-18 and 1,022 in 2018-19. No other capital recorded more than one fall over the same period. Sydney and Melbourne each fell once, in 2020-21, and the other five capitals grew in every year2.
The fastest year was 2012-13, when the city added 5,366 people (4.03 per cent), the largest increase and the highest rate over the period. Growth resumed slowly after the 2018-19 fall, at 422 people in 2019-20 and 298 in 2020-21, before annual increases ranged from 2,284 to 3,244 people a year over the four years to 2024-252.
Section 03 · The drivers
What drives Darwin's population growth?
Net overseas migration was the largest contributor to Greater Darwin's population growth in 2024-25, adding 2,847 people. Natural increase (the excess of births over deaths) added 1,302 people. Net internal migration (moves to and from elsewhere in Australia) subtracted 1,4303. The components added 2,719 people overall, matching the city's population increase for the year.
Greater Darwin recorded a net internal migration loss in each of the four years from 2021-22 to 2024-25: 314 in 2021-22, 1,737 in 2022-23, 1,925 in 2023-24 and 1,430 in 2024-253. The ABS reports that Brisbane and Perth were the only capitals with net internal migration gains in 2024-25, while Sydney and Melbourne had the largest net internal migration losses1.
Net overseas migration exceeded the internal migration loss in each of the four years. It peaked at 3,388 people in 2022-23, then eased to 2,857 in 2023-24 and 2,847 in 2024-25. All eight capitals recorded net overseas migration gains in 2024-25. Darwin's was the seventh largest, ahead of Hobart's 1,833 and behind Canberra's 4,8193.
| Components of Greater Darwin population change, 2024-25 | ||
|---|---|---|
| Component | People | Derivation |
| Net overseas migration | +2,847 | 4,321 arrivals minus 1,474 departures |
| Natural increase | +1,302 | 2,046 births minus 744 deaths |
| Net internal migration | -1,430 | 10,912 arrivals minus 12,342 departures |
| Total growth | +2,719 | Derived sum; the release's summary rounds it to 2,700 |
Source · ABS Population components by SA2 and above, 2021-22 to 2024-25, Table 4
Section 04 · The growth areas
Where in Darwin is the population growing fastest?
Berrimah had Darwin's fastest population growth in 2024-25, increasing by 527 people, or 22.5 per cent. The ABS identifies Berrimah, Palmerston - South and Darwin City as the Northern Territory areas with the largest population growth in the year, with rounded increases of about 530, 340 and 320 people. Berrimah grew from 2,344 to 2,871 people, an increase of 527 (22.5 per cent), while Palmerston - South grew from 8,726 to 9,070 and Darwin City from 8,273 to 8,597. Both Palmerston - South and Darwin City grew by 3.9 per cent4. Berrimah's rate was the second highest of any area in Australia with at least 1,000 people at June 2024, behind Port Melbourne Industrial's 22.6 per cent1.
The three areas also recorded the largest gains in different components of population change. Berrimah had the largest net internal migration gain of any local area in the territory, at 479 people, Darwin City had the largest net overseas migration gain, at 430, and Palmerston - South had the largest natural increase, at 1544.
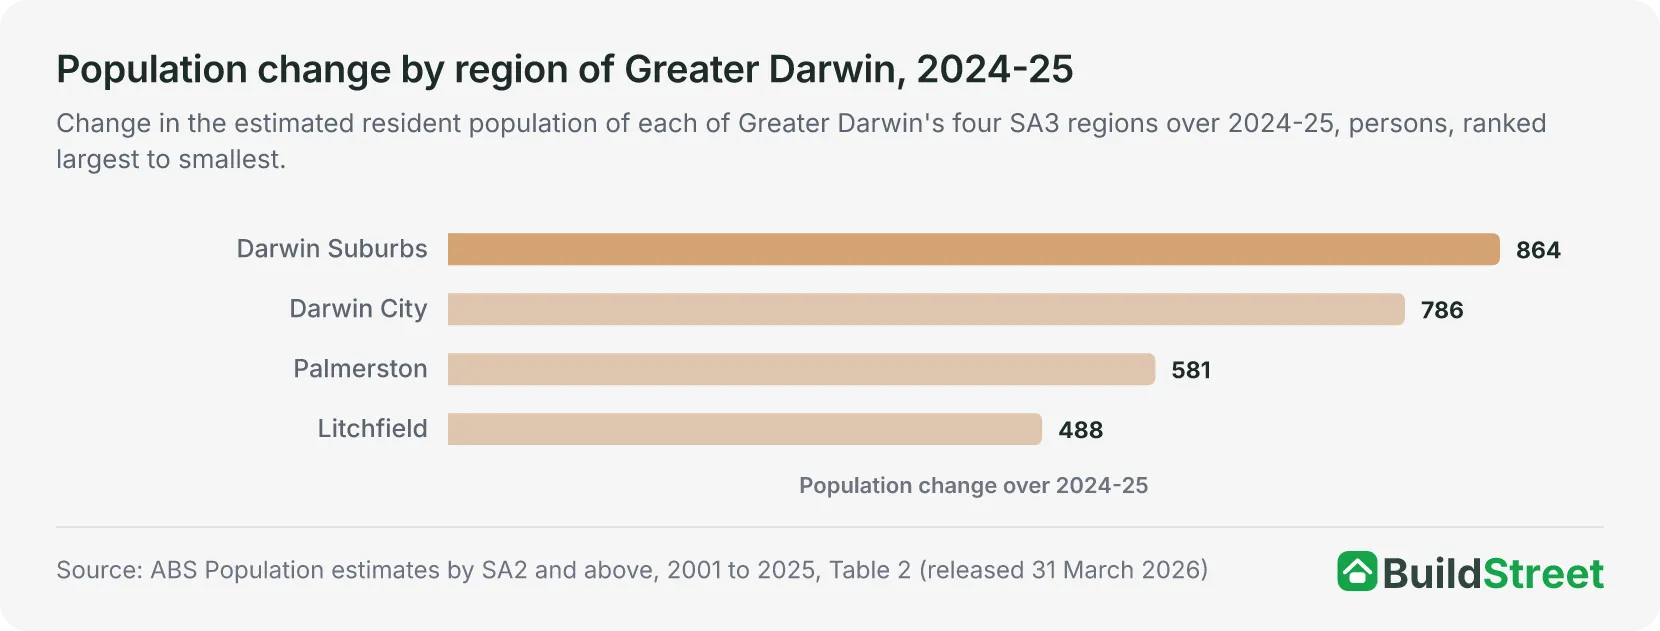
Every broad region of the city grew over 2024-25. Darwin Suburbs added 864 people and Darwin City added 786, the two largest increases across Greater Darwin. Darwin City had the highest growth rate, at 2.60 per cent. Palmerston added 581 people and Litchfield added 4882. The city's centre of population was in Wishart, south of the Stuart Highway, at June 2025, and moved little over the year, with growth relatively even across the city1.
| The fastest growing areas of Darwin, 2024-25 | |||||
|---|---|---|---|---|---|
| Area (SA2) | Region (SA3) | 30 June 2024 | 30 June 2025 | Change | Growth rate % |
| Berrimah | Darwin Suburbs | 2,344 | 2,871 | +527 | 22.5 |
| Palmerston - South | Palmerston | 8,726 | 9,070 | +344 | 3.9 |
| Darwin City | Darwin City | 8,273 | 8,597 | +324 | 3.9 |
Source · ABS Population estimates and components by SA2, 2024 to 2025, Table 7
Section 05 · The territory share
How much of the Northern Territory's population lives in Darwin?
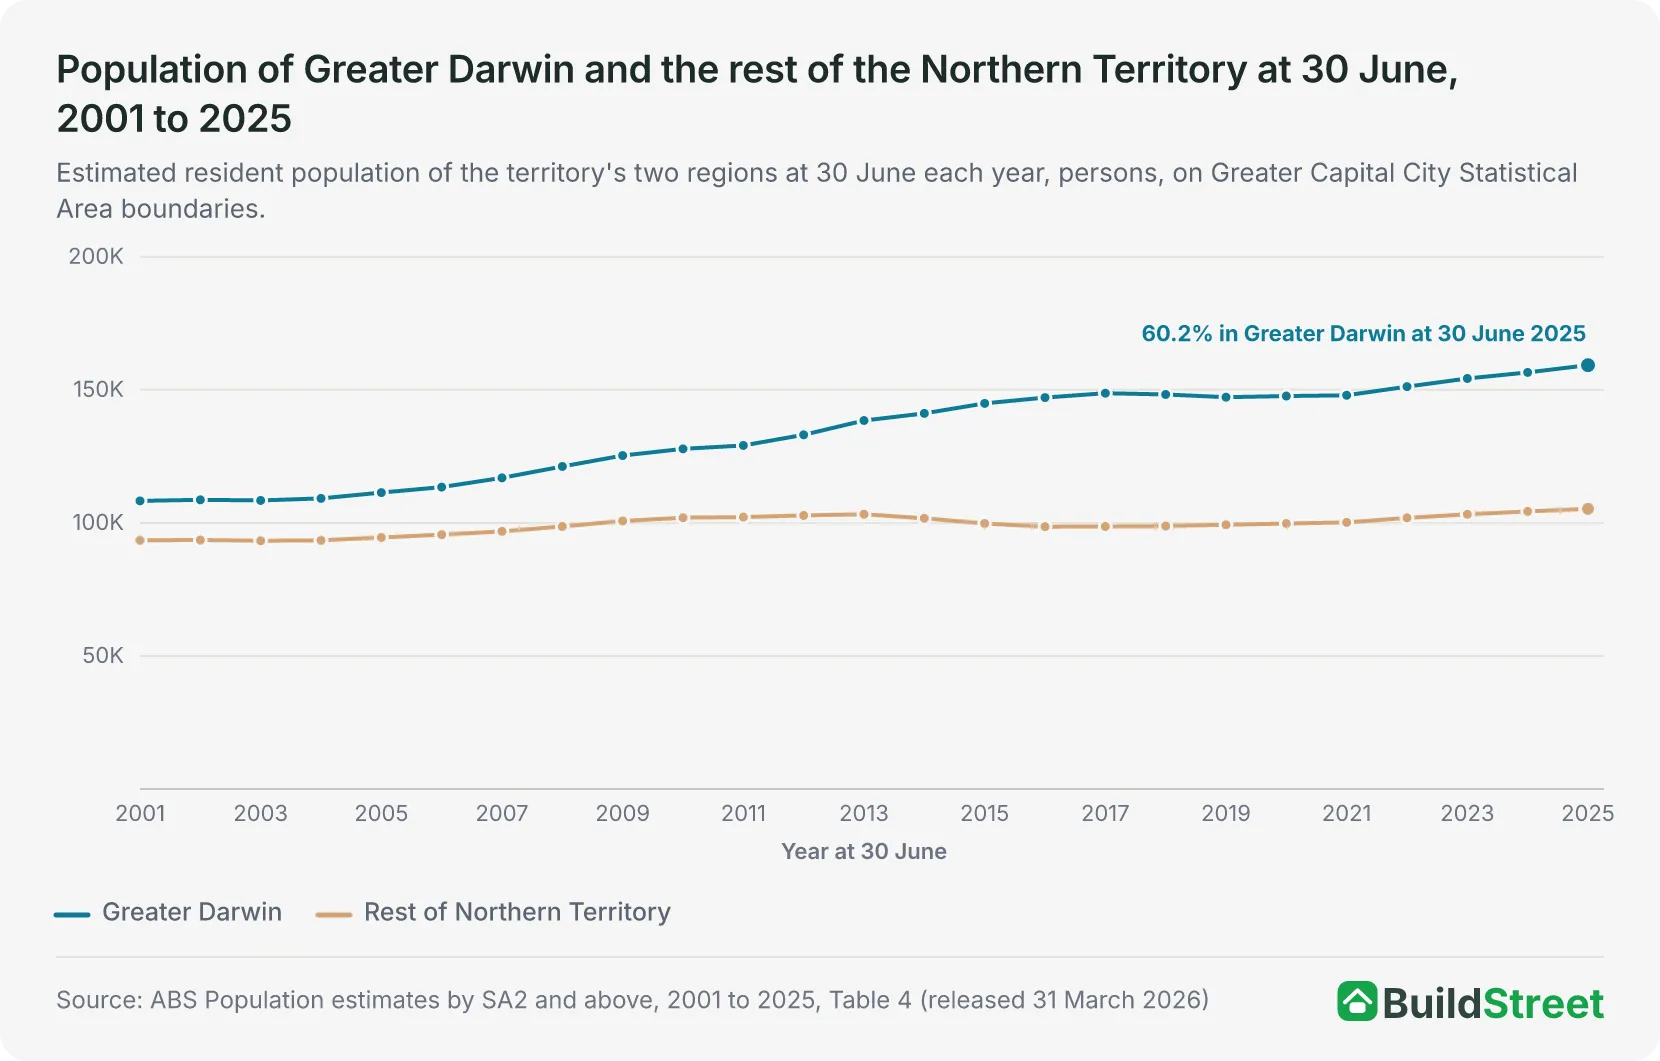
About three in five people in the Northern Territory lived in Greater Darwin at 30 June 2025. Greater Darwin had 159,284 people at 30 June 2025 and the rest of the Northern Territory 105,272, so the capital accounted for 60.2 per cent of the Northern Territory's 264,556 people. The share was 53.7 per cent at 30 June 2001, when the capital had 108,280 of the territory's 201,743 people2.
The gap between Darwin and the rest of the territory widened from 14,817 people at 30 June 2001 to 54,012 at 30 June 2025. The rest of the territory added 953 people (0.91 per cent) in 2024-25, which the ABS rounds to 950 people, or 0.9 per cent. That rate was about half Greater Darwin's 1.74 per cent2.
Across the six states and the Northern Territory, the ABS divides each jurisdiction into its capital area and the rest of the jurisdiction. Darwin's 60.2 per cent capital share ranked fifth among the seven jurisdictions at 30 June 2025. It was higher than Brisbane's 50.0 per cent and Hobart's 44.3 per cent, and lower than Sydney's 65.6 per cent, Melbourne's 76.8 per cent, Adelaide's 78.4 per cent and Perth's 80.6 per cent2.
Section 06 · The other capitals
How does Darwin compare with Australia's other capital cities?
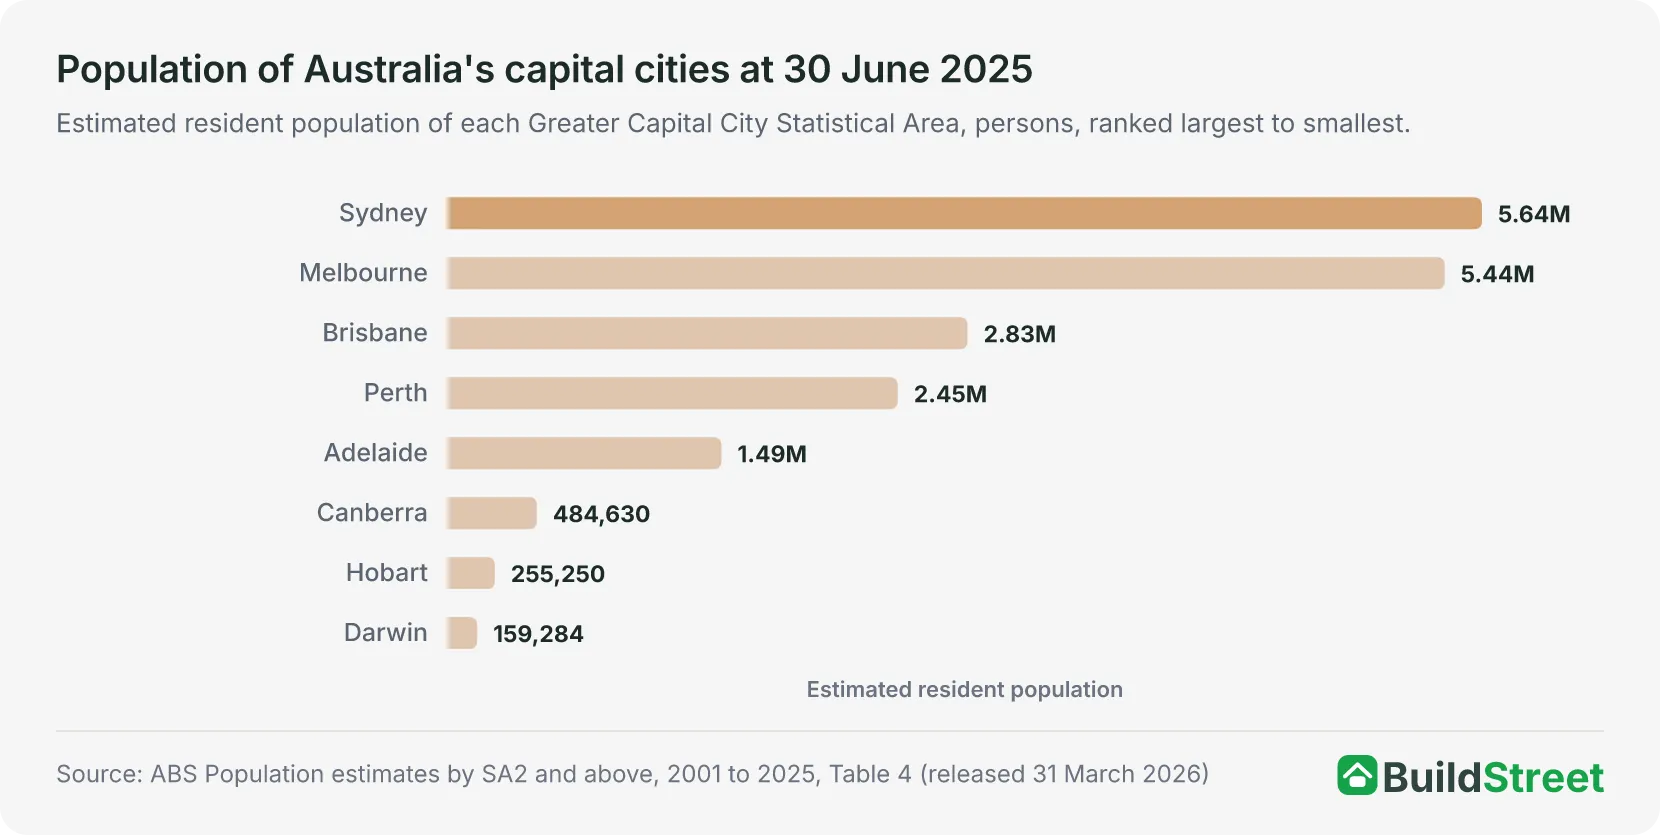
Darwin was the smallest of the eight capital city populations at 30 June 2025, with 159,284 people. The seven larger capitals were Sydney at 5,638,830, Melbourne at 5,435,590, Brisbane at 2,833,524, Perth at 2,452,765, Adelaide at 1,491,015, Canberra at 484,630 and Hobart at 255,2502.
The growth rankings differed from the size rankings in 2024-25. Melbourne recorded the largest increase of the eight capitals, at 105,030 people, followed by Sydney's 75,230, Brisbane's 58,223 and Perth's 58,088. Darwin's increase of 2,719 people was the second smallest, ahead of Hobart's 542, but its growth rate of 1.74 per cent was the fourth fastest, behind Perth at 2.43 per cent, Brisbane at 2.10 per cent and Melbourne at 1.97 per cent1.
The eight capitals together had 18,750,888 people at 30 June 2025, after adding 324,679 people, or 1.8 per cent, over the year. Greater Darwin accounted for 0.8 per cent of the combined capital population1.
Hobart's population data is covered in the Hobart population article.
| Population of Australia's capital cities, as at 30 June 2025 | |||
|---|---|---|---|
| Capital city | Population | Change over 2024-25 | Growth rate % |
| Sydney | 5,638,830 | +75,230 | 1.35 |
| Melbourne | 5,435,590 | +105,030 | 1.97 |
| Brisbane | 2,833,524 | +58,223 | 2.10 |
| Perth | 2,452,765 | +58,088 | 2.43 |
| Adelaide | 1,491,015 | +18,647 | 1.27 |
| Canberra | 484,630 | +6,200 | 1.30 |
| Hobart | 255,250 | +542 | 0.21 |
| Darwin | 159,284 | +2,719 | 1.74 |
| All capital cities | 18,750,888 | +324,679 | 1.76 |
Source · ABS Population estimates by SA2 and above, 2001 to 2025, Table 4
Section 07 · The long run
How has Darwin's population changed since 2001?
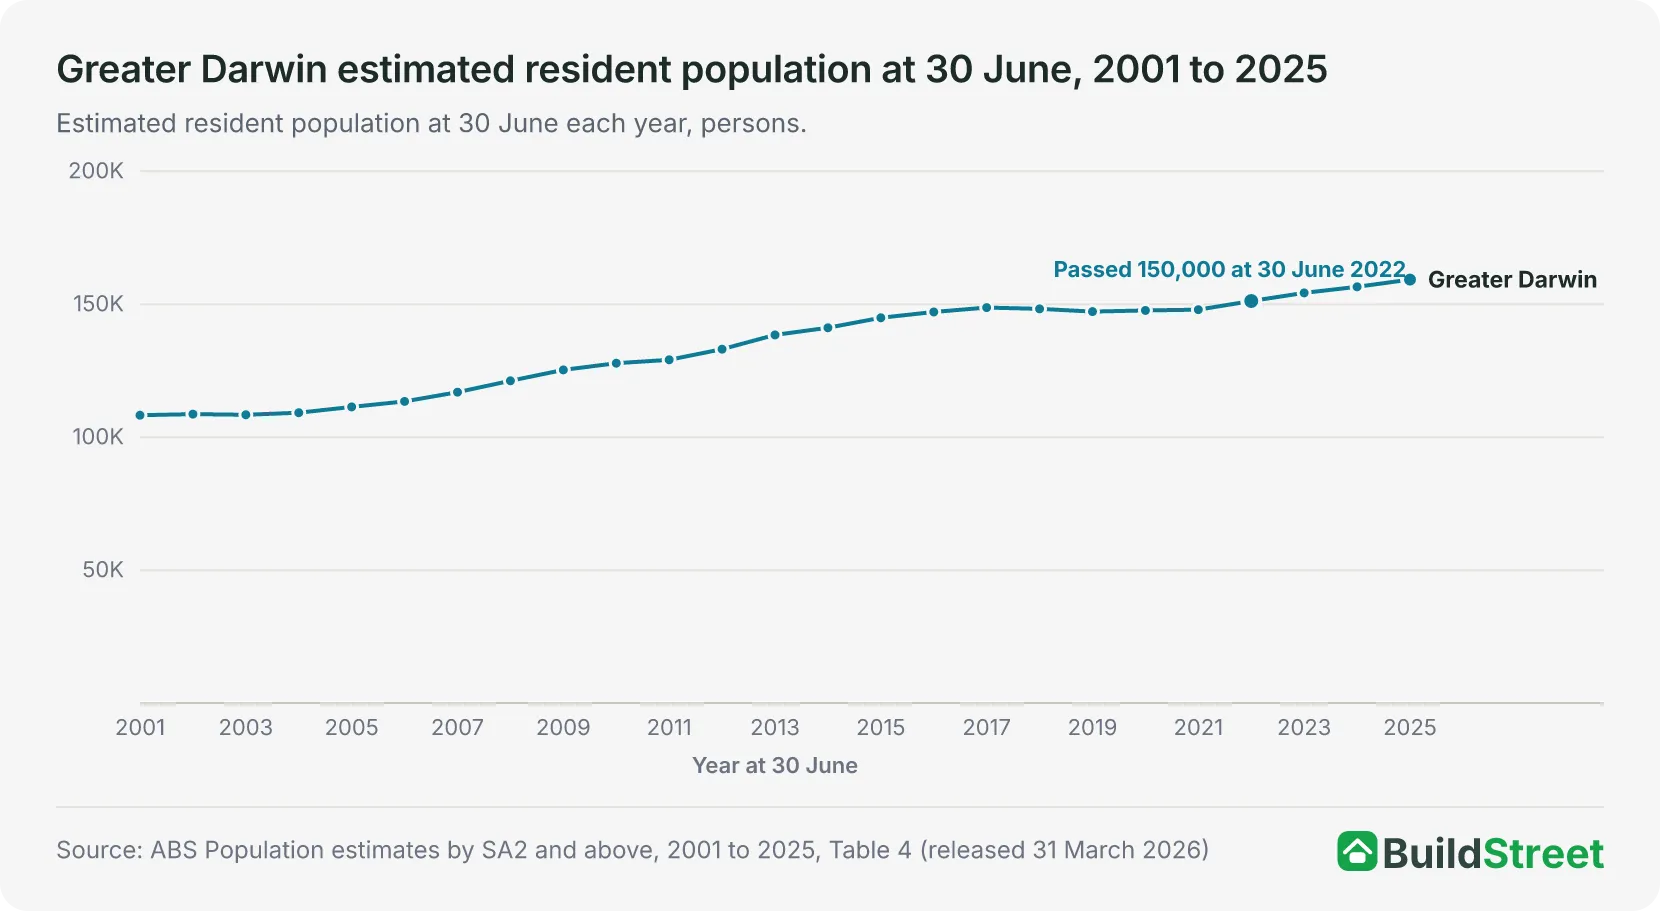
The city added 51,004 people between 30 June 2001 and 30 June 2025, growing from 108,280 to 159,284. The 2025 population was 1.47 times the size recorded in 20012.
The population fell from 148,752 at 30 June 2017 to 147,251 at 30 June 2019, a two-year decline of 1,501 people, and did not regain its 2017 level until 30 June 2022, when it reached 151,2152.
Greater Darwin first exceeded 120,000 people at 30 June 2008, 130,000 at 30 June 2012, 140,000 at 30 June 2014 and 150,000 at 30 June 2022. The 150,000 milestone took the longest to reach, coming eight years after the population passed 140,000. By comparison, it took two years to move from 130,000 to 140,0002.
| Greater Darwin population milestones in the annual series | ||
|---|---|---|
| Milestone | First 30 June at or above | Population that year |
| 120,000 | 30 June 2008 | 121,210 |
| 130,000 | 30 June 2012 | 133,105 |
| 140,000 | 30 June 2014 | 141,169 |
| 150,000 | 30 June 2022 | 151,215 |
Source · ABS Population estimates by SA2 and above, 2001 to 2025, Table 4
Section 08
Darwin population: quick answers
How many people live in Darwin?
Greater Darwin had an estimated resident population of 159,284 at 30 June 2025. That was the smallest population of Australia's eight capital cities and accounted for 0.6 per cent of the national total of 27,613,654 on the same date2. The 30 June 2025 estimates are preliminary. The next release, covering 30 June 2026, is due on 25 March 20271.
Is Darwin the smallest capital city in Australia?
Darwin was the smallest of the eight capital cities at 30 June 2025 on the ABS Greater Capital City Statistical Area boundaries, with 159,284 residents. Hobart, the next smallest, had 255,250 people and Canberra, the third smallest, had 484,6302.
How fast is Darwin's population growing?
Greater Darwin added 2,719 people, or 1.74 per cent, over the 2024-25 financial year. The ABS capital city data rounds the growth rate to 1.7 per cent, while the Northern Territory summary rounds the increase to 2,700 people1. Growth peaked at 5,366 people (4.03 per cent) in 2012-13, and the population fell in three years between 2001-02 and 2024-25: 2002-03, 2017-18 and 2018-192.
When did Darwin's population pass 150,000?
Greater Darwin first exceeded 150,000 people at 30 June 2022, with 151,215 residents. The city had passed 140,000 at 30 June 2014. The population then fell in 2017-18 and 2018-19, so it took eight years to move from the 140,000 milestone to the 150,000 milestone2.
Section 09
Australia population statistics
References
- ABS Regional population, 2024-25 · Australian Bureau of Statistics ↑ b c d e f g h i
- ABS Regional population, 2024-25: population estimates by SA2 and above, 2001 to 2025 (datacube 32180DS0003) · Australian Bureau of Statistics ↑ b c d e f g h i j k l m n o p q
- ABS Regional population, 2024-25: population components by SA2 and above, 2021-22 to 2024-25 (datacube 32180DS0005) · Australian Bureau of Statistics ↑ b c
- ABS Regional population, 2024-25: population estimates and components by SA2, 2024 to 2025 (datacube 32180DS0001) · Australian Bureau of Statistics ↑ b
- ABS Regional population methodology, 2024-25 · Australian Bureau of Statistics
