

Published 2 Sept 2026 · Updated 15 Sept 2026
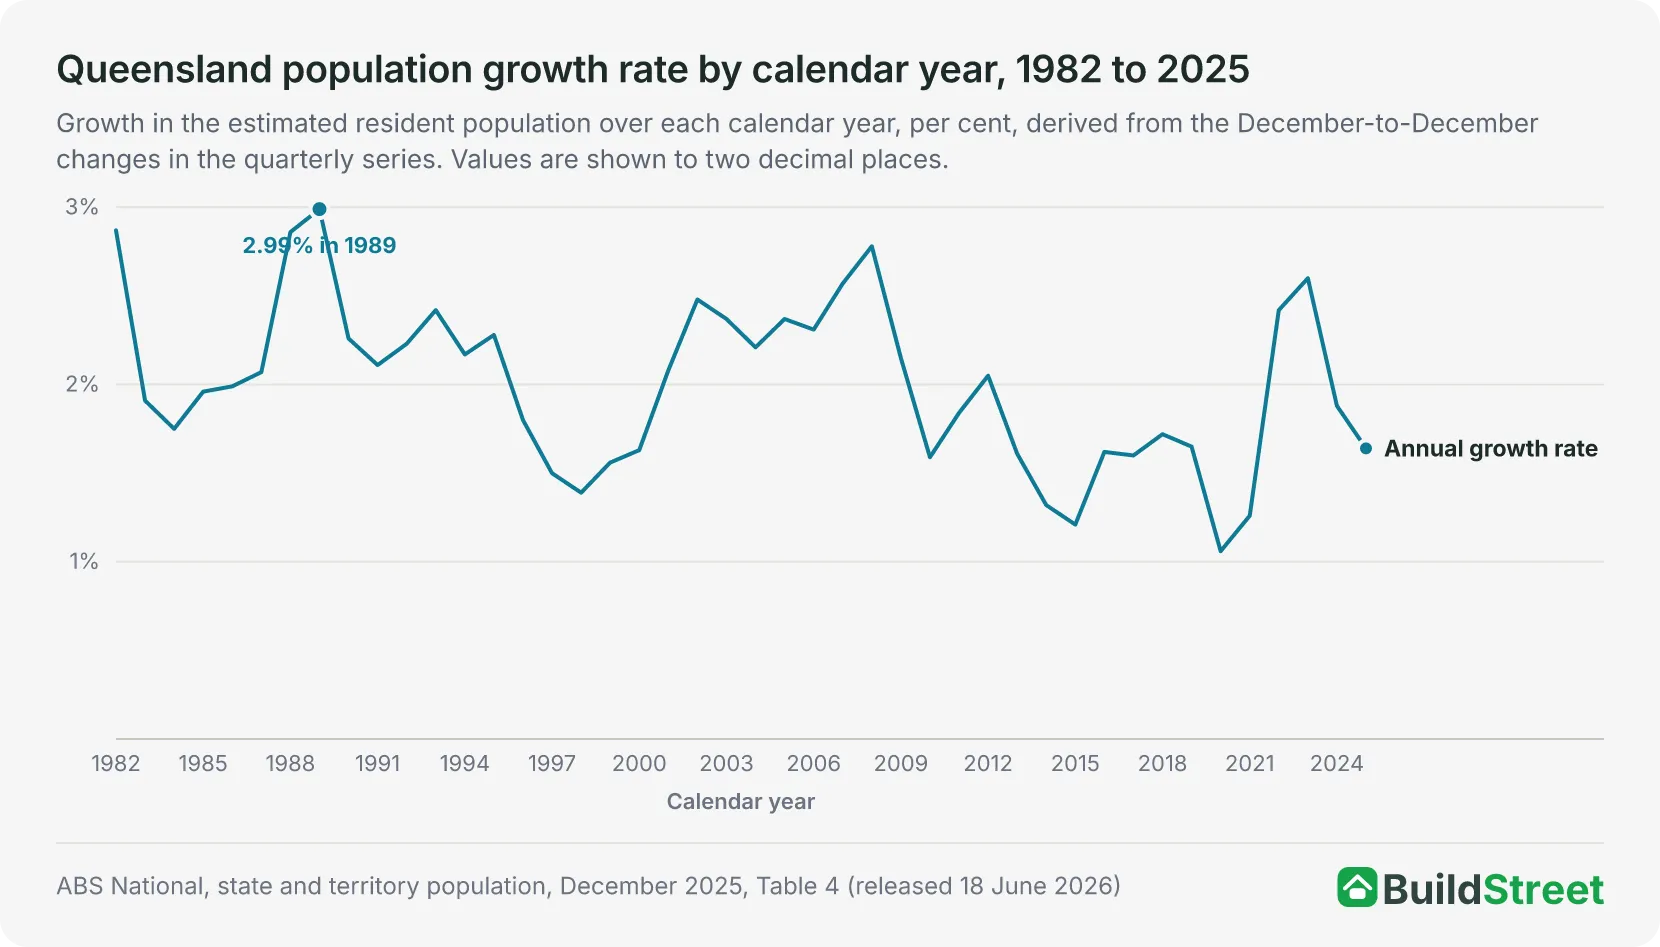 The state pictureQueensland had an estimated resident population of 5,669,764 at 30 June 2025 in the ABS annual series, an increase of 97,874 people, or 1.76 per cent, over 2024-25. The state article covers the total, its drivers and the split between Greater Brisbane and the rest of the state.
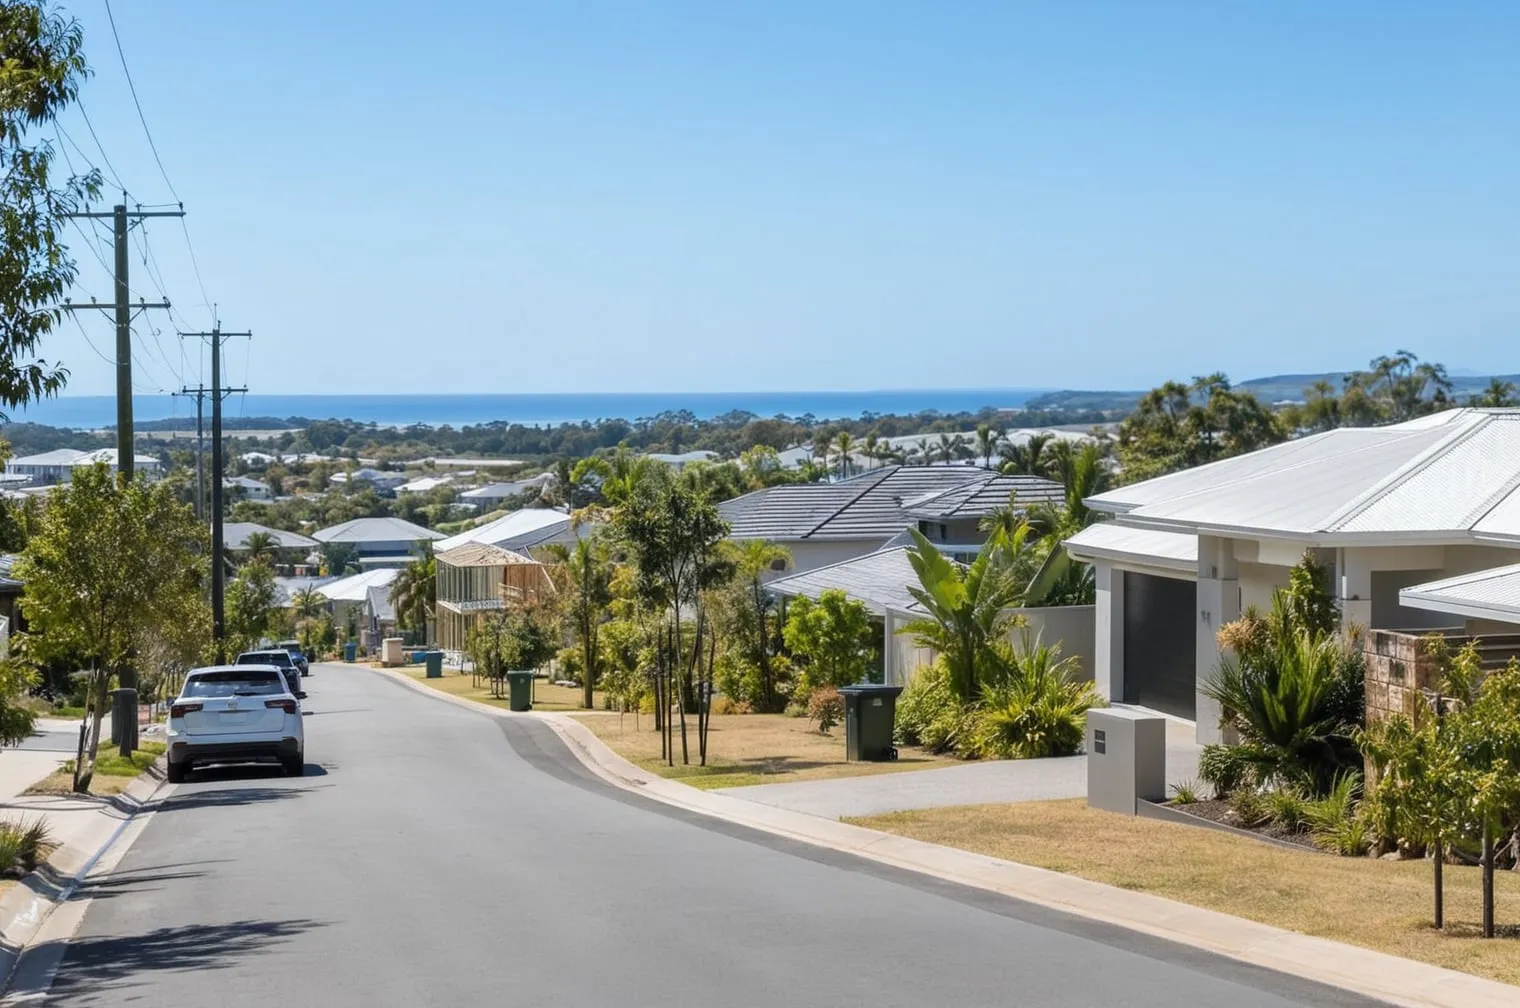 The wider urban areaThe ABS counts the Noosa statistical areas within the Sunshine Coast Significant Urban Area, which held 424,741 people at 30 June 2025. The Sunshine Coast article covers that urban area and the Sunshine Coast council area.
Section 01 · The headline number
How many people live in Noosa?
Noosa Shire had an estimated resident population of 59,551 at 30 June 2025. This ranked it 16th among Queensland's 78 council areas. Its population was lower than Gladstone's 69,046 and slightly higher than Gympie's 58,487. The shire accounted for 1.05 per cent of Queensland's 5,669,764 people and 0.22 per cent of Australia's 27,613,654 people1.
The estimate includes everyone who usually lives in Noosa Shire, regardless of nationality, citizenship or legal status. Overseas visitors staying in Australia for less than 12 months within a 16-month period are excluded. Holidaymakers and other short-stay visitors are therefore not included, while people who live elsewhere in Australia are counted at their usual address2.
The ABS publishes population estimates annually for 30 June. The estimate for 2025 is preliminary. The next release, covering 30 June 2026, is due on 25 March 20271.
Section 02 · The pace
How fast is Noosa Shire's population growing?
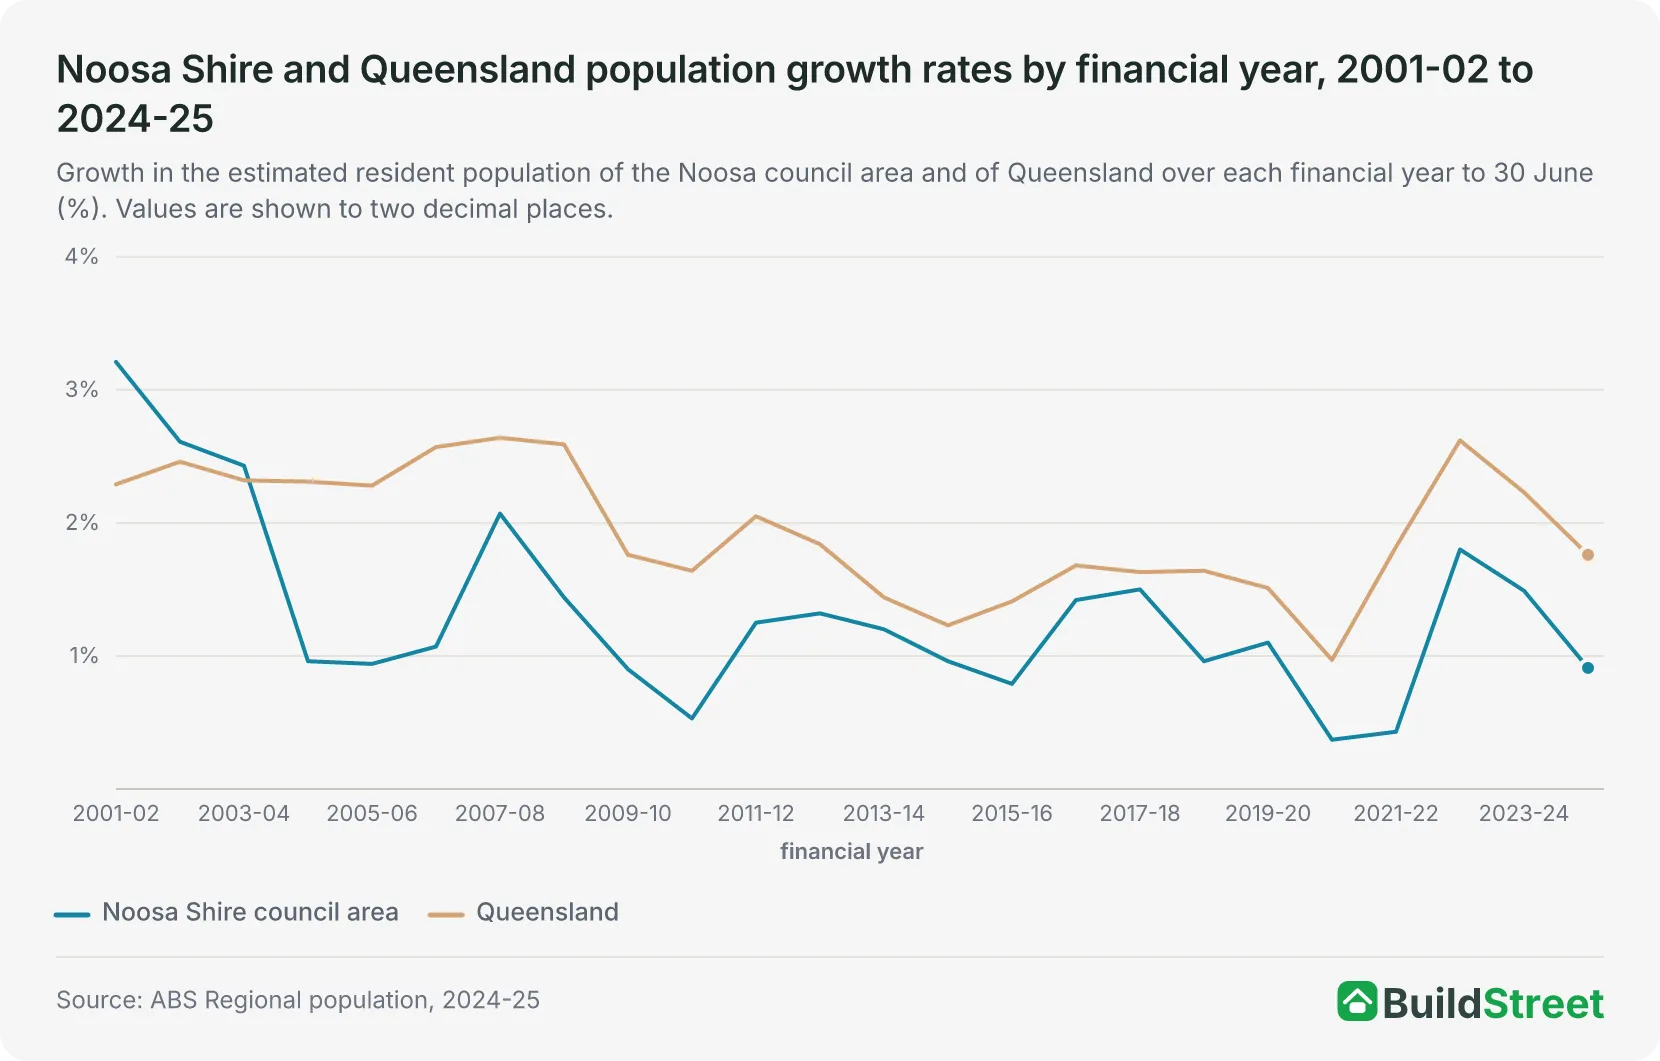
Noosa Shire grew by 536 people, or 0.91 per cent, in 2024-25. It increased from 59,015 at 30 June 2024 to 59,551 at 30 June 2025. The rate was the lowest since 2021-22, when the shire added 247 people, or 0.43 per cent. Growth then picked up in 2022-23 and 2023-24. The shire added 1,026 people, or 1.80 per cent, in 2022-23 and 868 people, or 1.49 per cent, in 2023-241.
Queensland's population grew by 1.76 per cent over the same year, from 5,571,890 to 5,669,764, while the Rest of Queensland region outside Greater Brisbane grew 1.42 per cent. Noosa Shire grew more slowly than both areas, and its growth rate ranked 42nd among Queensland's 78 council areas1.
The shire's population increased in each of the 24 financial years from 2001-02. However, its growth rate exceeded Queensland's only in the first three years. Annual growth ranged from 3.21 per cent in 2001-02, when the shire added 1,397 people, to 0.37 per cent in 2020-21, when it added 212 people. The shire recorded five annual increases of more than 1,000 people, most recently in 2022-231.
Section 03 · The drivers
What drives population change in Noosa Shire?
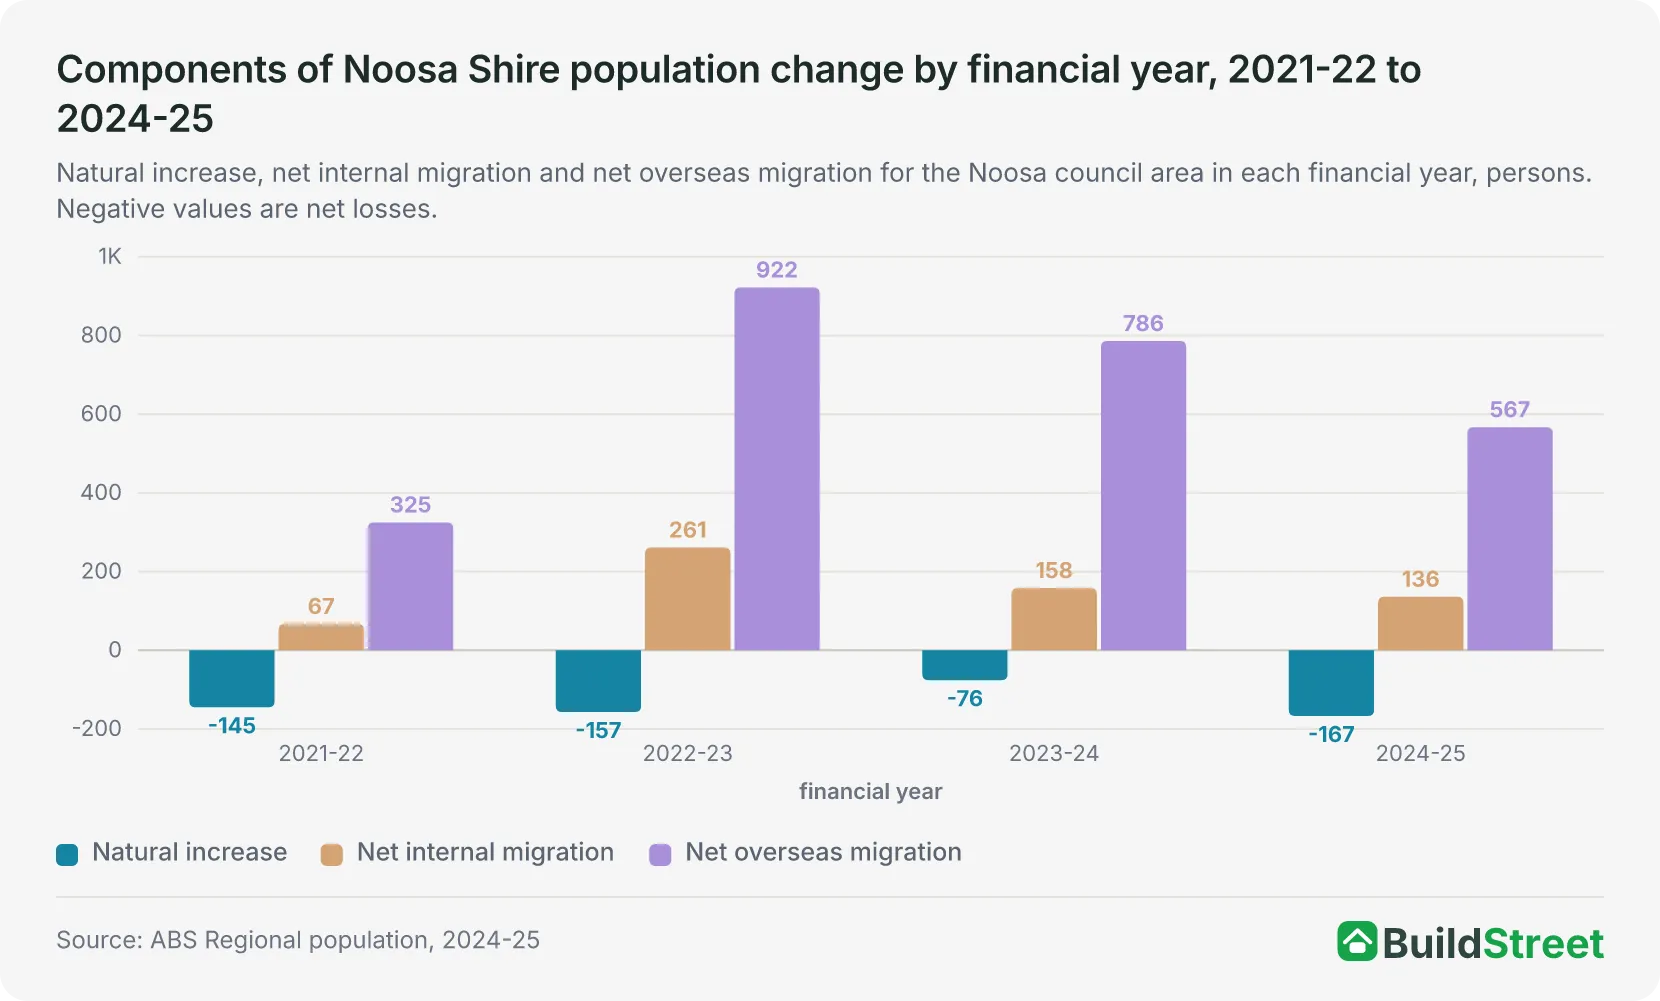
All of Noosa Shire's population growth in 2024-25 came from migration. Net overseas migration added 567 people, the largest of the three components, while net internal migration added 136. Together, the two forms of migration added 703 people. Deaths exceeded births by 167, with 368 births and 535 deaths, leaving an overall population increase of 5361.
Deaths exceeded births in each of the four financial years from 2021-22 to 2024-25, and net overseas migration was the largest component in each. Over the four years combined, deaths exceeded births by 545, net overseas migration added 2,600 people and net internal migration added 622. Together, these changes increased the shire's population by 2,6771.
Far more people moved into and out of the shire than the net migration figures suggest. In 2024-25, 4,005 people moved into the shire from elsewhere in Australia and 3,869 moved out, a net gain of 136. Over the same year, 1,030 people arrived from overseas while 463 left, resulting in a net gain of 567. Overseas arrivals were highest in 2022-23, at 1,2641.
| Components of Noosa Shire population change by financial year, 2021-22 to 2024-25 | ||||
|---|---|---|---|---|
| Component | 2021-22 | 2022-23 | 2023-24 | 2024-25 |
| Births | 386 | 354 | 392 | 368 |
| Deaths | 531 | 511 | 468 | 535 |
| Natural increase | -145 | -157 | -76 | -167 |
| Internal arrivals | 5,027 | 4,144 | 4,634 | 4,005 |
| Internal departures | 4,960 | 3,883 | 4,476 | 3,869 |
| Net internal migration | +67 | +261 | +158 | +136 |
| Overseas arrivals | 658 | 1,264 | 1,194 | 1,030 |
| Overseas departures | 333 | 342 | 408 | 463 |
| Net overseas migration | +325 | +922 | +786 | +567 |
| Total change | +247 | +1,026 | +868 | +536 |
Source · ABS Population components by LGA, 2021-22 to 2024-25, Table 1.
Section 04 · The growth areas
Where in the Noosa area is the population growing fastest?
Sunshine Beach had the fastest population growth rate among the seven Noosa statistical areas in 2024-25. Its population increased by 1.54 per cent, adding 114 people to reach 7,524. The Noosa Hinterland area, the largest of the seven at 26,251 people, recorded the largest increase, at 347 people, or 1.34 per cent. Peregian Springs added 127 people, or 1.08 per cent. Noosa Heads, Peregian Beach - Marcus Beach and Noosaville each grew by less than 1 per cent. Tewantin, which had 10,660 people, added 13, or 0.12 per cent, and recorded the slowest rate of the seven1.
Deaths exceeded births in five of the seven areas in 2024-25. Tewantin recorded the largest natural decrease, at 84 people, followed by Noosaville at 45, Noosa Heads at 30, the Noosa Hinterland at 25 and Peregian Springs at eight. Sunshine Beach recorded a natural increase of seven and Peregian Beach - Marcus Beach one of 15.
All seven areas recorded positive net overseas migration, from 53 people in Peregian Beach - Marcus Beach to 126 in Sunshine Beach. Net internal migration added 250 people to the Noosa Hinterland, 23 to Peregian Springs and 10 to Tewantin. The other four areas recorded net internal migration losses.
Population density also varied across the seven areas. Peregian Springs was the most densely populated at 30 June 2025, with 1,968 people per square kilometre across 6.1 square kilometres. The Noosa Hinterland was the least dense, with 32.0 people per square kilometre across 820.1 square kilometres1.
Across the four financial years from 2021-22 to 2024-25, deaths exceeded births every year in Tewantin, Noosaville and Noosa Heads. The combined natural decreases were 358 in Tewantin, 212 in Noosaville and 113 in Noosa Heads1.
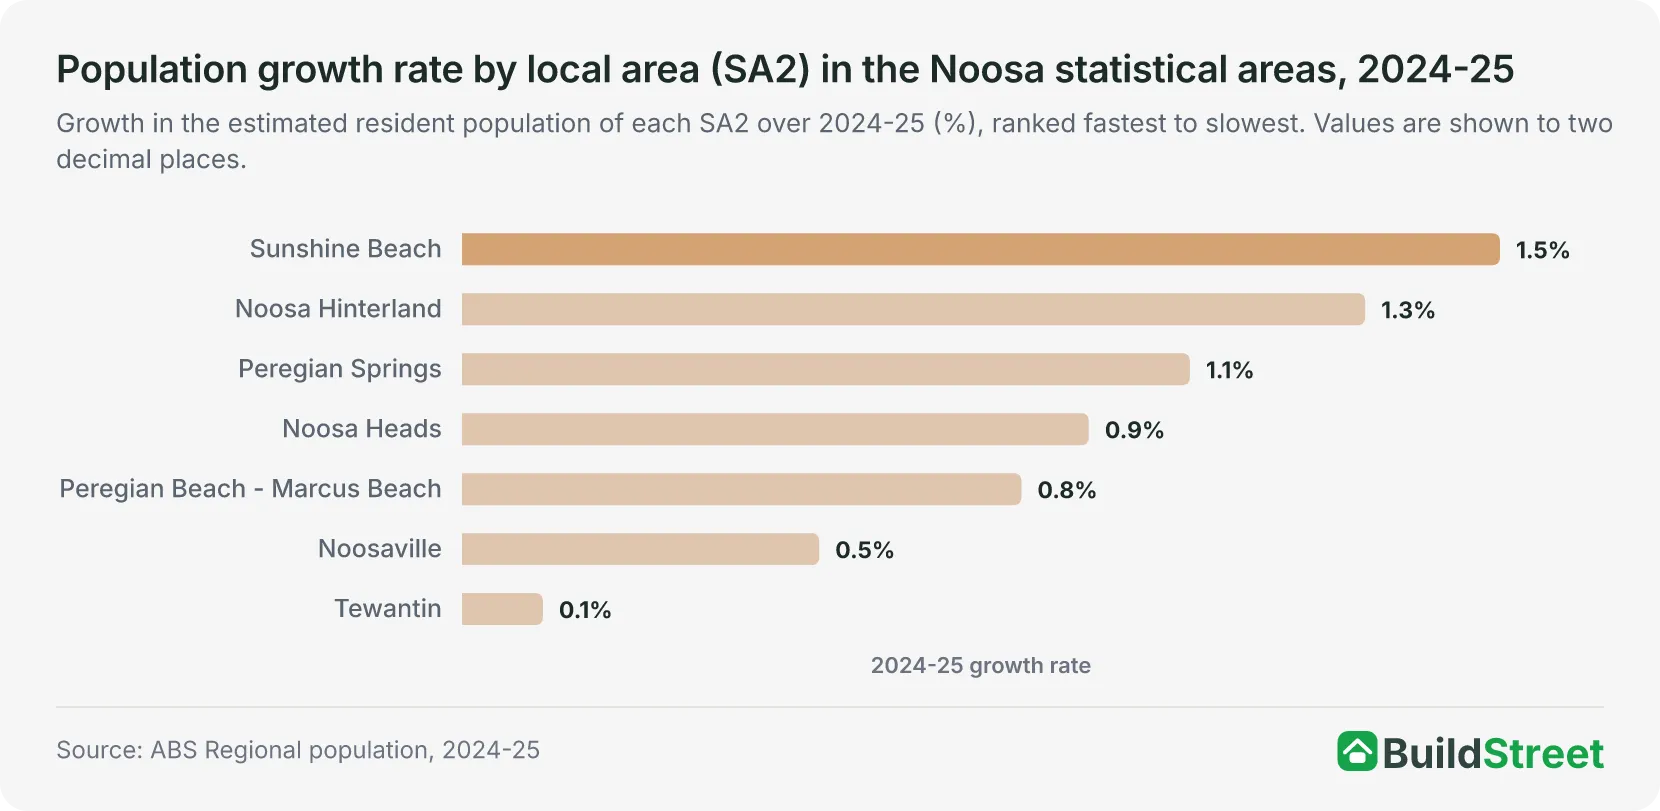
| The Noosa statistical areas (SA2) by population growth, 2024-25 | ||||||
|---|---|---|---|---|---|---|
| Area (SA2) | 30 June 2025 | Change | Growth rate % | Natural increase | Net internal migration | Net overseas migration |
| Sunshine Beach | 7,524 | +114 | 1.54 | +7 | -19 | +126 |
| Noosa Hinterland | 26,251 | +347 | 1.34 | -25 | +250 | +122 |
| Peregian Springs | 11,924 | +127 | 1.08 | -8 | +23 | +112 |
| Noosa Heads | 5,319 | +49 | 0.93 | -30 | -17 | +96 |
| Peregian Beach - Marcus Beach | 4,374 | +36 | 0.83 | +15 | -32 | +53 |
| Noosaville | 9,634 | +51 | 0.53 | -45 | -6 | +102 |
| Tewantin | 10,660 | +13 | 0.12 | -84 | +10 | +87 |
Source · ABS Population estimates and components by SA2, 2024 to 2025, Table 3.
Section 05 · The neighbours
How does Noosa Shire compare with the Gympie and Sunshine Coast council areas?
Noosa Shire grew more slowly in 2024-25 than either of the two council areas adjoining it. The Sunshine Coast council area added 7,659 people, or 2.05 per cent, to reach 381,957. Gympie added 1,170, or 2.04 per cent, to reach 58,487, compared with Noosa Shire's 536 people, or 0.91 per cent1.
Net internal migration was the largest component in both neighbouring council areas in 2024-25. It added 4,159 people to the Sunshine Coast council area and 1,015 to Gympie, compared with 136 in Noosa Shire. Noosa Shire differed from its neighbours because net overseas migration was its largest component, adding 567 people. Net overseas migration added 2,920 people to the Sunshine Coast council area and 160 to Gympie.
Deaths also exceeded births in Gympie, resulting in a natural decrease of five people from 564 births and 569 deaths. Noosa Shire recorded a natural decrease of 167 people. In contrast, the Sunshine Coast council area recorded a natural increase of 580, from 3,479 births and 2,899 deaths1.
Over the 24 years from 30 June 2001, the Sunshine Coast council area grew by 92.0 per cent, from 198,931 to 381,957. Gympie grew by 53.7 per cent, from 38,062 to 58,487. Noosa Shire grew by 36.9 per cent, from 43,496 to 59,551. The population gap between Noosa Shire and Gympie narrowed from 5,434 people at 30 June 2001 to 1,064 at 30 June 20251.
| Noosa Shire and the two adjoining council areas, 2024-25 | |||||||
|---|---|---|---|---|---|---|---|
| Council area (LGA) | 30 June 2025 | Change | Growth rate % | Natural increase | Net internal migration | Net overseas migration | Growth since 2001 % |
| Sunshine Coast | 381,957 | +7,659 | 2.05 | +580 | +4,159 | +2,920 | 92.0 |
| Gympie | 58,487 | +1,170 | 2.04 | -5 | +1,015 | +160 | 53.7 |
| Noosa | 59,551 | +536 | 0.91 | -167 | +136 | +567 | 36.9 |
Source · ABS Population estimates and components by LGA, 2024 to 2025, Table 3, and ABS Population estimates by LGA, Significant Urban Area, Remoteness Area and electoral division, 2001 to 2025, Table 1.
Section 06 · The state picture
How does Noosa Shire compare with other Queensland council areas?
Noosa Shire's 0.91 per cent growth rate in 2024-25 ranked 42nd among the 78 Queensland council areas. Ipswich had the highest rate, at 3.53 per cent, followed by Logan at 3.05 per cent and Lockyer Valley at 2.39 per cent. Three council areas recorded population declines: Longreach, which fell by 0.11 per cent, Goondiwindi, which fell by 0.18 per cent, and Mount Isa, which fell by 0.75 per cent1.
Deaths exceeded births in 12 of the 78 council areas in 2024-25. Fraser Coast had the largest natural decrease, at 562 people. Noosa Shire had the second largest, at 167, and Bundaberg the third, at 153. Noosa Shire was one of six Queensland council areas where deaths exceeded births in each of the four financial years from 2021-22. The others were Bundaberg, Fraser Coast, Hinchinbrook, North Burnett and Southern Downs. Across Australia, deaths exceeded births in 154 of the 542 council areas in 2024-25. Noosa Shire recorded the eighth-largest natural decrease among them1.
Net overseas migration was the largest of the three components in 17 of the 78 Queensland council areas in 2024-25, including Noosa Shire. Net internal migration was the largest in 20. Natural increase was the largest in 40. In Goondiwindi, natural increase and net overseas migration were equal at 39 people each.
Noosa Shire's net overseas migration of 567 ranked 12th among the 78 council areas. Across Queensland, net overseas migration added 55,673 people, net internal migration added 21,595 and natural increase added 20,6061.
The state figures are covered in the Queensland population article.
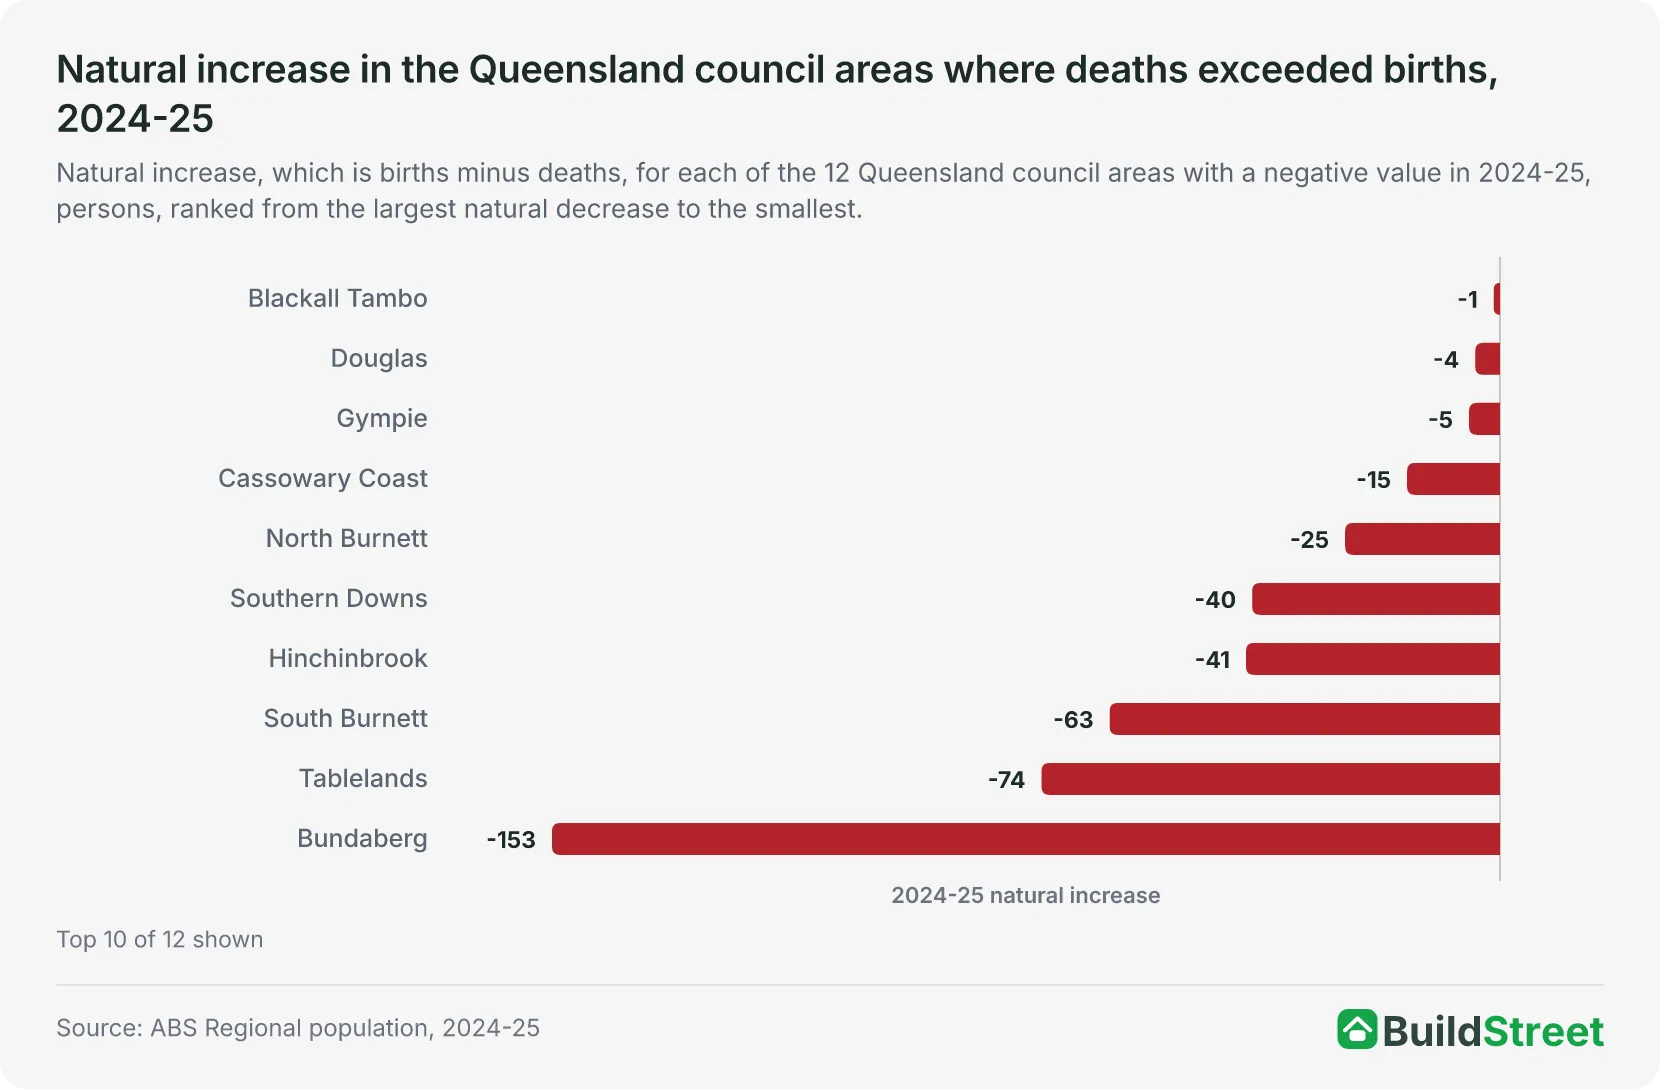
| Queensland council areas where deaths exceeded births, 2024-25 | ||||||
|---|---|---|---|---|---|---|
| Council area (LGA) | 30 June 2025 | Natural increase | Net internal migration | Net overseas migration | Total change | Growth rate % |
| Fraser Coast | 122,924 | -562 | +2,690 | +445 | +2,573 | 2.14 |
| Noosa | 59,551 | -167 | +136 | +567 | +536 | 0.91 |
| Bundaberg | 107,297 | -153 | +905 | +650 | +1,402 | 1.32 |
| Tablelands | 27,902 | -74 | +273 | +128 | +327 | 1.19 |
| South Burnett | 35,111 | -63 | +394 | +97 | +428 | 1.23 |
| Hinchinbrook | 11,194 | -41 | +86 | +19 | +64 | 0.58 |
| Southern Downs | 38,064 | -40 | +259 | +109 | +328 | 0.87 |
| North Burnett | 10,562 | -25 | +50 | +88 | +113 | 1.08 |
| Cassowary Coast | 30,666 | -15 | +85 | +231 | +301 | 0.99 |
| Gympie | 58,487 | -5 | +1,015 | +160 | +1,170 | 2.04 |
| Douglas | 13,169 | -4 | -36 | +171 | +131 | 1.00 |
| Blackall Tambo | 1,975 | -1 | +9 | +5 | +13 | 0.66 |
Source · ABS Population estimates and components by LGA, 2024 to 2025, Table 3.
Section 07 · The long run
How has Noosa Shire's population changed since 2001?
Noosa Shire's population increased by 16,055 people between 30 June 2001 and 30 June 2025, from 43,496 to 59,551. This was an increase of 36.9 per cent. Over the same 24 years, Queensland's population grew by 58.8 per cent, from 3,571,469 to 5,669,764. Noosa Shire's long-term growth rate ranked 24th among 78 Queensland council areas1.
Growth was faster in the first half of the period than in the second. The shire added 8,864 people, or 20.4 per cent, between 30 June 2001 and 30 June 2013. It added a further 7,191 people, or 13.7 per cent, between 30 June 2013 and 30 June 2025. The three largest annual increases occurred in the first three years of the period: 1,397 in 2001-02, 1,170 in 2002-03 and 1,120 in 2003-041.
A milestone year is the first 30 June when Noosa Shire's estimated population reached a given threshold. The shire first reached 45,000 people at 30 June 2003, 50,000 at 30 June 2009 and 55,000 at 30 June 20181. At 59,551, the shire was 449 people below 60,000 at 30 June 2025.
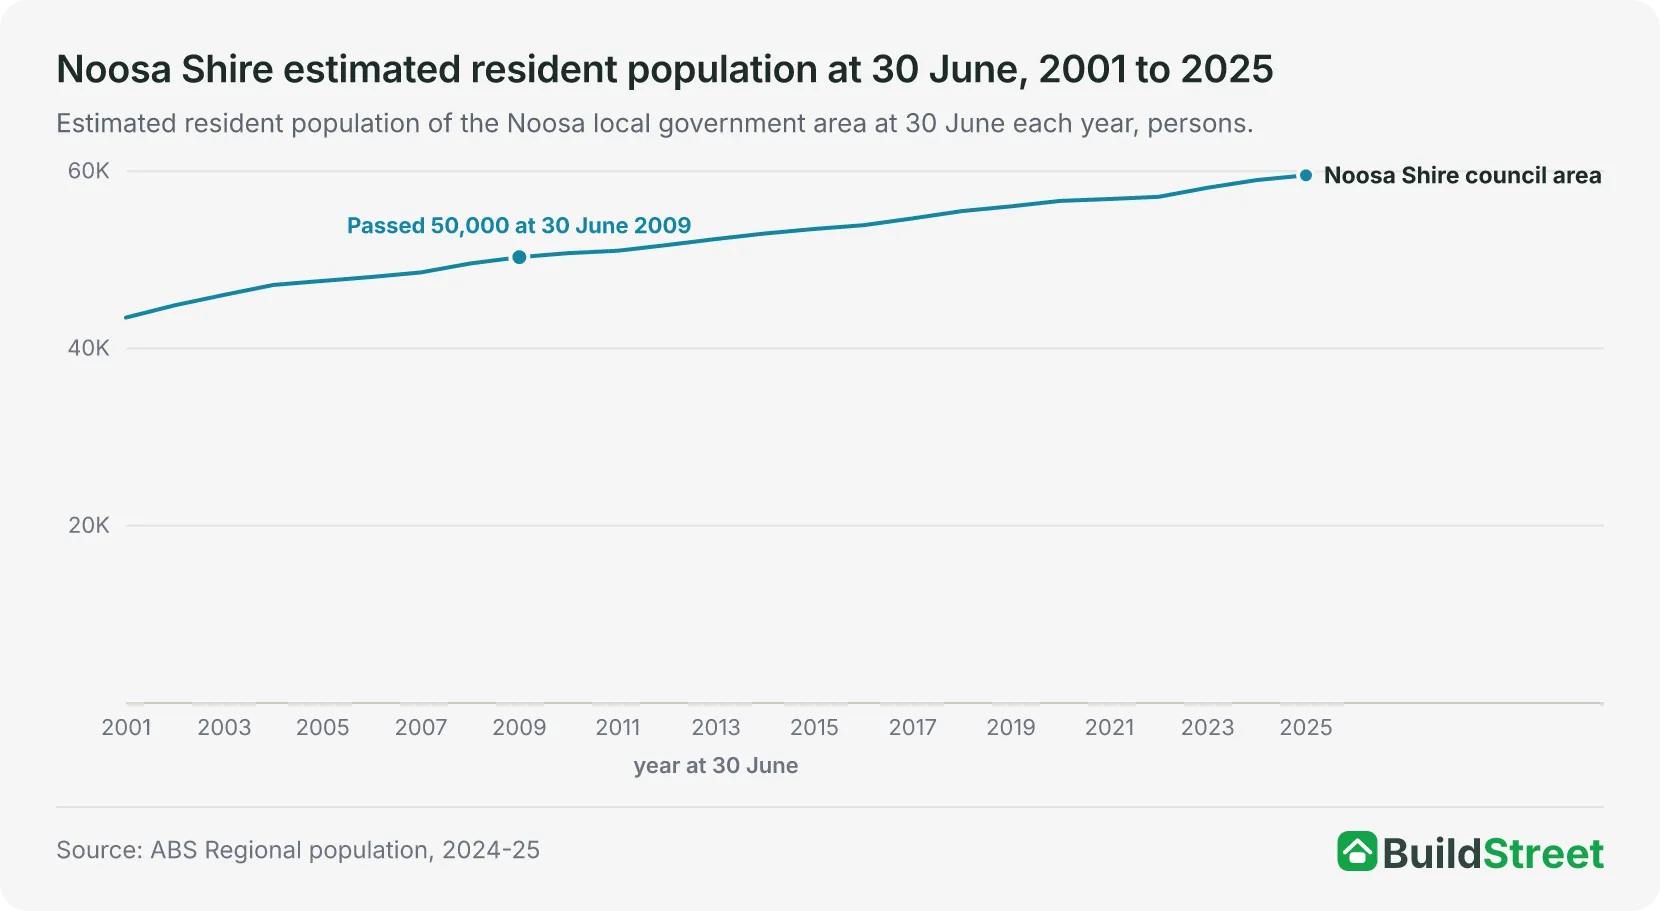
| Noosa Shire population milestones in the annual series | |||
|---|---|---|---|
| Milestone | First 30 June at or above | Population that year | Population the year before |
| 45,000 | 30 June 2003 | 46,063 | 44,893 |
| 50,000 | 30 June 2009 | 50,315 | 49,600 |
| 55,000 | 30 June 2018 | 55,511 | 54,688 |
Source · ABS Population estimates by LGA, Significant Urban Area, Remoteness Area and electoral division, 2001 to 2025, Table 1.
Section 08
Noosa population: quick answers
How many people live in Noosa?
Noosa Shire had an estimated resident population of 59,551 at 30 June 2025. The figure counts people at their usual address, not visitors, and the 30 June 2025 estimate is preliminary. The next release, covering 30 June 2026, is due on 25 March 2027.
Does Noosa have its own ABS urban area?
No. The ABS lists 19 Significant Urban Areas in Queensland, and none is named Noosa. The seven Noosa statistical areas, from Noosa Heads to the Noosa Hinterland, are allocated to the Sunshine Coast Significant Urban Area, which had 424,741 people at 30 June 2025. The headline population figure instead uses the Noosa council area, which had 59,551 people on the same date.
Is Noosa Shire's population growing?
Yes. Noosa Shire added 536 people, or 0.91 per cent, over the 2024-25 financial year, and its population increased in every year from 2001-02. The 2024-25 rate was about half of Queensland's 1.76 per cent growth rate and ranked 42nd among the 78 Queensland council areas.
How does Noosa Shire's population grow when deaths exceed births?
Noosa Shire's population grew through migration in each of the four financial years from 2021-22 to 2024-25, despite deaths exceeding births in every year. The shire recorded 368 births and 535 deaths, resulting in a natural decrease of 167 people. Net overseas migration added 567 people and net internal migration added 136, so the population increased by 536.
Does the Noosa population figure include tourists?
No. The estimated resident population counts people at their usual address. It includes usual residents who are overseas for less than 12 months over a 16-month period and excludes overseas visitors who are in Australia for less than 12 months over the same period. People whose usual address is elsewhere in Australia are counted at that address. The ABS Regional population data does not report visitor numbers or short-stay accommodation.
What are the populations of Tewantin, Noosaville and Noosa Heads?
Tewantin had an estimated resident population of 10,660 at 30 June 2025, Noosaville had 9,634 and Noosa Heads had 5,319, in the ABS statistical area (SA2) estimates. The other four Noosa statistical areas were the Noosa Hinterland at 26,251, Peregian Springs at 11,924, Sunshine Beach at 7,524 and Peregian Beach - Marcus Beach at 4,374. These areas have different boundaries from Noosa Shire and are estimated separately from the council area. Their combined population therefore differs from Noosa Shire's 59,551.
How does Noosa Shire compare with the Sunshine Coast and Gympie council areas?
Noosa Shire grew by 0.91 per cent in 2024-25, compared with 2.05 per cent in the Sunshine Coast council area and 2.04 per cent in Gympie. Net internal migration was the largest component of growth in both neighbours, adding 4,159 people in the Sunshine Coast council area and 1,015 in Gympie, while net overseas migration, at 567 people, was the largest in Noosa Shire. Deaths exceeded births in Noosa Shire, by 167, and in Gympie, by 5.
Section 09
Australia population statistics
References
- ABS Regional population, 2024-25 · Australian Bureau of Statistics ↑ b c d e f g h i j k l m n o p q r s t u v
- ABS Regional population methodology, 2024-25 · Australian Bureau of Statistics ↑
- ABS Australian Statistical Geography Standard (ASGS) Edition 3, Significant Urban Area allocation file (SUA_2021_AUST) · Australian Bureau of Statistics ↑
