

Published 2 Sept 2026 · Updated 16 Sept 2026
Australia recorded an estimated 299,984 births and 188,445 deaths in the year ending 31 December 2025, a natural increase of 111,539 people, according to the Australian Bureau of Statistics (ABS) National, state and territory population data. Natural increase accounted for 27.0 per cent of the year’s population growth of 412,494, while net overseas migration accounted for the remaining 300,955. The total fertility rate was 1.481 babies per woman in 2024, the lowest value since 1924, and life expectancy at birth was 81.1 years for males and 85.1 years for females in 2022-2024.
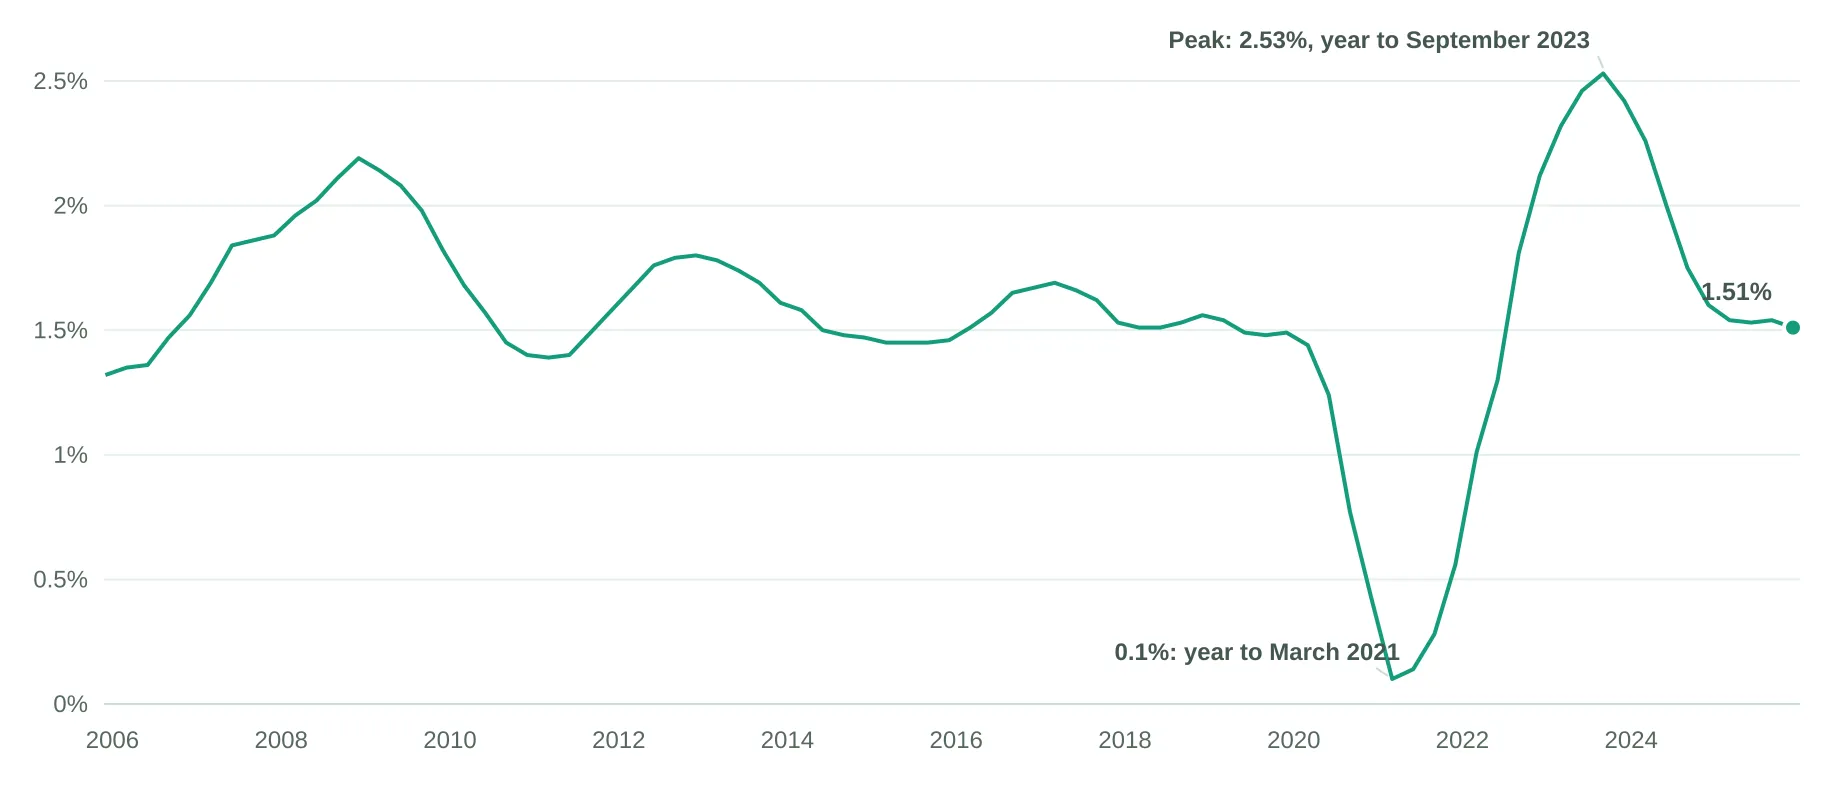 Australia’s populationAustralia’s estimated resident population was 27,801,023 at 31 December 2025, after growing by 412,494 people, or 1.51 per cent, over the year. The population article covers the total, the growth rate and how the components combine.
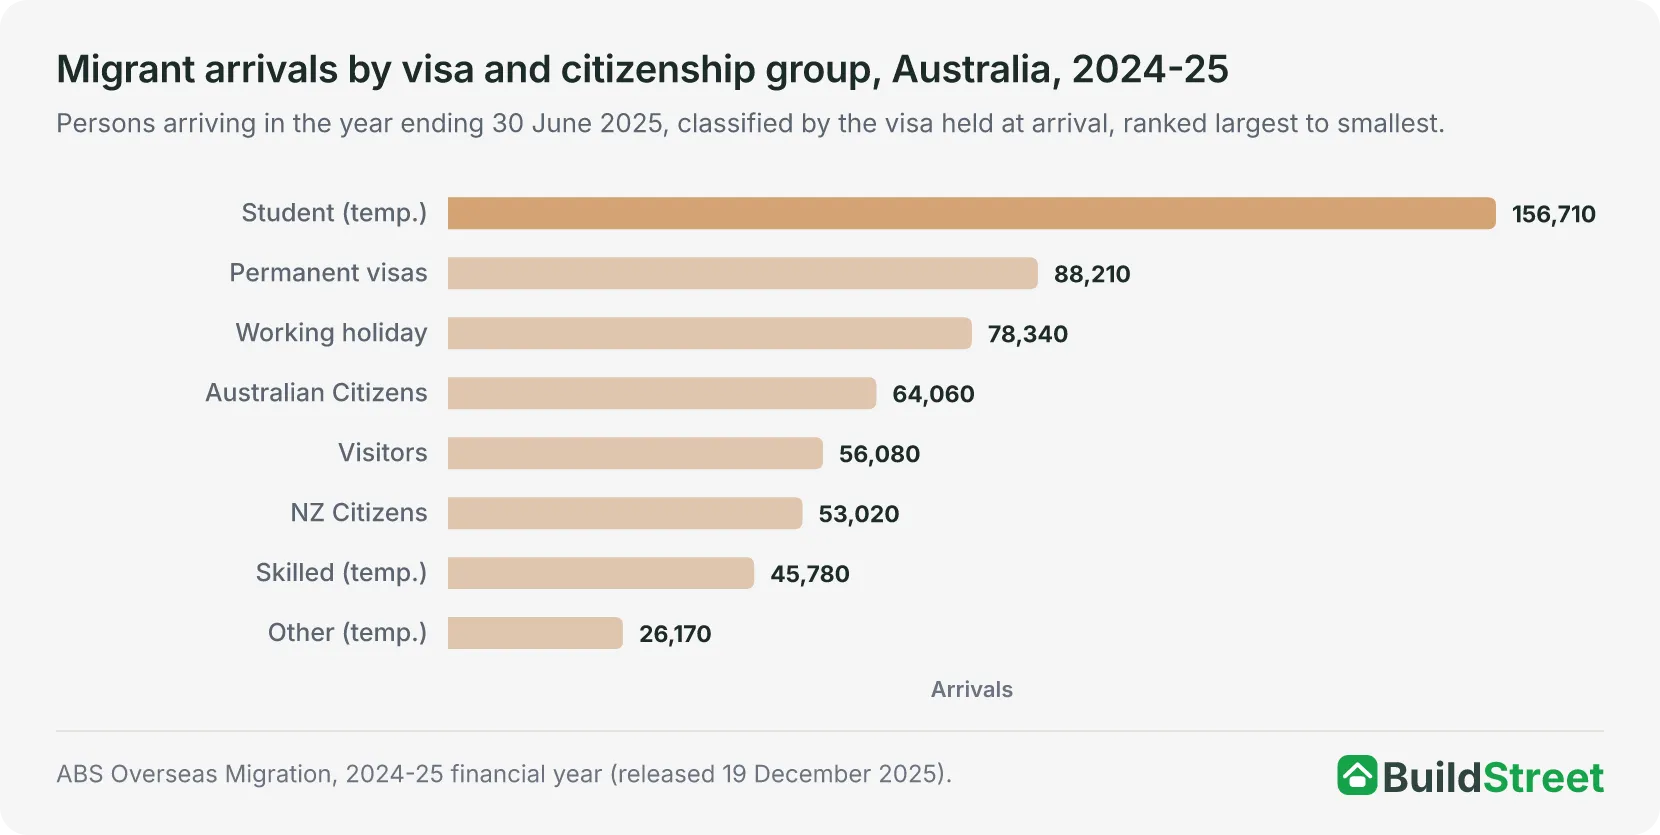 The other component: overseas migrationNet overseas migration added 300,955 people in the year ending 31 December 2025, or 73.0 per cent of the year’s growth. The overseas migration article covers arrivals, departures, visa groups and the state split.
Section 01 · The headline numbers
How many births and deaths does Australia record each year?
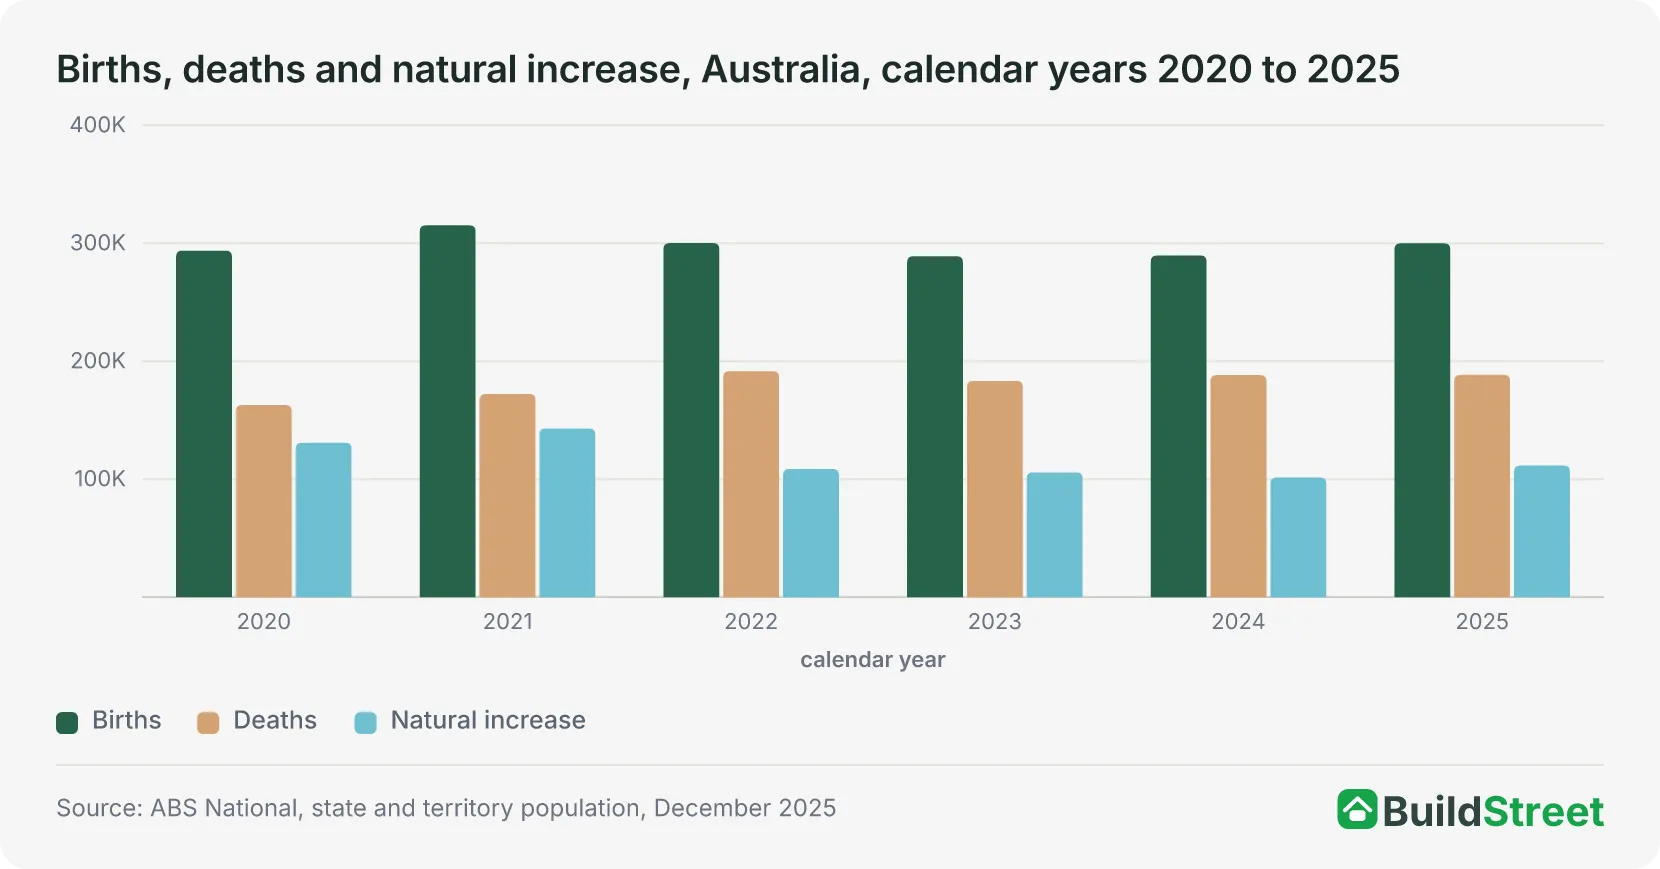
Australia had an estimated 299,984 births and 188,445 deaths in 2025, leaving a natural increase of 111,539 people1. Births increased from 289,649 in 2024 to 299,984 in 2025, a rise of 10,335, or 3.6 per cent. Deaths increased from 188,238 to 188,445, a rise of 207, or 0.1 per cent. Natural increase (births minus deaths) increased from 101,411 in 2024 to 111,539 in 2025, a rise of 10,128, or 10.0 per cent.
In the December quarter 2025, there were 68,541 births and 46,516 deaths, a natural increase of 22,025. That was the lowest quarterly natural increase since June 1981. The previous low was 22,875 in September 20221. The estimates from September 2024 are preliminary and will be revised.
In the annual registration data, registered births increased from 286,998 in 2023 to 292,318 in 2024, a rise of 5,320, or 1.9 per cent2. Registered deaths increased from 183,131 in 2023 to 187,268 in 2024, a rise of 4,1373. The ABS attributes part of the increase in registered births to changes in registration processing times in some states and territories. Victoria registered 9,422 more births than in 2023, an increase of 12.9 per cent, after a period of processing delays2. Registered births peaked at 315,147 in 2018, and every year from 2019 to 2024 was below that peak.
Section 02 · The growth arithmetic
How much of Australia’s population growth is natural increase?
Natural increase accounted for 27.0 per cent of Australia’s population growth in 2025, equal to 111,539 of the 412,494 people added1. Net overseas migration accounted for the remaining 300,955, or 73.0 per cent. The estimated resident population reached 27,801,023 at 31 December 2025, after growing 1.51 per cent over the year. At the national level, net interstate migration is zero, so natural increase and net overseas migration account for the year’s growth4.
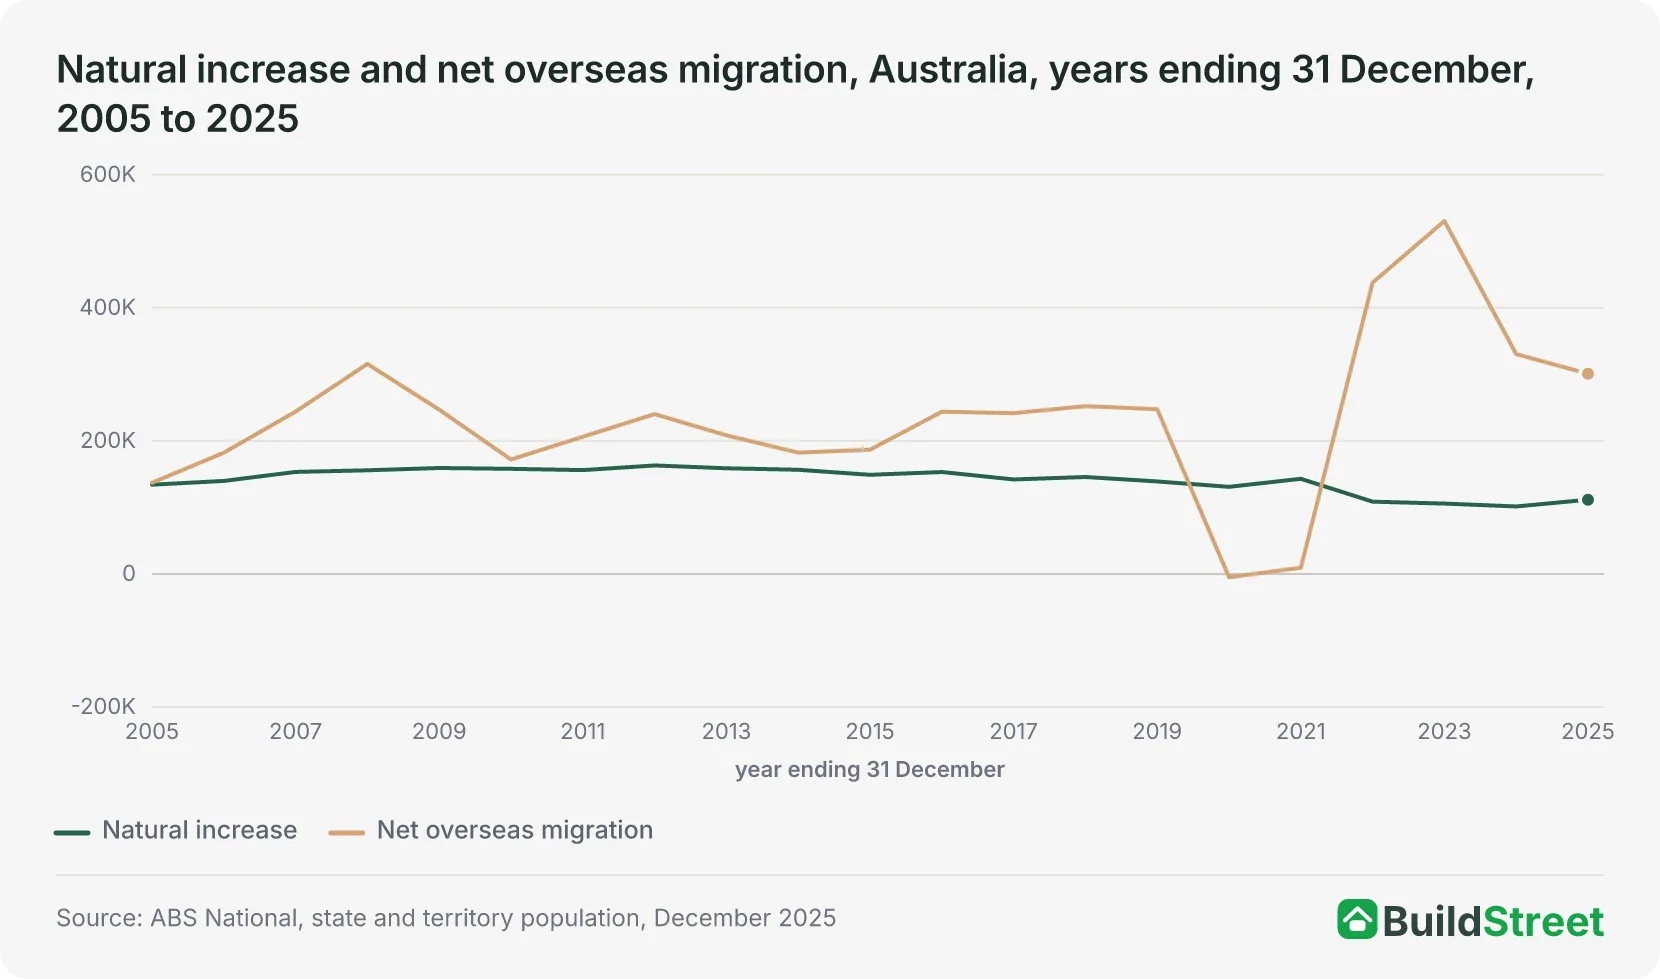
In 2024, natural increase of 101,411 accounted for 23.5 per cent of the year’s growth of 431,869, with net overseas migration at 330,458. These annual values are the totals across four quarters of ABS data. The 2024 natural increase was the lowest annual value in the data, which begins in 1981. The highest was 163,064 in 20121. In 2020, net overseas migration was negative, at -4,957, and natural increase of 130,926 exceeded the year’s total growth of 110,230.
Natural increase exceeded net overseas migration in 2020 and 2021 only, two of the 21 years from 2005 to 2025. Over those 21 years, natural increase ranged from 101,411 in 2024 to 163,064 in 2012, while net overseas migration ranged from -4,957 in 2020 to 530,620 in 20231.
Section 03 · Fertility
What is Australia’s birth rate and fertility rate?
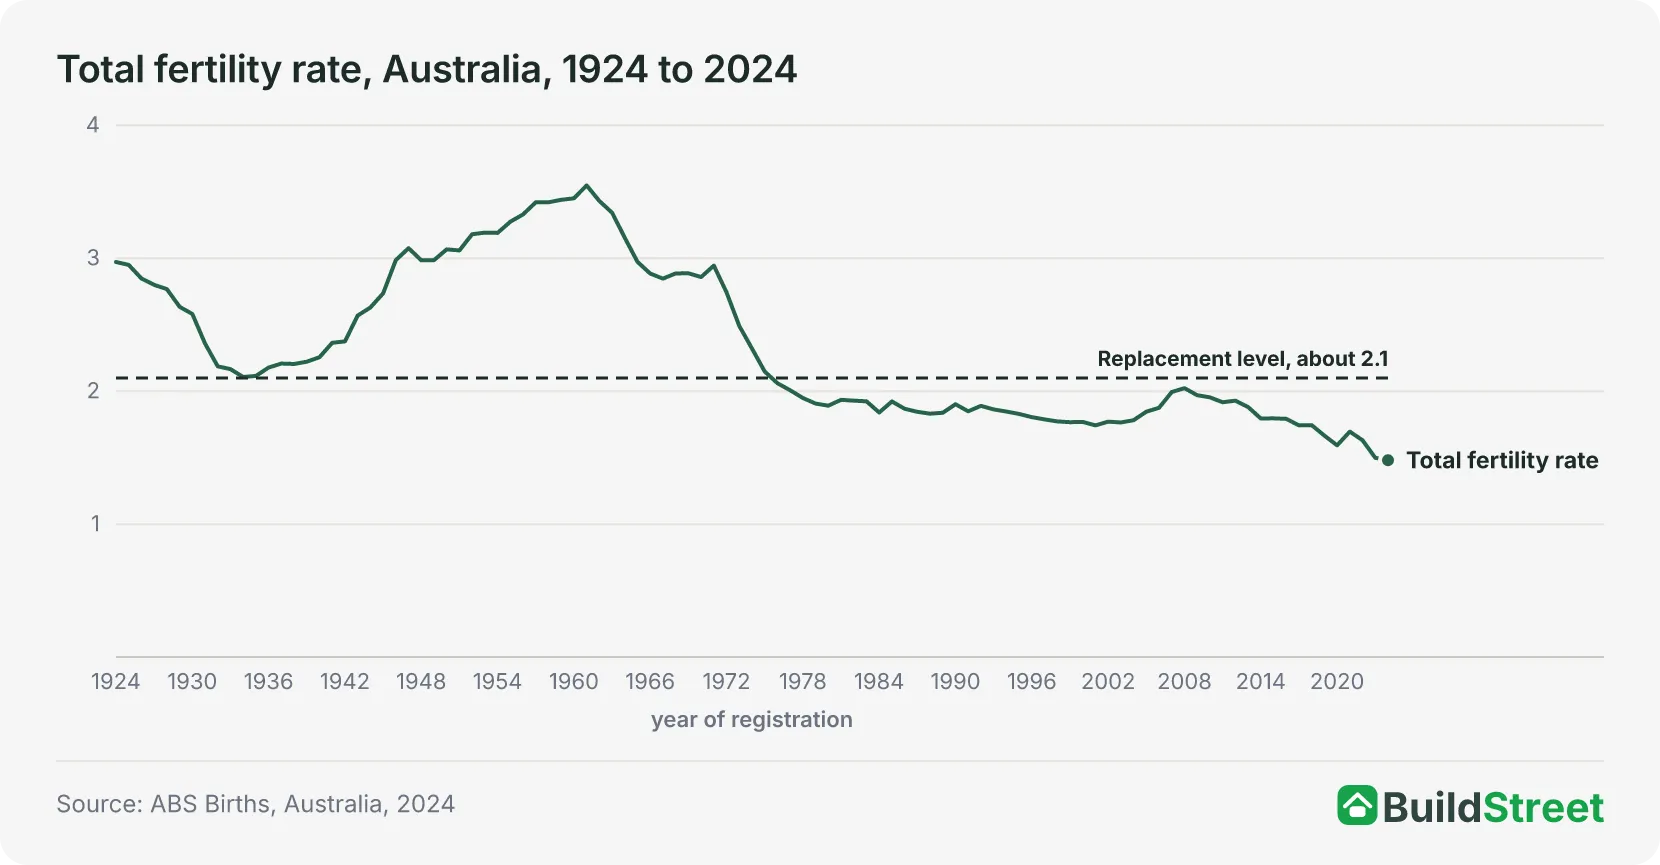
Australia’s total fertility rate was 1.481 babies per woman in 2024, the lowest value since 1924. The rate was 1.795 in 2014 and 1.499 in 2023. The crude birth rate, which measures births per 1,000 people in the estimated resident population, fell from 12.8 in 2014 to 10.7 in 20242.
The total fertility rate estimates how many children a woman would have over her lifetime if the age-specific fertility rates recorded in a single year applied at each age from 15 to 49. The ABS estimates the replacement level, the rate at which a generation replaces itself without overseas migration, at about 2.1 babies per woman5. Australia’s rate has been below 2.1 in every year since 1976, when it was 2.060, and it peaked at 3.548 in 19612.
Women aged 30 to 34 had the highest age-specific fertility rate in 2024, at 106.0 births per 1,000 women, an increase from 105.2 in 2023. Rates for women aged 15 to 29 decreased from 2023, and rates for women aged 30 to 49 increased. The median age of mothers was 32.1 years and of fathers 33.9 years2.
| Total fertility rate and median age of mothers by state and territory of usual residence, 2014, 2023 and 2024 | ||||
|---|---|---|---|---|
| State or territory | TFR 2014 | TFR 2023 | TFR 2024 | Median age of mothers 2024 (years) |
| Northern Territory | 2.041 | 1.551 | 1.629 | 30.5 |
| Victoria | 1.715 | 1.392 | 1.521 | 32.7 |
| Queensland | 1.910 | 1.544 | 1.505 | 31.2 |
| Tasmania | 1.963 | 1.514 | 1.485 | 31.1 |
| New South Wales | 1.723 | 1.548 | 1.460 | 32.2 |
| South Australia | 1.850 | 1.498 | 1.458 | 31.8 |
| Western Australia | 1.906 | 1.570 | 1.434 | 31.9 |
| Australian Capital Territory | 1.738 | 1.309 | 1.273 | 32.8 |
| Australia | 1.795 | 1.499 | 1.481 | 32.1 |
Source · ABS Births, Australia, 2024, states and territories tables
The Northern Territory had the highest total fertility rate of any state or territory in 2024, at 1.629 babies per woman, and the Australian Capital Territory the lowest, at 1.273. Every state and territory was below 2.1 in 2024 and below its 2014 rate. Victoria and the Northern Territory were the only two jurisdictions where the rate was higher than in 20232. The ABS advises caution when comparing the 2023 and 2024 counts for New South Wales, Victoria and Western Australia, where registration processing times changed.
Section 04 · Deaths and life expectancy
How many people die in Australia each year, and what is life expectancy?
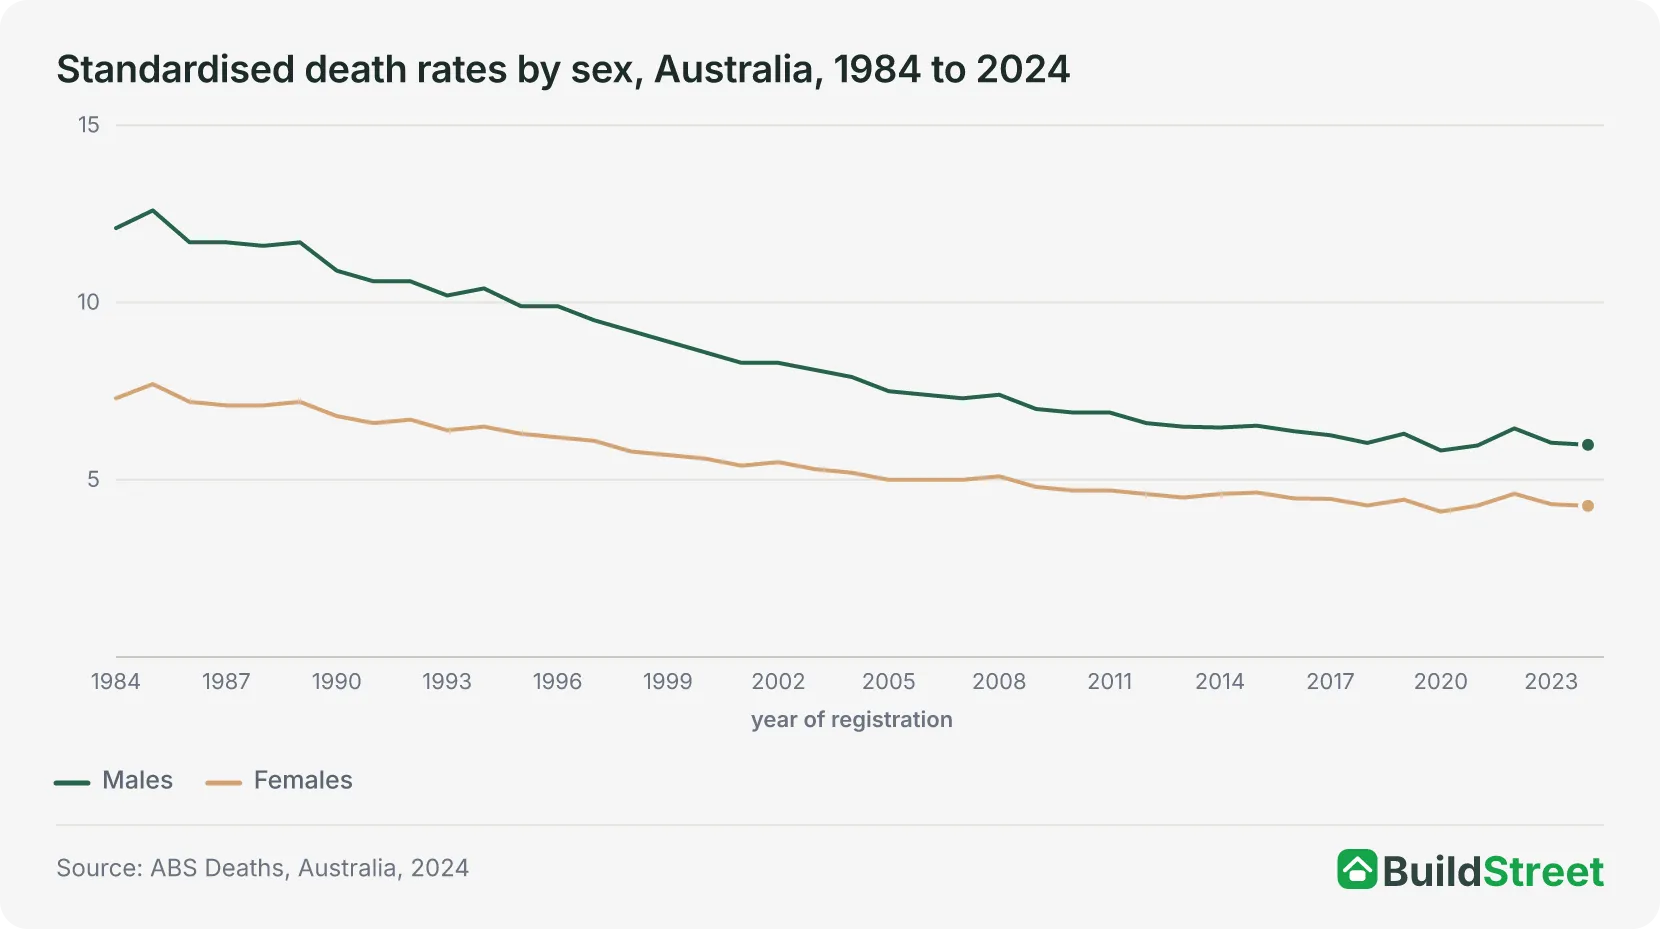
Australia recorded 187,268 registered deaths in 2024, up from 183,131 in 2023, an increase of 4,137. Of these, 98,467 were male and 88,801 were female. The standardised death rate fell from 5.471 deaths per 1,000 standard population in 2014 to 5.130 in 2023 and 5.078 in 20243. This rate removes the effect of the population’s changing age structure by applying the age distribution of the Australian population at 30 June 2001.
The median age at death in 2024 was 79.6 years for males and 84.7 years for females. The crude death rate increased from 6.875 deaths per 1,000 people in 2023 to 6.884 in 2024. There were 957 infant deaths, equal to an infant mortality rate of 3.27 deaths per 1,000 live births3.
The male death rate fell from 12.1 deaths per 1,000 standard population in 1984 to 5.988 in 2024, and the female rate fell from 7.3 to 4.266. Both rates increased in 2022, to 6.451 and 4.608 respectively, the highest values for each since 20153. Among the states and territories, Queensland recorded the largest increase in registered deaths from 2023 to 2024, at 2,279, while the Northern Territory recorded the only decrease, of 14 deaths. The Northern Territory had the highest standardised death rate in 2024, at 6.423, and the Australian Capital Territory the lowest, at 4.559.
Life expectancy at birth was 81.1 years for males and 85.1 years for females in 2022-2024, unchanged from 2021-2023. Life expectancy fell from 81.3 years for males and 85.4 years for females in 2019-2021 to 81.2 and 85.3 in 2020-2022 and 81.1 and 85.1 in 2021-2023. These were the first decreases since the mid-1990s. In 1994, life expectancy at birth was 75.0 years for males and 80.9 for females, so the difference between the sexes narrowed from 5.9 years to 4.0 years6.
The 2022-2024 period was affected by the COVID-19 pandemic. Deaths increased by almost 20,000 between 2021 and 2022, and COVID-19 caused more than 10,000 deaths in 2022, around 5,000 in 2023 and around 4,000 in 20246.
The Australian Capital Territory had the highest life expectancy at birth in 2022-2024, at 82.0 years for males and 85.8 years for females. The Northern Territory had the lowest, at 77.0 years for males and 80.7 years for females. The Northern Territory also had the largest increase from 2021-2023, of 0.6 years for males and 0.3 years for females6.
Australia’s age profile is covered in the median age article.
| Life expectancy at birth by state and territory of usual residence, 2012-2014 and 2022-2024 | ||||
|---|---|---|---|---|
| State or territory | Males 2012-2014 | Males 2022-2024 | Females 2012-2014 | Females 2022-2024 |
| Australian Capital Territory | 81.4 | 82.0 | 85.2 | 85.8 |
| Western Australia | 80.5 | 81.5 | 84.9 | 85.7 |
| Victoria | 81.1 | 81.5 | 84.7 | 85.4 |
| New South Wales | 80.2 | 81.2 | 84.4 | 85.3 |
| South Australia | 80.1 | 80.9 | 84.3 | 84.9 |
| Queensland | 79.9 | 80.5 | 84.2 | 84.7 |
| Tasmania | 78.8 | 80.3 | 82.5 | 83.7 |
| Northern Territory | 75.4 | 77.0 | 78.9 | 80.7 |
| Australia | 80.3 | 81.1 | 84.4 | 85.1 |
Source · ABS Life expectancy, 2022-2024, states and territories tables
Section 05 · States and territories
Which states and territories have the highest natural increase?
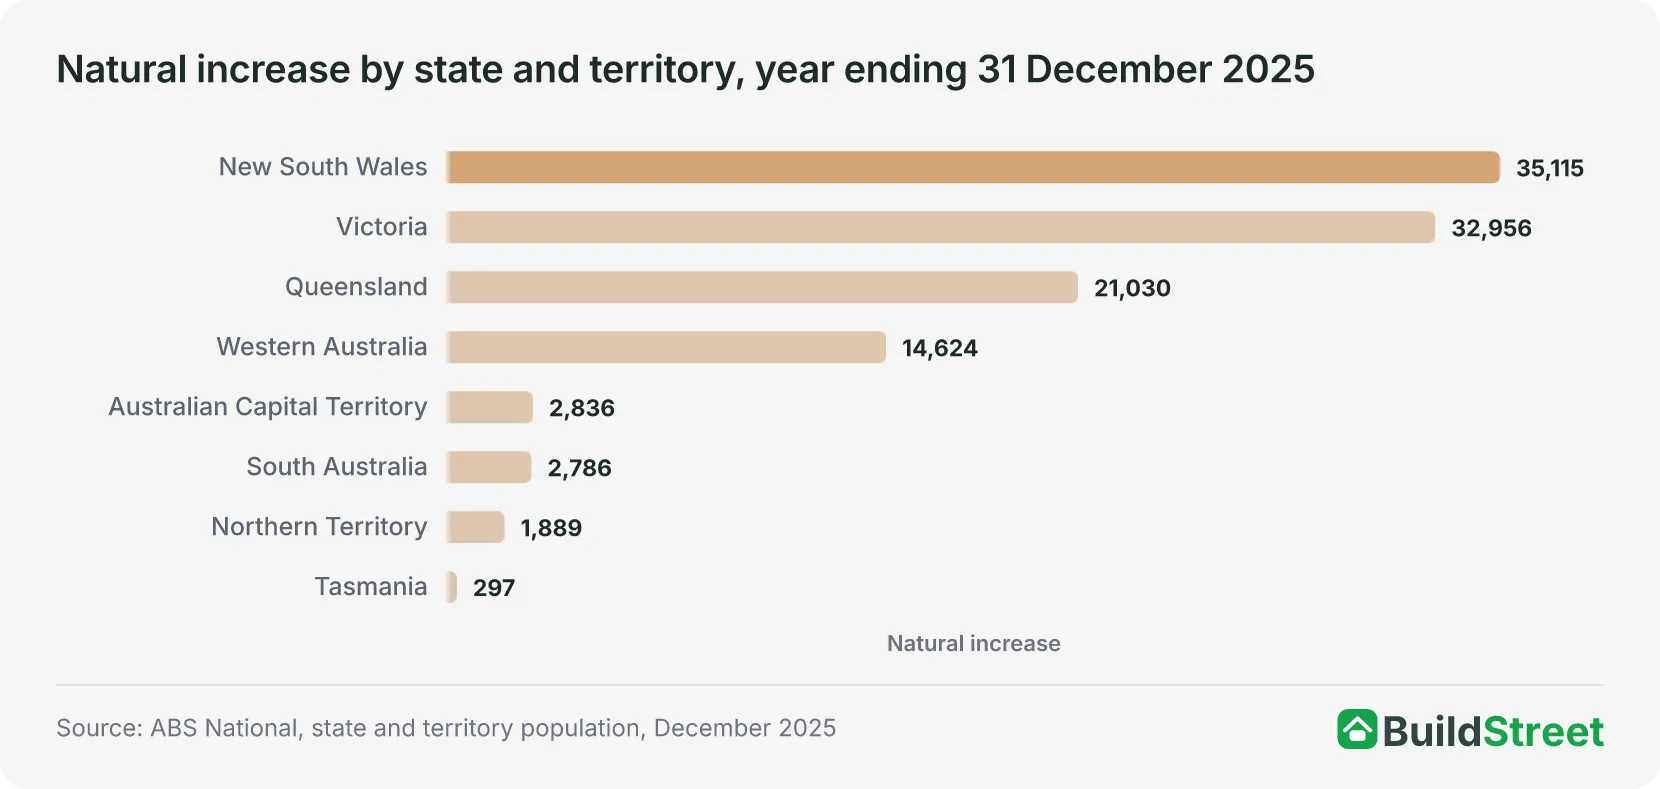
New South Wales recorded the largest natural increase of any state or territory in 2025, at 35,115 people, from 95,248 births and 60,133 deaths. Victoria had the next largest, at 32,956, followed by Queensland at 21,030 and Western Australia at 14,624. Tasmania had the smallest, at 2971.
Net overseas migration exceeded natural increase in every state and territory in 2025. The Australian Capital Territory had the highest share of growth from natural increase, at 47.0 per cent, representing 2,836 of 6,033 people added. The Northern Territory had the next highest share, at 44.6 per cent. Tasmania had the lowest share, at 10.2 per cent of its growth of 2,9081.
Victoria’s quarterly birth counts are affected by registration processing. The ABS notes that Victorian birth registrations varied more from quarter to quarter between September 2024 and December 2025, affecting those preliminary counts4.
| Components of population change by state and territory, year ending 31 December 2025 | ||||||
|---|---|---|---|---|---|---|
| State or territory | Births | Deaths | Natural increase | Net interstate migration | Net overseas migration | Total growth |
| New South Wales | 95,248 | 60,133 | 35,115 | -21,465 | 90,961 | 104,611 |
| Victoria | 79,594 | 46,638 | 32,956 | -685 | 85,044 | 117,315 |
| Queensland | 59,442 | 38,412 | 21,030 | +16,528 | 54,604 | 92,162 |
| Western Australia | 32,906 | 18,282 | 14,624 | +10,419 | 40,422 | 65,465 |
| Australian Capital Territory | 5,317 | 2,481 | 2,836 | -1,541 | 4,738 | 6,033 |
| South Australia | 18,403 | 15,617 | 2,786 | -1,576 | 18,518 | 19,728 |
| Northern Territory | 3,342 | 1,453 | 1,889 | -1,228 | 3,579 | 4,240 |
| Tasmania | 5,693 | 5,396 | 297 | -452 | 3,063 | 2,908 |
| Australia | 299,984 | 188,445 | 111,539 | 0 | 300,955 | 412,494 |
Source · ABS National, state and territory population tables, December 2025, Table 1
Section 06 · The long run
How have births, deaths and natural increase in Australia changed since 1982?
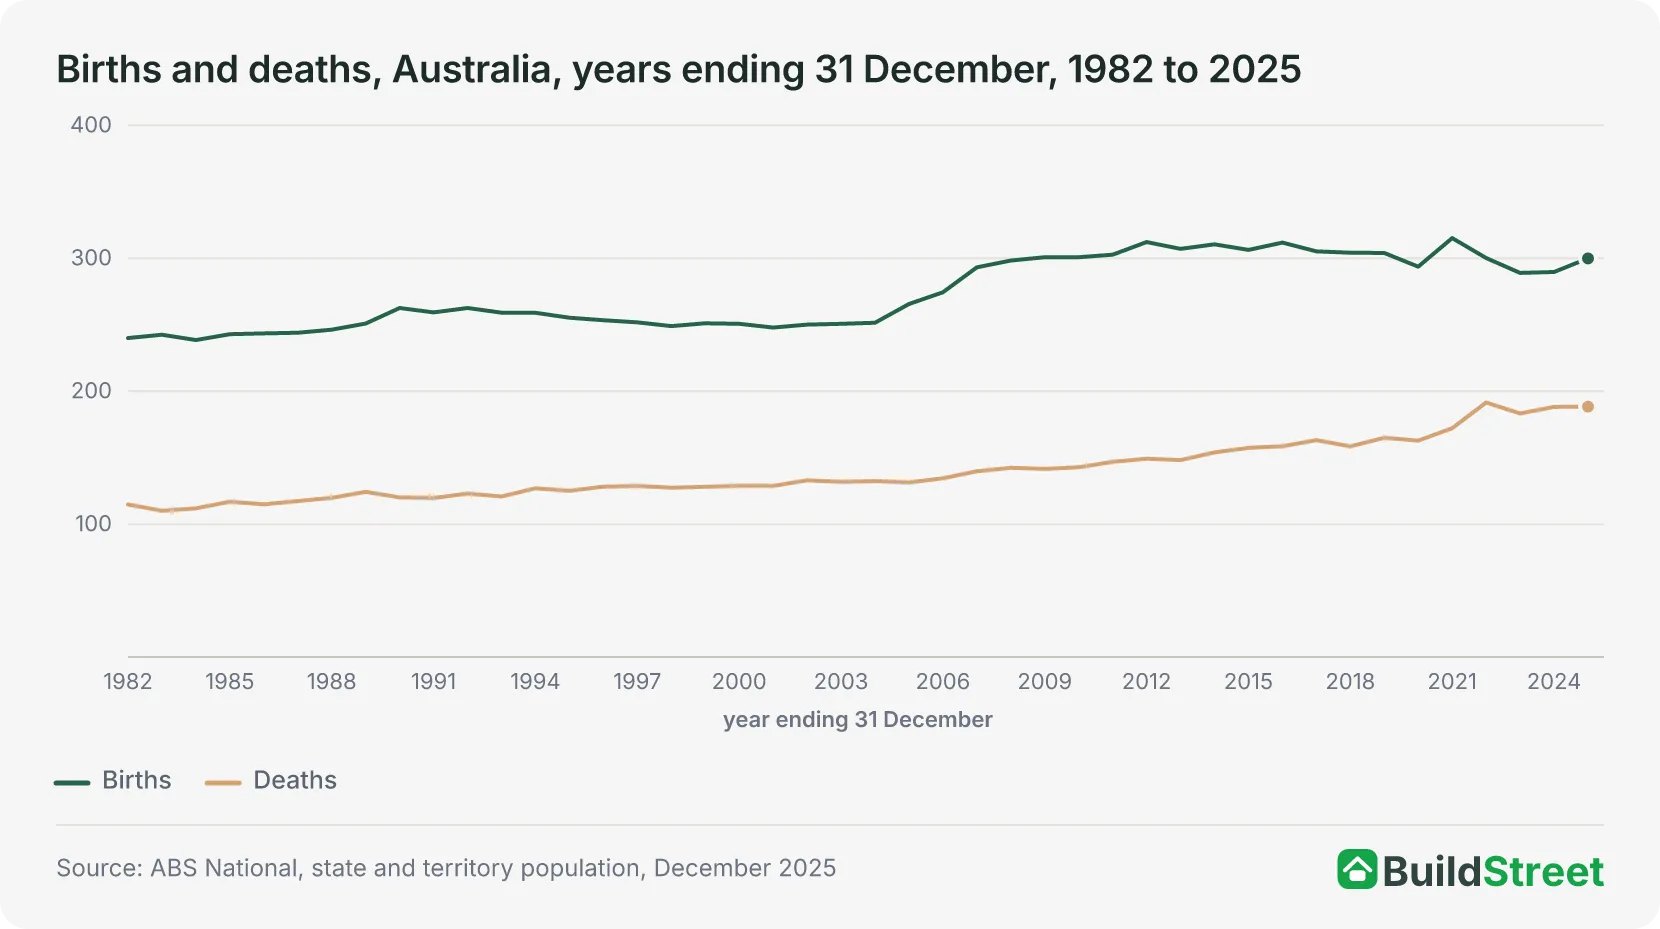
Births and deaths both increased between 1982 and 2025, but deaths rose faster, while natural increase was lower in recent years than at its 2012 peak.
Annual deaths grew from 114,800 in 1982 to 188,400 in 2025, an increase of 64 per cent, while births grew from 240,000 to 299,900, an increase of 25 per cent1. These annual values are totals across the four quarters of the ABS data, which is published in thousands and rounded to the nearest hundred. Deaths were equal to 47.8 per cent of births in 1982 and 62.8 per cent in 2025.
Births exceeded deaths in every year from 1982 to 2025. In these population estimates, births peaked at 315,200 in 2021 and deaths at 191,500 in 2022.
Natural increase exceeded 150,000 in nine of the 10 years from 2007 to 2016, peaking at 163,064 in 2012. It was below 115,000 in each of the four years from 2022 to 20251.
The ABS population projections, which set out the fertility, life expectancy and migration assumptions, are covered in the population projections article.
| Births and deaths, Australia, selected years ending 31 December, 1985 to 2025 | ||||
|---|---|---|---|---|
| Year ending 31 December | Births (thousands) | Deaths (thousands) | Births minus deaths (thousands) | Deaths as % of births |
| 1985 | 242.9 | 116.9 | 126.0 | 48.1 |
| 1995 | 255.3 | 125.1 | 130.2 | 49.0 |
| 2005 | 265.6 | 131.4 | 134.2 | 49.5 |
| 2015 | 306.3 | 157.4 | 148.9 | 51.4 |
| 2025 | 299.9 | 188.4 | 111.5 | 62.8 |
Source · ABS National, state and territory population, December 2025, Population and components of change, national (time series Table 1)
Section 07
Births and deaths in Australia: quick answers
How many babies are born in Australia each year?
Australia recorded an estimated 299,984 births in the year ending 31 December 2025, according to the ABS National, state and territory population data for December 2025, which estimates births by when they occurred. Separately, annual registration data shows that registered births increased from 286,998 in 2023 to 292,318 in 2024, a rise of 5,320, or 1.9 per cent. The ABS attributes part of that increase to changes in registration processing times in some states and territories. Registered births peaked at 315,147 in 2018.
What is Australia’s birth rate?
Australia’s crude birth rate fell from 12.8 births per 1,000 people in 2014 to 10.7 in 2024, according to Births, Australia, 2024. The total fertility rate, which allows fertility to be compared across years and places, was 1.481 babies per woman in 2024, the lowest in ABS data going back to 1924.
Is Australia’s fertility rate below replacement level?
Yes. The ABS estimates the replacement level of fertility at about 2.1 babies per woman, and Australia’s total fertility rate has been below 2.1 in every year since 1976. The rate was 1.795 in 2014, 1.499 in 2023 and 1.481 in 2024. It peaked at 3.548 in 1961.
How many people die in Australia each year?
There were 187,268 deaths registered in Australia in 2024, according to Deaths, Australia, 2024. Registrations increased from 183,131 in 2023 to 187,268 in 2024, a rise of 4,137. On the ABS population estimates basis, which counts deaths by when they occurred, there were 188,445 deaths in 2025. The standardised death rate, which removes the effect of the population’s age structure, fell from 5.130 deaths per 1,000 standard population in 2023 to 5.078 in 2024.
What is natural increase, and how big is it in Australia?
Natural increase is the number of births minus the number of deaths. In 2025, it was 111,539 people, from 299,984 births and 188,445 deaths, according to the ABS National, state and territory population data for December 2025. Natural increase accounted for 27.0 per cent of the year’s population growth of 412,494, while net overseas migration accounted for the remaining 300,955.
What is life expectancy in Australia?
Life expectancy at birth in Australia was 81.1 years for males and 85.1 years for females in 2022-2024, unchanged from 2021-2023, according to the ABS Life expectancy data. Life expectancy declined in 2020-2022 and again in 2021-2023, the first decreases since the mid-1990s. The ABS states that the 2022-2024 period was affected by the COVID-19 pandemic. The Australian Capital Territory had the highest life expectancy for both males, at 82.0 years, and females, at 85.8 years, and the Northern Territory the lowest, at 77.0 and 80.7 years. In 1994, life expectancy at birth was 75.0 years for males and 80.9 for females.
References
- ABS National, State and Territory Population, December 2025 · Australian Bureau of Statistics ↑ b c d e f g h i
- ABS Births, Australia, 2024 · Australian Bureau of Statistics ↑ b c d e f g
- ABS Deaths, Australia, 2024 · Australian Bureau of Statistics ↑ b c d
- ABS, National, state and territory population methodology, December 2025 · Australian Bureau of Statistics ↑ b c
- ABS Births, Australia methodology, 2024 · Australian Bureau of Statistics ↑
- ABS Life expectancy, 2022-2024 · Australian Bureau of Statistics ↑ b c
