

Published 28 Aug 2026 · Updated 18 Sept 2026
 The state around the cityGreater Melbourne held 76.8 per cent of the people in Victoria's two broad regions at 30 June 2025. The state page covers Victoria's total, its growth and its components of change.
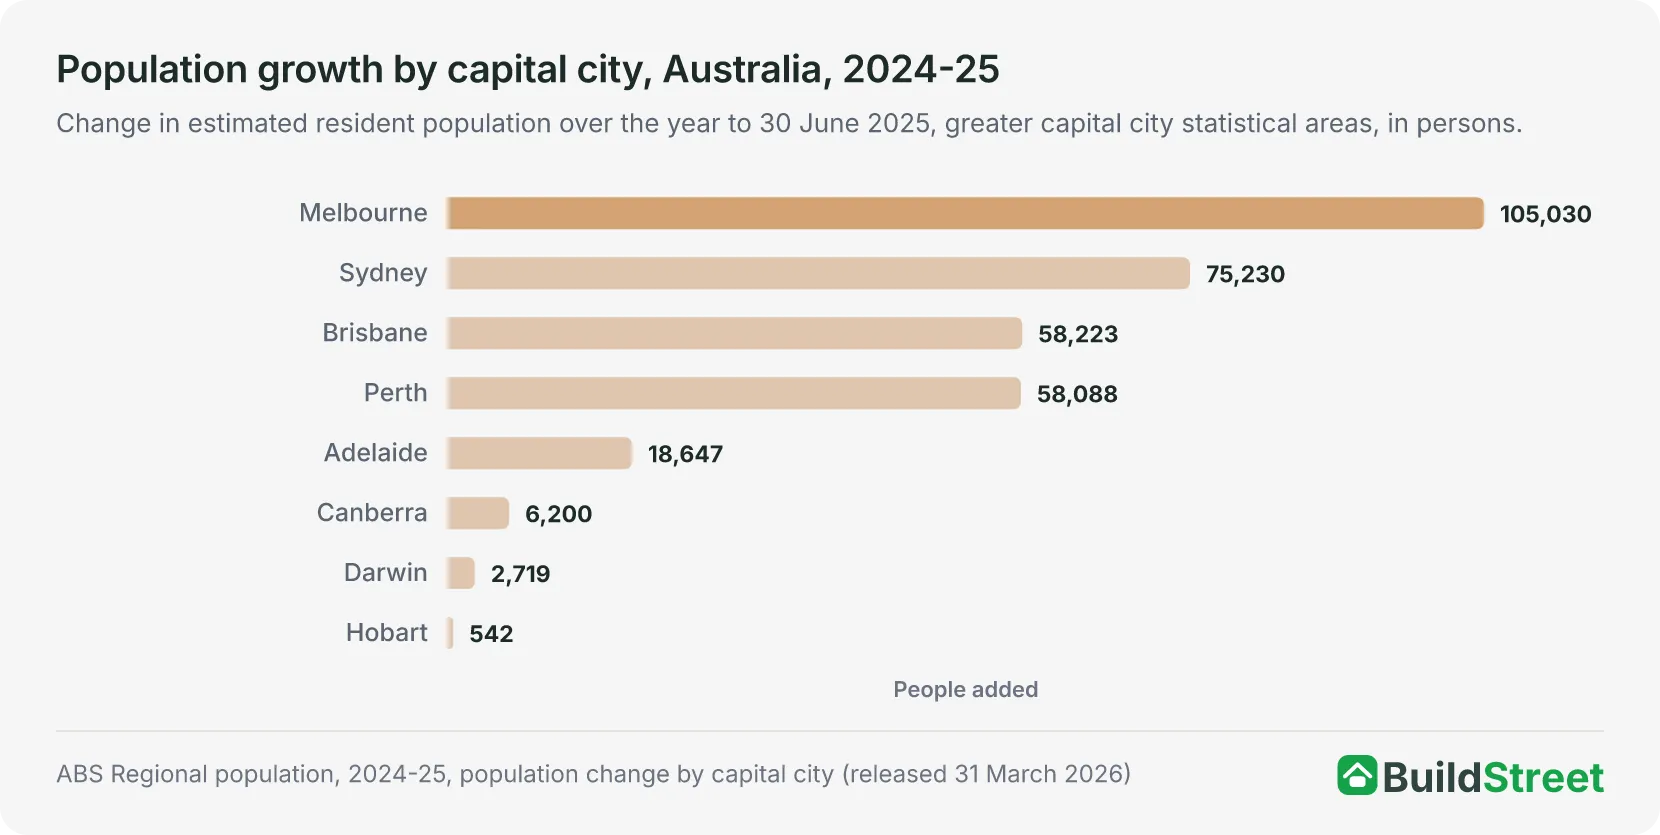 How other cities compareMelbourne added the most people of any capital in 2024-25 and Perth grew at the fastest rate, while Sydney stayed the largest. The cities article ranks growth across Australia's capitals and regional centres.
Section 01 · The headline number
How many people live in Melbourne?
Greater Melbourne had an estimated resident population of 5,435,590 at 30 June 20251. That was the second-largest population among the eight capital cities, 203,240 fewer than Greater Sydney's 5,638,830. Melbourne accounted for 19.7 per cent of Australia's population, or about one in five people, against the national total of 27,613,6542.
The ABS updates the city estimate once a year, at 30 June, and the 30 June 2025 figures are preliminary and subject to revision. The next release, covering 30 June 2026, is due on 25 March 20271.
Section 02 · The pace
How fast is Melbourne's population growing?
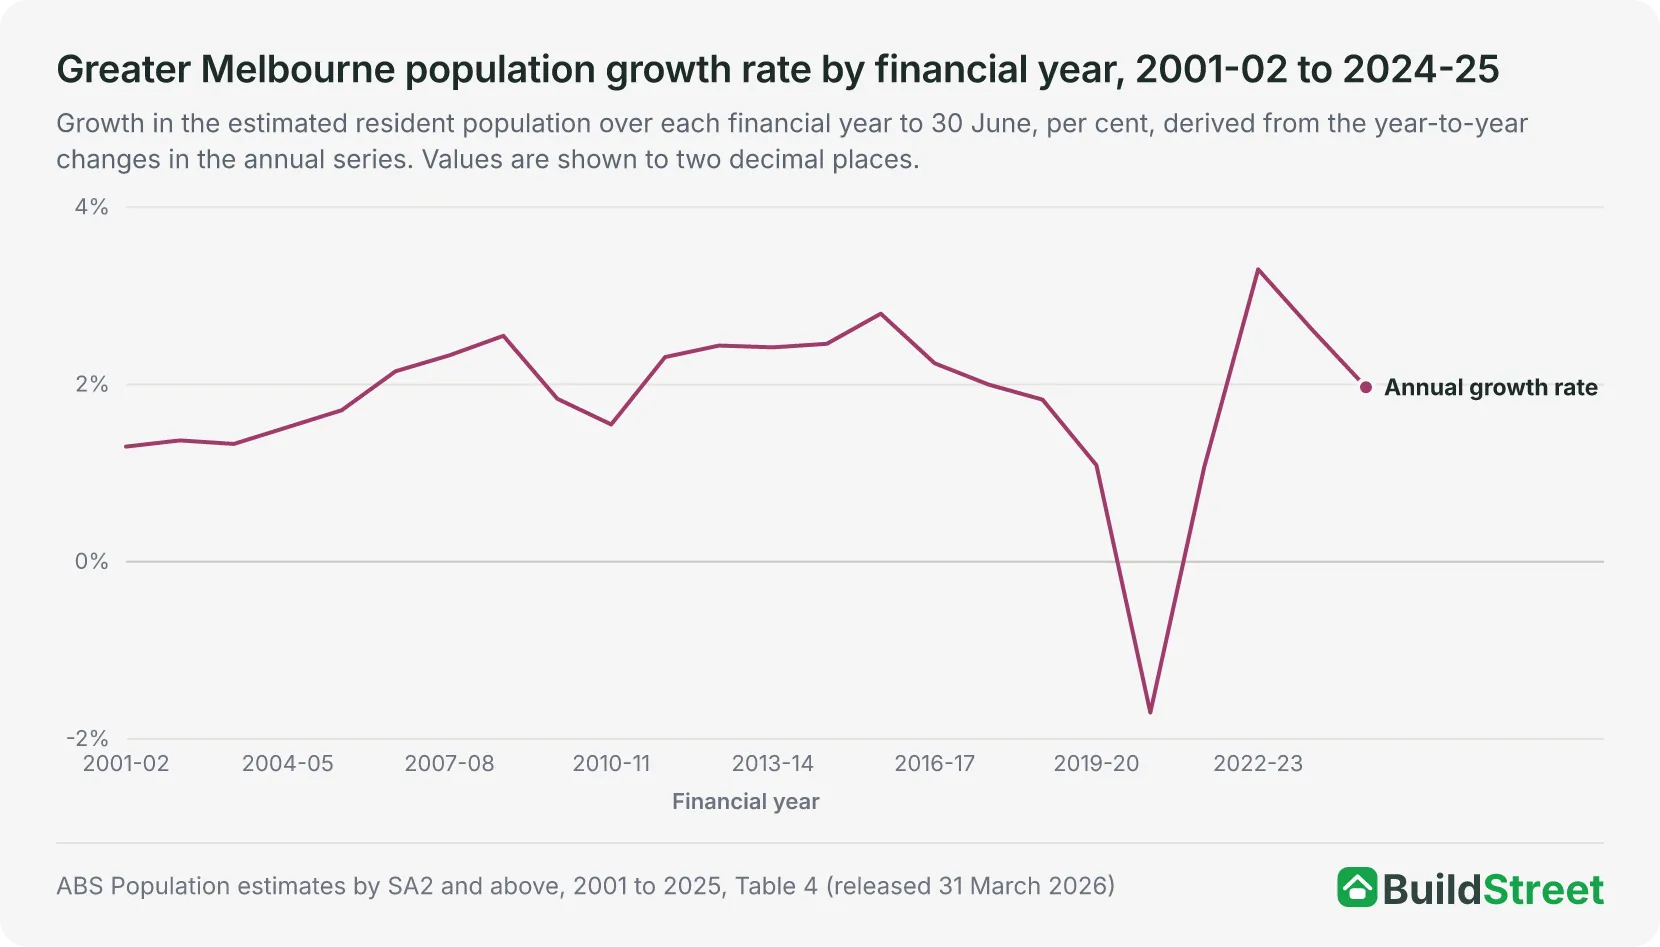
Greater Melbourne added 105,030 people, or 1.97 per cent, in 2024-25. The ABS data rounds the growth rate to 2.0 per cent. The increase was the largest of any Australian capital and the city's smallest in three years, after 166,071 (3.30 per cent) in 2022-23 and 136,069 (2.62 per cent) in 2023-242.
Across the 24 financial years from 2001-02 to 2024-25, Greater Melbourne's population change ranged from a 1.70 per cent fall to 3.30 per cent growth. The fastest year was 2022-23, when the city added 166,071 people (3.30 per cent), the largest increase and the highest rate over the period. The population fell once, by 85,788 people (1.70 per cent) over 2020-21; the data do not identify the cause. Apart from that year, the smallest increase came in 2001-02, when the city added 45,330 people, and the slowest rate was 1.07 per cent, in 2021-222.
The fall and the peak were two years apart. Growth slowed in each of the two years that followed.
Section 03 · The drivers
What drives Melbourne's population growth?
Net overseas migration was the largest contributor to Greater Melbourne's population growth in 2024-25, adding 81,168 people. Natural increase (births minus deaths) added 32,416, and net internal migration (moves to and from elsewhere in Australia) subtracted 8,5541. The three components total 105,030, matching the change in the population data. Melbourne's net overseas migration gain was the largest of the eight capitals, ahead of Sydney's 78,403, Perth's 37,289 and Brisbane's 33,934.
In each of the four financial years, more people left Greater Melbourne for elsewhere in Australia than moved into the city from elsewhere in the country. The net loss fell from 36,282 in 2021-22 to 9,466 in 2022-23, then was 10,866 in 2023-24 and 8,554 in 2024-25, the smallest of the four. The ABS reports that Sydney and Melbourne recorded the largest net internal migration losses, while Brisbane and Perth were the only capitals with net internal migration gains in 2024-251.
Net overseas migration exceeded the net internal migration loss in each of the four years. It peaked at 149,271 people in 2022-23, then fell to 119,037 in 2023-24 and 81,168 in 2024-25, just over half the peak31.
State-to-state flows across all eight states and territories are covered in the interstate migration article.
| Components of Greater Melbourne population change, 2024-25 | ||
|---|---|---|
| Component | People | Derivation |
| Net overseas migration | +81,168 | 147,899 arrivals minus 66,731 departures |
| Natural increase | +32,416 | 63,057 births minus 30,641 deaths |
| Net internal migration | -8,554 | 74,841 arrivals minus 83,395 departures |
| Total growth | +105,030 | Derived sum; the release's commentary rounds it to 105,000 |
Source · ABS Population components by SA2 and above, 2021-22 to 2024-25, Table 4
Section 04 · The growth areas
Which parts of Melbourne are growing the most?
The areas in Melbourne adding the most people in 2024-25 were on the city's outer edges. The ABS identified Rockbank - Mount Cottrell (up 4,600 people) and Fraser Rise - Plumpton (up 4,100), both in Melbourne's outer west, and Mickleham - Yuroke (up 4,100) in Melbourne's outer north as the Victorian areas with the largest population growth in 2024-25. Rockbank - Mount Cottrell grew from 31,254 to 35,856 people, Fraser Rise - Plumpton from 20,675 to 24,739 and Mickleham - Yuroke from 35,244 to 39,389 over the year1.
Melbourne areas accounted for four of the five places in the national largest-growth table for 2024-25. Rockbank - Mount Cottrell's 4,602-person increase was the largest in Australia, followed by Mickleham - Yuroke's 4,145 and Fraser Rise - Plumpton's 4,064; Clyde North - South, up 3,771, ranked fifth behind Sydney's Box Hill - Nelson. Port Melbourne Industrial had the highest growth rate in the country, at 22.6 per cent, with Fraser Rise - Plumpton third at 19.7 per cent and Tarneit - North fourth at 18.5 per cent1.
Within Victoria, Rockbank - Mount Cottrell also recorded the largest natural increase, at 976 people, and the largest net internal migration gain, at 3,511, while Carlton, in inner Melbourne, had the largest net overseas migration gain, at 1,78731.
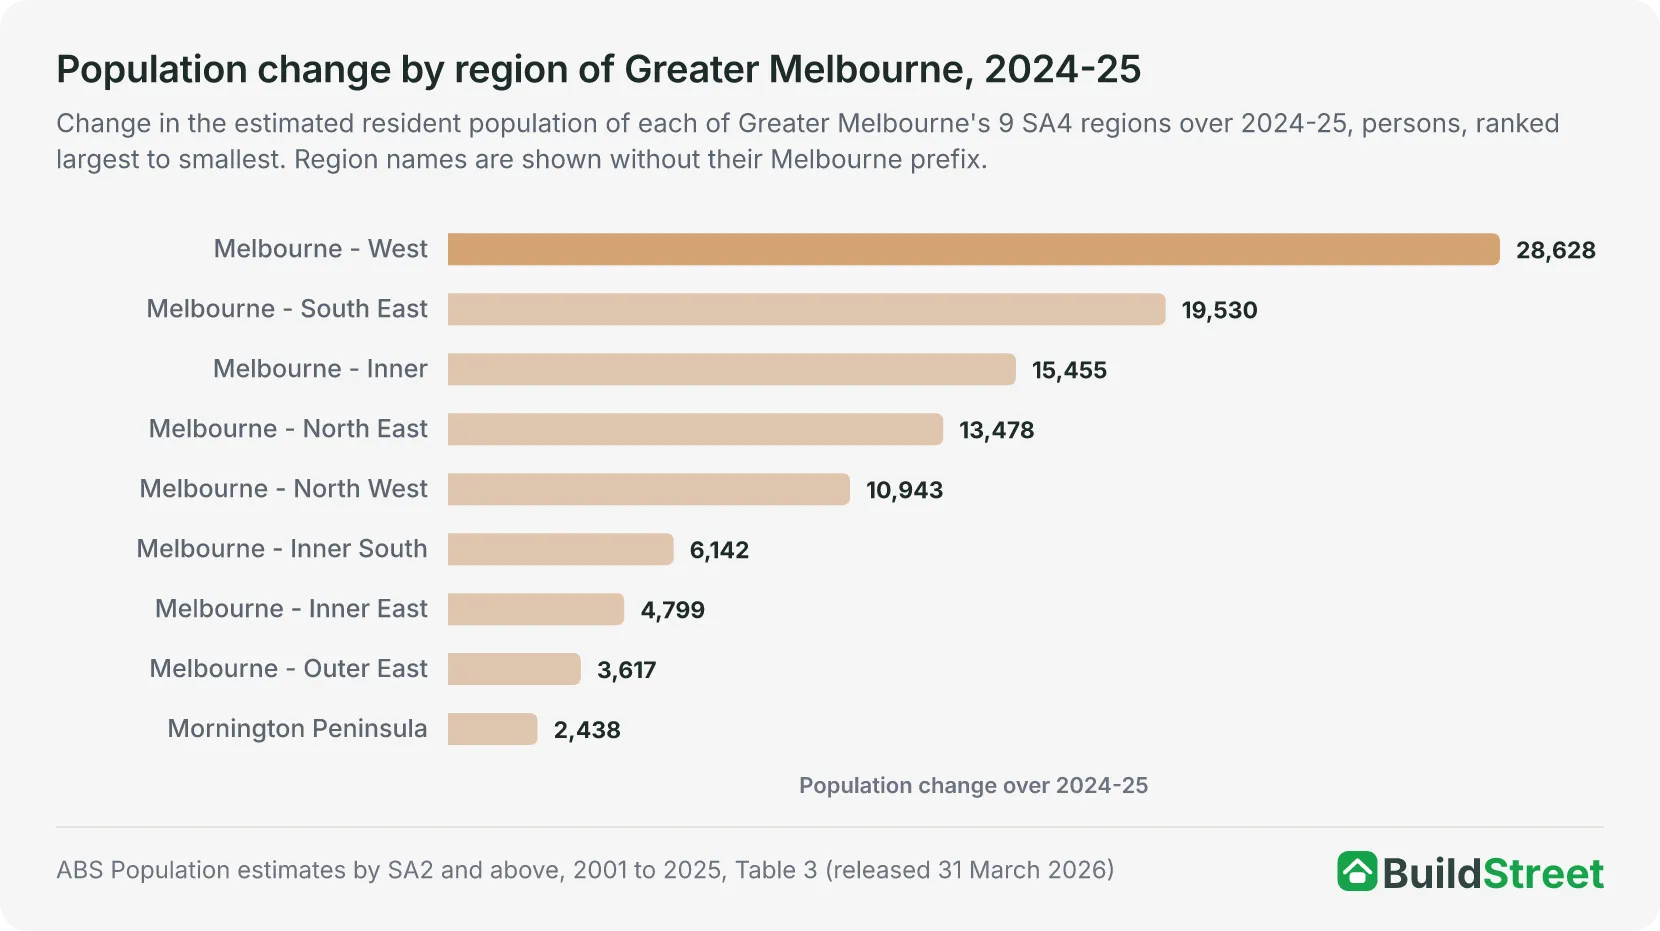
Every broad region of the city grew over 2024-25. Melbourne - West added 28,628 people and Melbourne - South East added 19,530, the two largest increases among Greater Melbourne's nine broad regions. The smallest increase was on the Mornington Peninsula, at 2,4382. The ABS reports that the centre of population for Greater Melbourne was in the suburb of Malvern, near the Monash Freeway, at June 2025 and moved 130 metres north-west over the year, reflecting stronger growth in Melbourne's north-west1.
| The fastest growing areas of Melbourne, 2024-25 | |||||
|---|---|---|---|---|---|
| Area (SA2) | Region (SA4) | 30 June 2024 | 30 June 2025 | Change | Growth rate % |
| Rockbank - Mount Cottrell | West | 31,254 | 35,856 | +4,602 | 14.7 |
| Mickleham - Yuroke | North West | 35,244 | 39,389 | +4,145 | 11.8 |
| Fraser Rise - Plumpton | West | 20,675 | 24,739 | +4,064 | 19.7 |
Source · ABS Population estimates and components by SA2, 2024 to 2025, Table 2
Section 05 · The state share
How much of Victoria's population lives in Melbourne?
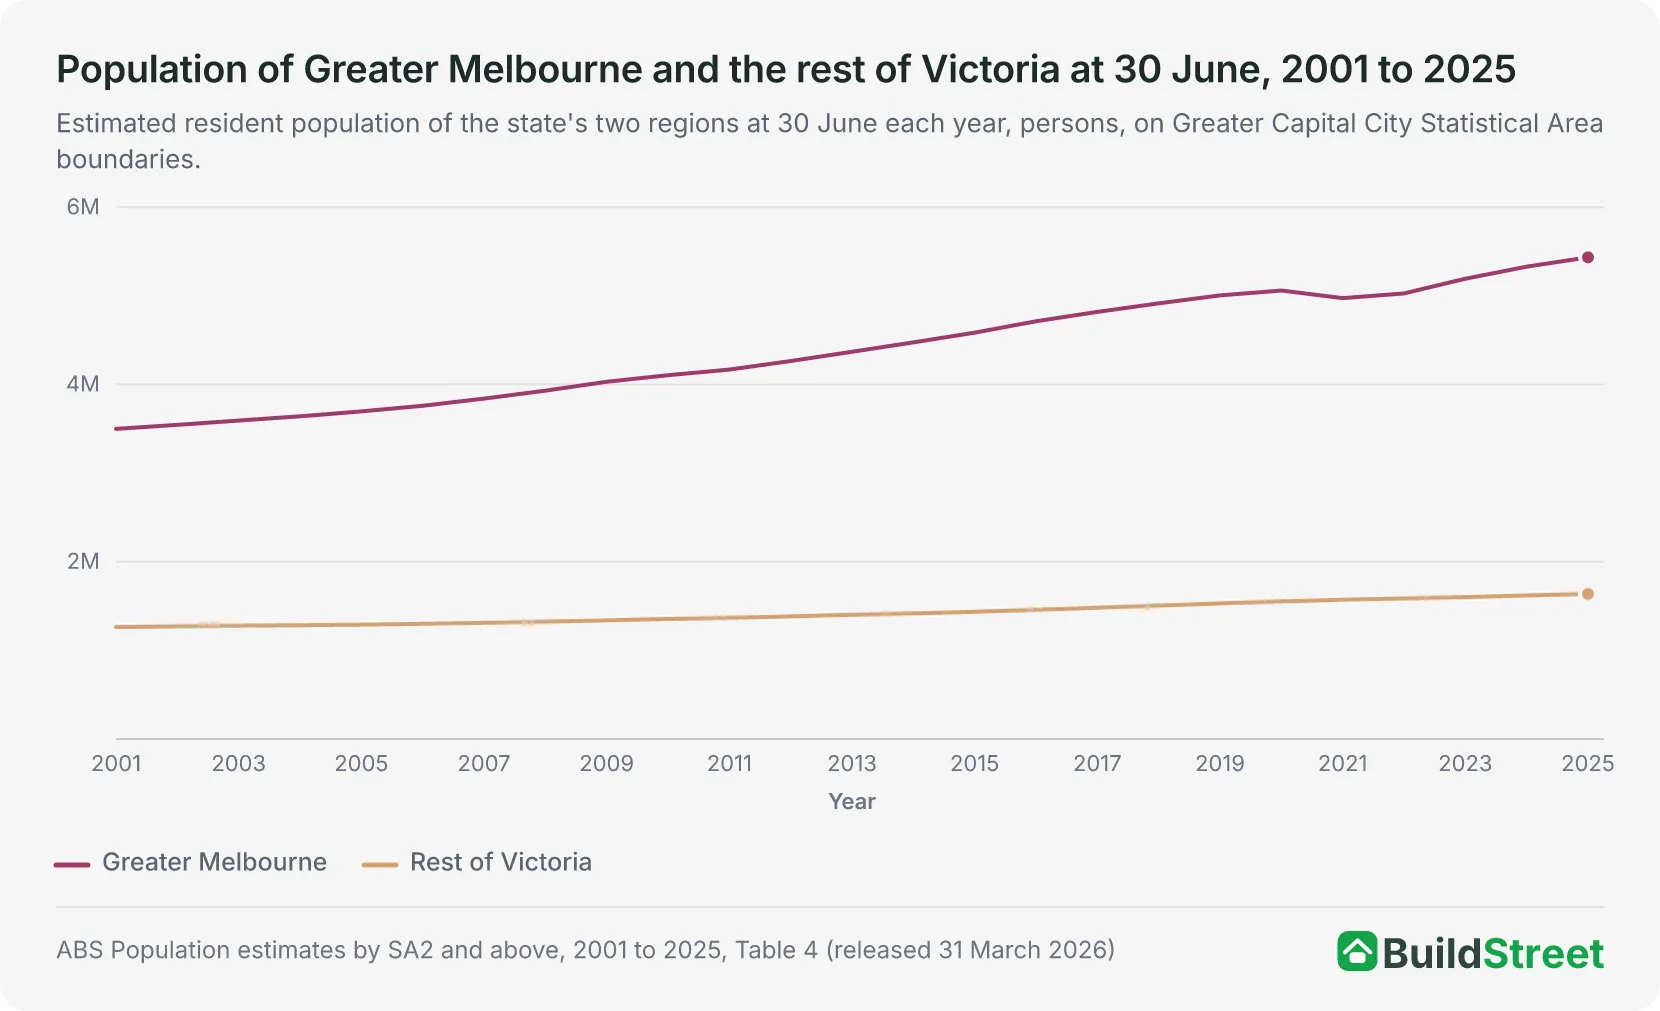
More than three quarters of Victoria's population lived in Greater Melbourne at 30 June 2025. Melbourne had 5,435,590 people and the rest of Victoria 1,638,269, so the capital accounted for 76.8 per cent of the 7,073,859 total across the two regions. The share was 73.5 per cent at 30 June 2001, when the capital had 3,500,249 of the 4,763,615 people across the same two regions2.
The gap between the capital and the rest of the state widened from 2,236,883 people at 30 June 2001 to 3,797,321 at 30 June 2025. The rest of the state added 17,868 people, or 1.10 per cent, over 2024-252.
Melbourne's capital share ranked third among the six states at 30 June 2025. Perth had 80.6 per cent of its state's two-region total and Adelaide 78.4 per cent, while Melbourne had 76.8 per cent, Sydney 65.6 per cent, Brisbane 50.0 per cent and Hobart 44.3 per cent2.
Section 06 · The other capitals
How does Melbourne compare with Australia's other capital cities?
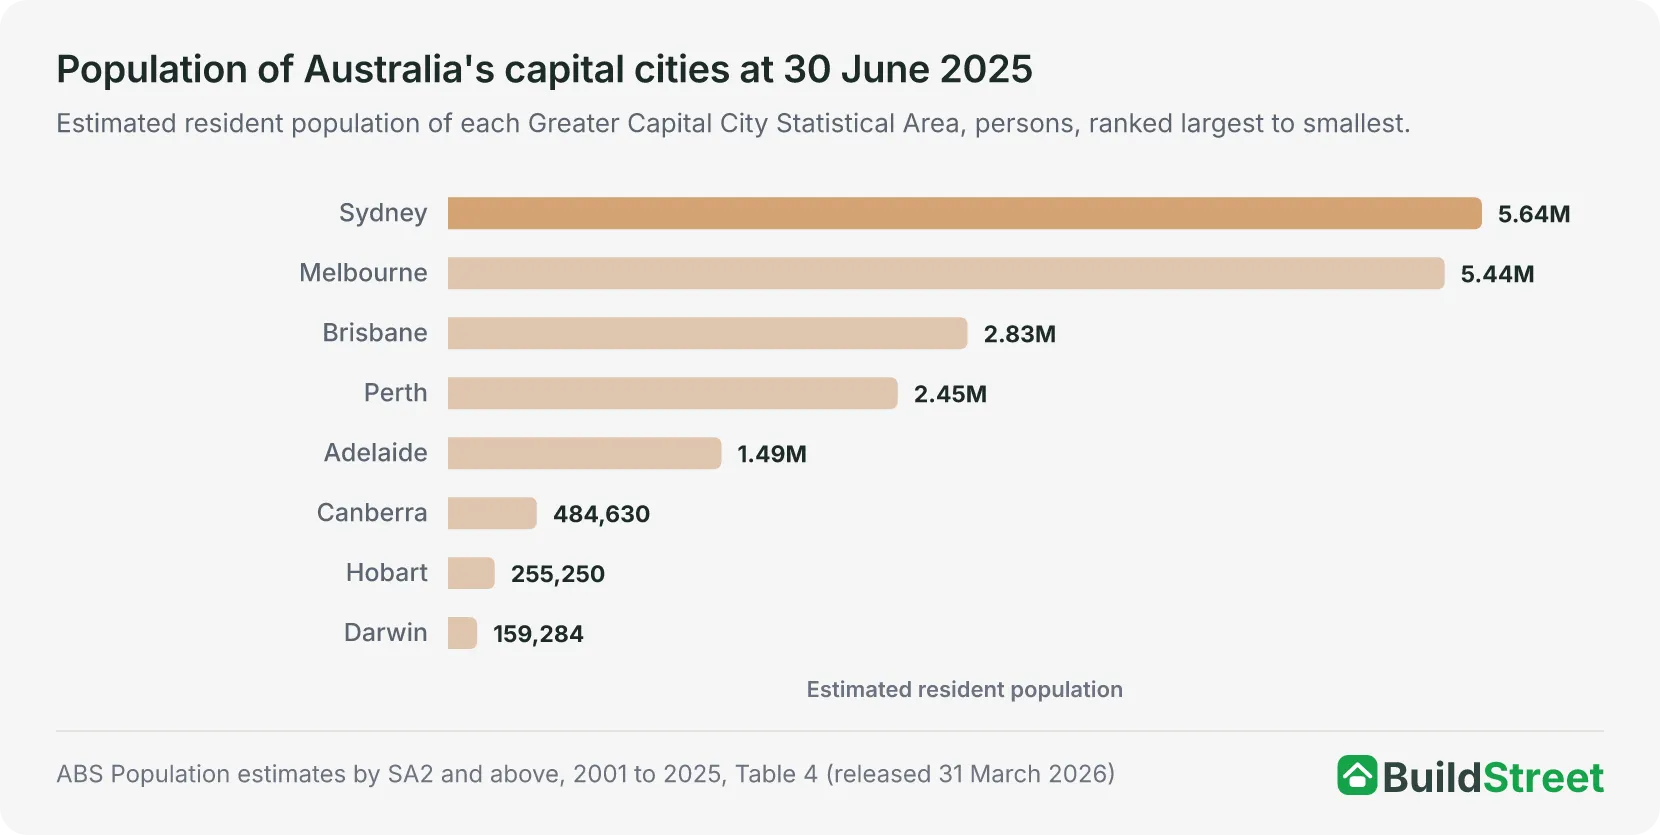
Melbourne was the second largest of the eight capital cities by population at 30 June 2025, with 5,435,590 people compared with Greater Sydney's 5,638,830. Greater Brisbane was third, with 2,833,5242.
The growth rankings differed from the size rankings in 2024-25. Melbourne recorded the largest increase of the eight capitals over 2024-25, at 105,030 people, followed by Sydney's 75,230, Brisbane's 58,223 and Perth's 58,088; Perth had the highest growth rate, at 2.4 per cent, followed by Brisbane at 2.1 and Melbourne at 2.0. Melbourne's derived rate of 1.97 per cent ranked third of the eight, ahead of Darwin's 1.74, Sydney's 1.35, Canberra's 1.30, Adelaide's 1.27 and Hobart's 0.211.
The gap between the two largest cities narrowed over the period. Greater Sydney had 602,331 more people than Greater Melbourne at 30 June 2001 and 203,240 more at 30 June 2025, the narrowest gap in the series; Melbourne added 1,935,341 people over those 24 years compared with 1,536,250 in Sydney2.
The eight capitals together had 18,750,888 people at 30 June 2025, after growing by 324,679 (1.8 per cent) over the year; Melbourne accounted for 29.0 per cent of the combined capital population1.
Sydney's data is covered in the Sydney population article.
| Population of Australia's capital cities, as at 30 June 2025 | |||
|---|---|---|---|
| Capital city | Population | Change over 2024-25 | Growth rate % |
| Sydney | 5,638,830 | +75,230 | 1.35 |
| Melbourne | 5,435,590 | +105,030 | 1.97 |
| Brisbane | 2,833,524 | +58,223 | 2.10 |
| Perth | 2,452,765 | +58,088 | 2.43 |
| Adelaide | 1,491,015 | +18,647 | 1.27 |
| Canberra | 484,630 | +6,200 | 1.30 |
| Hobart | 255,250 | +542 | 0.21 |
| Darwin | 159,284 | +2,719 | 1.74 |
| All capital cities | 18,750,888 | +324,679 | 1.76 |
Source · ABS Population estimates by SA2 and above, 2001 to 2025, Table 4
Section 07 · The long run
How has Melbourne's population changed since 2001?
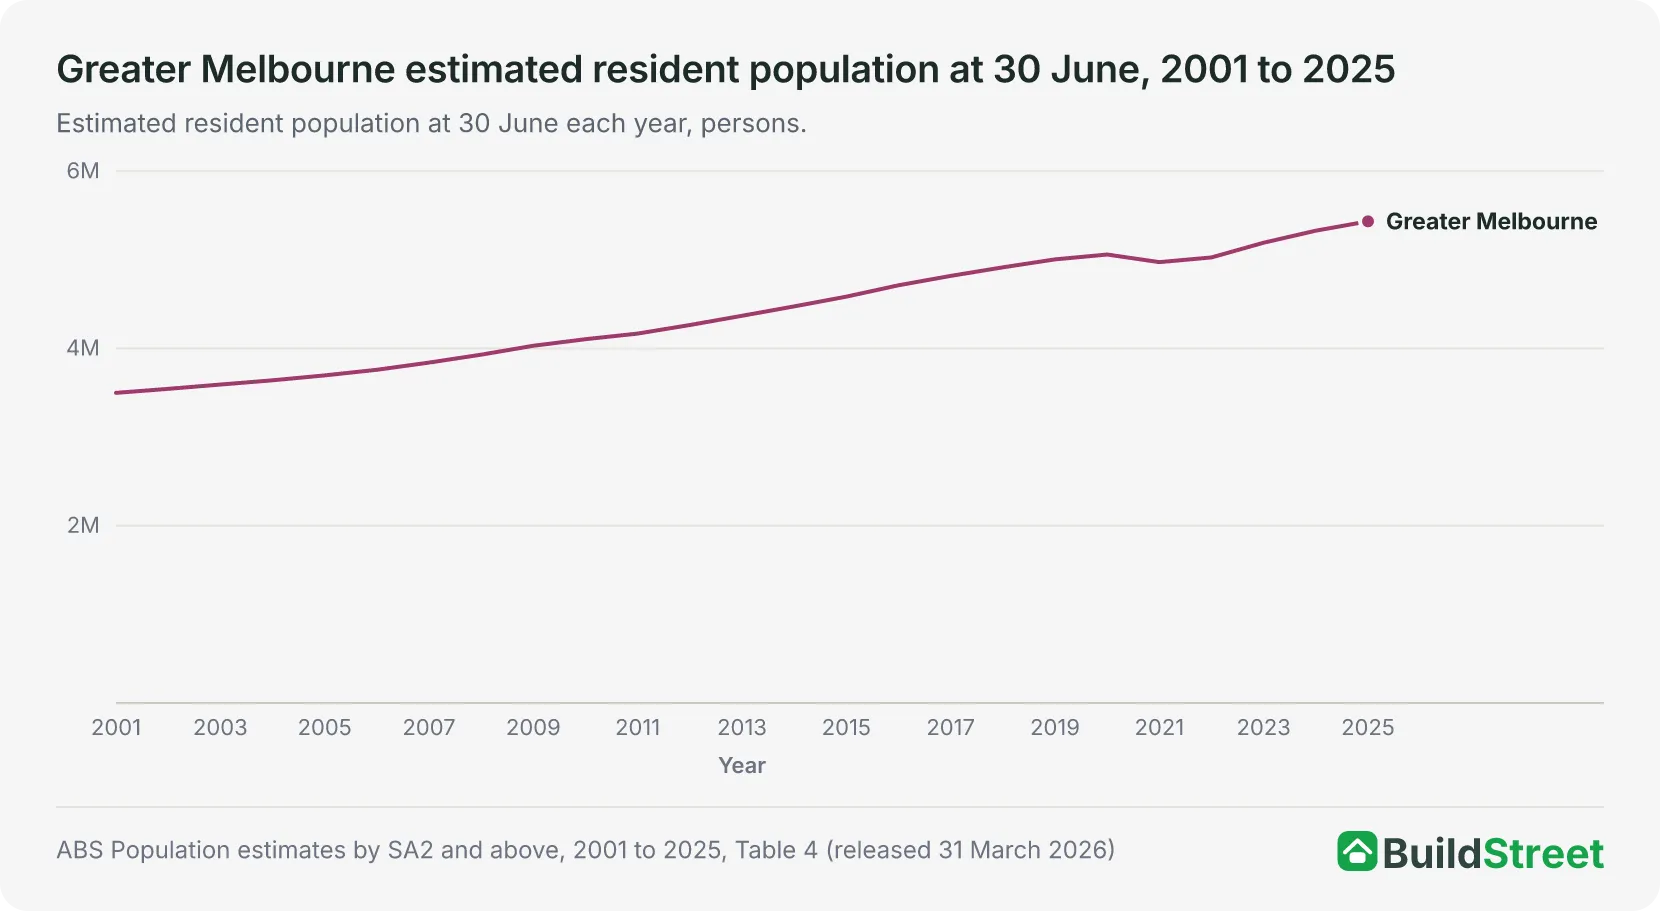
Greater Melbourne added 1,935,341 people between 30 June 2001 and 30 June 2025, growing from 3,500,249 to 5,435,590. Its population was 1.55 times its 2001 level, and the increase was the largest of the eight capital cities over the period2.
Greater Melbourne first exceeded 4 million at 30 June 2009, 4.5 million at 30 June 2015 and 5 million at 30 June 2019. The population was below 5 million again at 30 June 2021, at 4,975,319, and returned above 5 million at 30 June 2022, at 5,028,4202. The gaps between milestones were six years from 4 million to 4.5 million and four years from 4.5 million to 5 million.
Both extremes of the series occurred in the 2020s. The annual increase fell from 89,868 in 2018-19 to 54,650 in 2019-20, then the population fell by 85,788 over 2020-21. Growth resumed with an increase of 53,101 in 2021-22, reached 166,071 in 2022-23, and then slowed to 136,069 in 2023-24 and 105,030 in 2024-25, derived from the year-to-year changes2.
| Greater Melbourne population milestones, 2001 to 2025 | ||
|---|---|---|
| Milestone | First 30 June at or above | Population that year |
| 4 million | 30 June 2009 | 4,031,787 |
| 4.5 million | 30 June 2015 | 4,586,012 |
| 5 million | 30 June 2019 | 5,006,457 |
Source · ABS Population estimates by SA2 and above, 2001 to 2025, Table 4
Section 08
Melbourne population: quick answers
How many people live in Melbourne?
Greater Melbourne had an estimated resident population of 5,435,590 at 30 June 2025, the most recent year in the ABS Regional population series, released 31 March 2026. That was the second largest population of Australia's eight capital cities and represented 19.7 per cent of the national total of 27,613,654 on the same series. The 30 June 2025 estimates are preliminary; the next release, covering 30 June 2026, is due on 25 March 2027.
Is Melbourne or Sydney Australia's largest city?
Sydney had the larger population on the ABS Greater Capital City Statistical Area boundaries: Greater Sydney had 5,638,830 residents at 30 June 2025 compared with Greater Melbourne's 5,435,590, a gap of 203,240 people. Melbourne recorded the larger increase over 2024-25, adding 105,030 people compared with Sydney's 75,230, and the gap was the narrowest in the series beginning in 2001, when it was 602,331.
How fast is Melbourne's population growing?
Greater Melbourne added 105,030 people, or 1.97 per cent, over the 2024-25 financial year, the largest increase of Australia's eight capital cities. The ABS publishes the rate as 2.0 per cent. The rate was the third fastest of the eight capitals, behind Perth and Brisbane. Annual growth peaked at 166,071 people (3.30 per cent) in 2022-23, and 2020-21 was the only year in the series from 2001-02 in which the population fell.
When did Melbourne's population pass 5 million?
Greater Melbourne first exceeded 5 million people at 30 June 2019, when the ABS annual series recorded 5,006,457 residents. The population was below 5 million again at 30 June 2021, at 4,975,319, and returned above the threshold at 30 June 2022. On the same basis the city first exceeded 4 million at 30 June 2009 and 4.5 million at 30 June 2015.
References
- ABS Regional population, 2024-25 · Australian Bureau of Statistics ↑ b c d e f g h i j k
- ABS Regional population, 2024-25: population estimates by SA2 and above, 2001 to 2025 (datacube 32180DS0003) · Australian Bureau of Statistics ↑ b c d e f g h i j k l
- ABS Regional population, 2024-25: population components by SA2 and above, 2021-22 to 2024-25 (datacube 32180DS0005) · Australian Bureau of Statistics ↑ b
